
|
|||||
|
 | |
| |
| |
| |
| |
| |
|
Gene: CKLF |
Gene summary for CKLF |
| Gene information | Species | Human | Gene symbol | CKLF | Gene ID | 51192 |
| Gene name | chemokine like factor | |
| Gene Alias | C32 | |
| Cytomap | 16q21 | |
| Gene Type | protein-coding | GO ID | GO:0002376 | UniProtAcc | Q9UBR5 |
Top |
Malignant transformation analysis |
| Identification of the aberrant gene expression in precancerous and cancerous lesions by comparing the gene expression of stem-like cells in diseased tissues with normal stem cells |
| Entrez ID | Symbol | Replicates | Species | Organ | Tissue | Adj P-value | Log2FC | Malignancy |
| 51192 | CKLF | GSM4909281 | Human | Breast | IDC | 9.48e-05 | 2.88e-01 | 0.21 |
| 51192 | CKLF | GSM4909282 | Human | Breast | IDC | 7.51e-32 | 6.00e-01 | -0.0288 |
| 51192 | CKLF | GSM4909291 | Human | Breast | IDC | 1.14e-02 | 2.57e-01 | 0.1753 |
| 51192 | CKLF | GSM4909297 | Human | Breast | IDC | 2.51e-05 | 2.19e-02 | 0.1517 |
| 51192 | CKLF | GSM4909301 | Human | Breast | IDC | 1.08e-16 | 4.83e-01 | 0.1577 |
| 51192 | CKLF | GSM4909311 | Human | Breast | IDC | 1.45e-12 | -1.33e-01 | 0.1534 |
| 51192 | CKLF | GSM4909312 | Human | Breast | IDC | 2.77e-06 | 9.95e-02 | 0.1552 |
| 51192 | CKLF | GSM4909319 | Human | Breast | IDC | 2.07e-18 | -3.29e-02 | 0.1563 |
| 51192 | CKLF | GSM4909320 | Human | Breast | IDC | 3.89e-03 | 1.79e-01 | 0.1575 |
| 51192 | CKLF | GSM4909321 | Human | Breast | IDC | 3.01e-07 | 1.32e-01 | 0.1559 |
| 51192 | CKLF | brca2 | Human | Breast | Precancer | 9.33e-03 | 1.96e-01 | -0.024 |
| 51192 | CKLF | M2 | Human | Breast | IDC | 4.13e-03 | 3.22e-01 | 0.21 |
| 51192 | CKLF | NCCBC11 | Human | Breast | DCIS | 9.75e-04 | 2.08e-01 | 0.1232 |
| 51192 | CKLF | NCCBC14 | Human | Breast | DCIS | 3.65e-02 | 5.39e-03 | 0.2021 |
| 51192 | CKLF | NCCBC3 | Human | Breast | DCIS | 4.10e-24 | 5.96e-01 | 0.1198 |
| 51192 | CKLF | NCCBC5 | Human | Breast | DCIS | 1.37e-06 | 2.82e-01 | 0.2046 |
| 51192 | CKLF | P1 | Human | Breast | IDC | 1.18e-04 | 6.75e-03 | 0.1527 |
| 51192 | CKLF | P2 | Human | Breast | IDC | 1.31e-02 | 2.17e-01 | 0.21 |
| 51192 | CKLF | DCIS2 | Human | Breast | DCIS | 3.37e-40 | 6.20e-02 | 0.0085 |
| 51192 | CKLF | CA_HPV_1 | Human | Cervix | CC | 1.67e-03 | -7.47e-02 | 0.0264 |
| Page: 1 2 3 4 5 6 7 8 |
| Tissue | Expression Dynamics | Abbreviation |
| Breast | 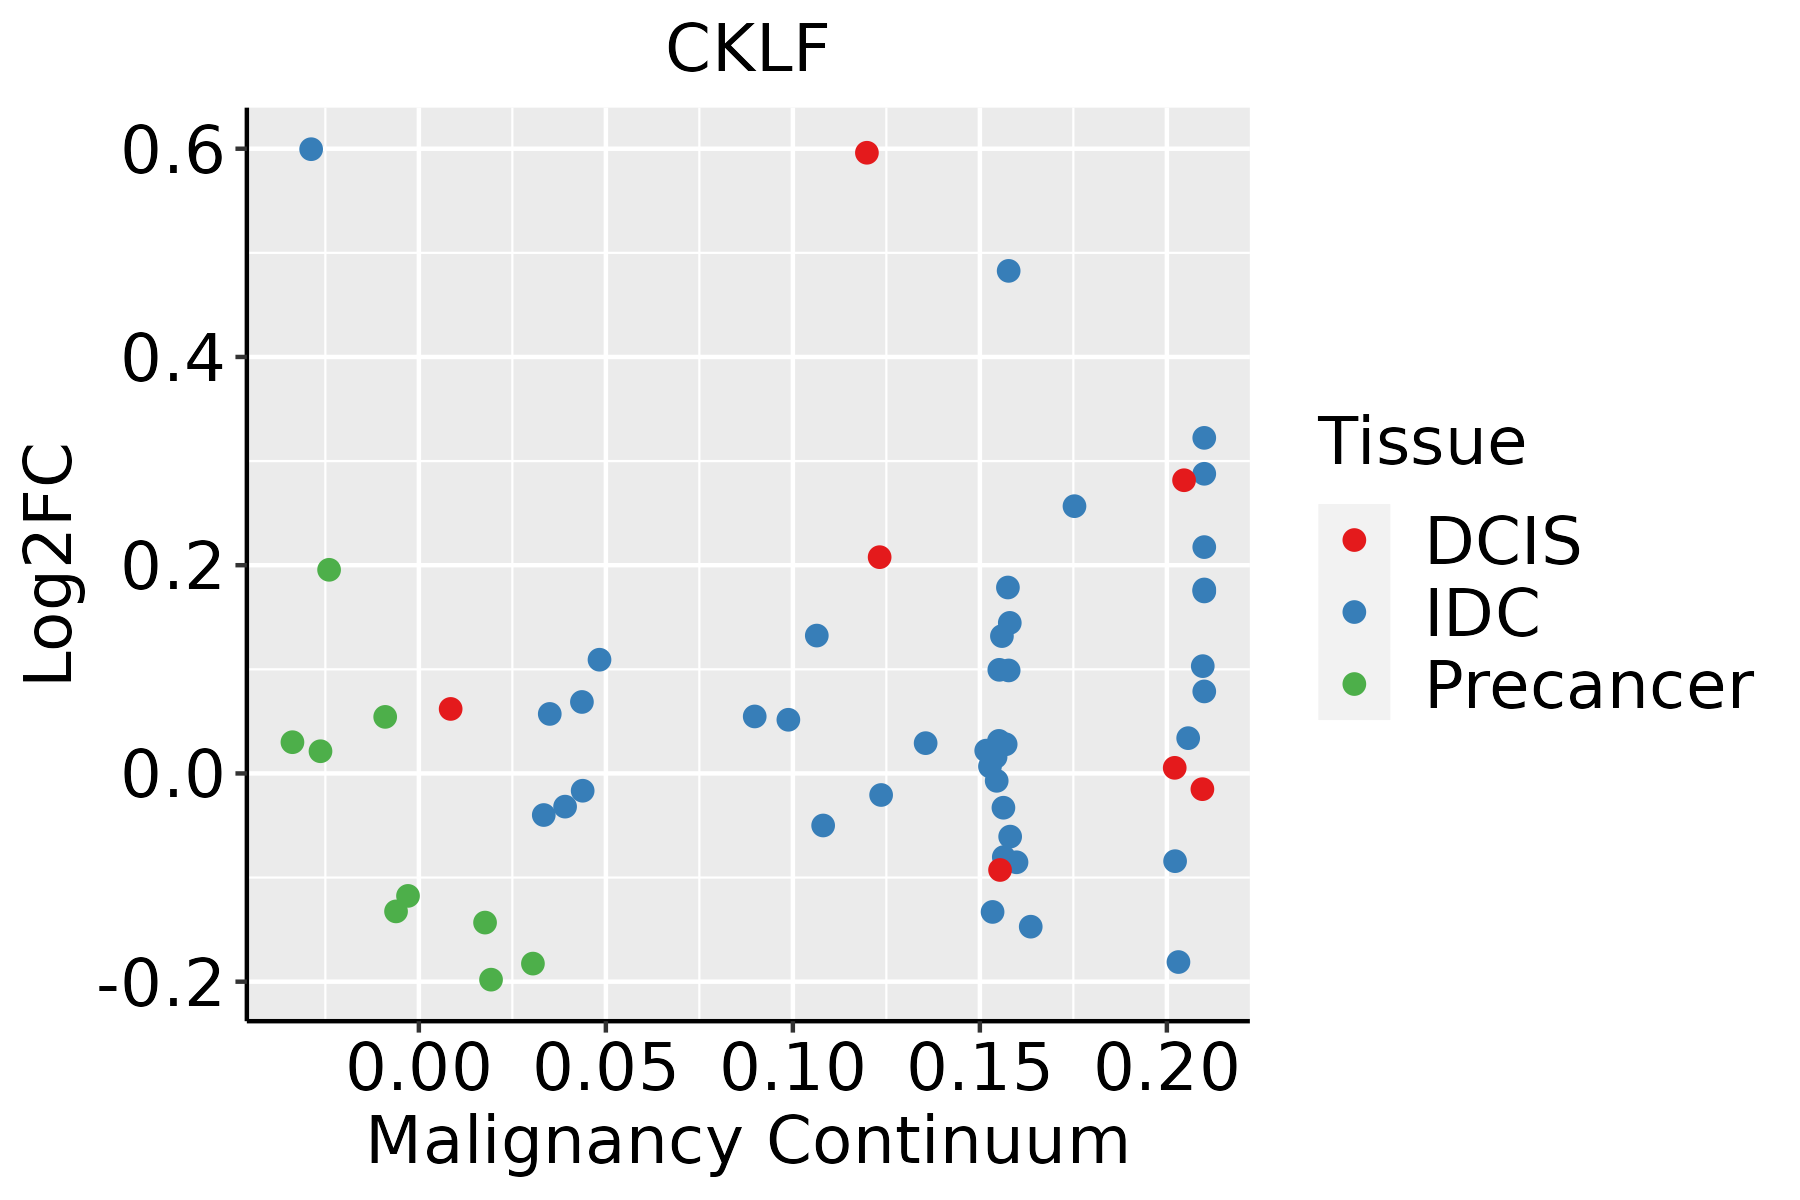 | IDC: Invasive ductal carcinoma |
| DCIS: Ductal carcinoma in situ | ||
| Precancer(BRCA1-mut): Precancerous lesion from BRCA1 mutation carriers | ||
| Cervix |  | CC: Cervix cancer |
| HSIL_HPV: HPV-infected high-grade squamous intraepithelial lesions | ||
| N_HPV: HPV-infected normal cervix | ||
| Esophagus |  | ESCC: Esophageal squamous cell carcinoma |
| HGIN: High-grade intraepithelial neoplasias | ||
| LGIN: Low-grade intraepithelial neoplasias | ||
| Liver |  | HCC: Hepatocellular carcinoma |
| NAFLD: Non-alcoholic fatty liver disease | ||
| Oral Cavity |  | EOLP: Erosive Oral lichen planus |
| LP: leukoplakia | ||
| NEOLP: Non-erosive oral lichen planus | ||
| OSCC: Oral squamous cell carcinoma | ||
| Skin |  | AK: Actinic keratosis |
| cSCC: Cutaneous squamous cell carcinoma | ||
| SCCIS:squamous cell carcinoma in situ | ||
| Thyroid |  | ATC: Anaplastic thyroid cancer |
| HT: Hashimoto's thyroiditis | ||
| PTC: Papillary thyroid cancer |
| ∗log2FC in expression of this searched gene in stem-like cells from each diseased tissue sample relative to stem-like cells in normal samples in each tissue plotted against the malignancy continuum. Samples are colored based on if they are from different disease stage. |
Top |
Malignant transformation related pathway analysis |
| Find out the enriched GO biological processes and KEGG pathways involved in transition from healthy to precancer to cancer |
| Tissue | Disease Stage | Enriched GO biological Processes |
| Colorectum | AD |  |
| Colorectum | SER |  |
| Colorectum | MSS |  |
| Colorectum | MSI-H |  |
| Colorectum | FAP |  |
| ∗Top 15 enriched GO BP terms are showed in the bar plot of each disease state in each tissue. Each row represents a significant GO biological process which is colored according to the -log10(p.adjust). |
| Page: 1 2 3 4 5 6 7 8 9 |
| GO ID | Tissue | Disease Stage | Description | Gene Ratio | Bg Ratio | pvalue | p.adjust | Count |
| GO:00975297 | Breast | Precancer | myeloid leukocyte migration | 34/1080 | 220/18723 | 1.42e-07 | 7.82e-06 | 34 |
| GO:00509006 | Breast | Precancer | leukocyte migration | 47/1080 | 369/18723 | 2.82e-07 | 1.39e-05 | 47 |
| GO:00305956 | Breast | Precancer | leukocyte chemotaxis | 34/1080 | 230/18723 | 4.16e-07 | 1.89e-05 | 34 |
| GO:00603266 | Breast | Precancer | cell chemotaxis | 41/1080 | 310/18723 | 5.99e-07 | 2.55e-05 | 41 |
| GO:00716217 | Breast | Precancer | granulocyte chemotaxis | 23/1080 | 125/18723 | 6.73e-07 | 2.77e-05 | 23 |
| GO:00975307 | Breast | Precancer | granulocyte migration | 24/1080 | 148/18723 | 4.04e-06 | 1.26e-04 | 24 |
| GO:00305937 | Breast | Precancer | neutrophil chemotaxis | 19/1080 | 103/18723 | 5.94e-06 | 1.71e-04 | 19 |
| GO:19902665 | Breast | Precancer | neutrophil migration | 20/1080 | 122/18723 | 2.13e-05 | 4.99e-04 | 20 |
| GO:00482463 | Breast | Precancer | macrophage chemotaxis | 9/1080 | 38/18723 | 2.44e-04 | 3.66e-03 | 9 |
| GO:19055173 | Breast | Precancer | macrophage migration | 11/1080 | 55/18723 | 2.57e-04 | 3.83e-03 | 11 |
| GO:00716744 | Breast | Precancer | mononuclear cell migration | 24/1080 | 196/18723 | 4.03e-04 | 5.44e-03 | 24 |
| GO:007162111 | Breast | IDC | granulocyte chemotaxis | 26/1434 | 125/18723 | 2.36e-06 | 9.30e-05 | 26 |
| GO:005090011 | Breast | IDC | leukocyte migration | 54/1434 | 369/18723 | 3.10e-06 | 1.15e-04 | 54 |
| GO:009752911 | Breast | IDC | myeloid leukocyte migration | 37/1434 | 220/18723 | 4.65e-06 | 1.62e-04 | 37 |
| GO:003059511 | Breast | IDC | leukocyte chemotaxis | 38/1434 | 230/18723 | 5.36e-06 | 1.76e-04 | 38 |
| GO:003059311 | Breast | IDC | neutrophil chemotaxis | 22/1434 | 103/18723 | 8.82e-06 | 2.50e-04 | 22 |
| GO:006032611 | Breast | IDC | cell chemotaxis | 46/1434 | 310/18723 | 1.13e-05 | 3.08e-04 | 46 |
| GO:009753011 | Breast | IDC | granulocyte migration | 27/1434 | 148/18723 | 1.98e-05 | 4.88e-04 | 27 |
| GO:199026611 | Breast | IDC | neutrophil migration | 23/1434 | 122/18723 | 4.67e-05 | 1.04e-03 | 23 |
| GO:007167411 | Breast | IDC | mononuclear cell migration | 29/1434 | 196/18723 | 4.68e-04 | 6.26e-03 | 29 |
| Page: 1 2 3 4 |
| Pathway ID | Tissue | Disease Stage | Description | Gene Ratio | Bg Ratio | pvalue | p.adjust | qvalue | Count |
| Page: 1 |
Top |
Cell-cell communication analysis |
| Identification of potential cell-cell interactions between two cell types and their ligand-receptor pairs for different disease states |
| Ligand | Receptor | LRpair | Pathway | Tissue | Disease Stage |
| Page: 1 |
Top |
Single-cell gene regulatory network inference analysis |
| Find out the significant the regulons (TFs) and the target genes of each regulon across cell types for different disease states |
| TF | Cell Type | Tissue | Disease Stage | Target Gene | RSS | Regulon Activity |
| ∗The dot plots of a searched regulon are shown for all cell subpopulations in each disease state of each tissue based on the regulon specific score inferred using pySCENIC and by calculating the average expression. |
| Page: 1 |
Top |
Somatic mutation of malignant transformation related genes |
| Annotation of somatic variants for genes involved in malignant transformation |
| Hugo Symbol | Variant Class | Variant Classification | dbSNP RS | HGVSc | HGVSp | HGVSp Short | SWISSPROT | BIOTYPE | SIFT | PolyPhen | Tumor Sample Barcode | Tissue | Histology | Sex | Age | Stage | Therapy Types | Drugs | Outcome |
| CKLF | SNV | Missense_Mutation | novel | c.430C>T | p.Pro144Ser | p.P144S | Q9UBR5 | protein_coding | tolerated_low_confidence(1) | benign(0) | TCGA-AN-A046-01 | Breast | breast invasive carcinoma | Female | >=65 | I/II | Unknown | Unknown | SD |
| CKLF | SNV | Missense_Mutation | c.156N>T | p.Glu52Asp | p.E52D | Q9UBR5 | protein_coding | deleterious(0.01) | probably_damaging(0.994) | TCGA-D8-A147-01 | Breast | breast invasive carcinoma | Female | <65 | I/II | Chemotherapy | doxorubicine | SD | |
| CKLF | insertion | Frame_Shift_Ins | novel | c.192_193insTT | p.Leu65PhefsTer7 | p.L65Ffs*7 | Q9UBR5 | protein_coding | TCGA-A8-A0A4-01 | Breast | breast invasive carcinoma | Female | >=65 | I/II | Hormone Therapy | tamoxiphen | CR | ||
| CKLF | insertion | Nonsense_Mutation | novel | c.194_195insGAGGGTTTAGGTGAG | p.Arg66_Leu67insValTerValSerArg | p.R66_L67insV*VSR | Q9UBR5 | protein_coding | TCGA-A8-A0A4-01 | Breast | breast invasive carcinoma | Female | >=65 | I/II | Hormone Therapy | tamoxiphen | CR | ||
| CKLF | insertion | Nonsense_Mutation | novel | c.420_421insGCTGTGTTACACTGGTGACTCATATTATGCTGCTTT | p.Tyr140_Gln141insAlaValLeuHisTrpTerLeuIleLeuCysCysPhe | p.Y140_Q141insAVLHW*LILCCF | Q9UBR5 | protein_coding | TCGA-AN-A0AL-01 | Breast | breast invasive carcinoma | Female | <65 | III/IV | Unknown | Unknown | SD | ||
| CKLF | insertion | Frame_Shift_Ins | rs754415052 | c.439_440insA | p.Glu150ArgfsTer12 | p.E150Rfs*12 | Q9UBR5 | protein_coding | TCGA-DM-A1HB-01 | Colorectum | colon adenocarcinoma | Male | >=65 | III/IV | Unknown | Unknown | SD | ||
| CKLF | SNV | Missense_Mutation | c.313N>G | p.Thr105Ala | p.T105A | Q9UBR5 | protein_coding | tolerated(0.57) | benign(0.255) | TCGA-AP-A056-01 | Endometrium | uterine corpus endometrioid carcinoma | Female | <65 | I/II | Unknown | Unknown | SD | |
| CKLF | SNV | Missense_Mutation | c.273N>A | p.Met91Ile | p.M91I | Q9UBR5 | protein_coding | deleterious(0.03) | benign(0.059) | TCGA-AP-A059-01 | Endometrium | uterine corpus endometrioid carcinoma | Female | >=65 | I/II | Unknown | Unknown | SD | |
| CKLF | SNV | Missense_Mutation | novel | c.121N>T | p.Ala41Ser | p.A41S | Q9UBR5 | protein_coding | deleterious(0.01) | probably_damaging(0.998) | TCGA-AP-A0LM-01 | Endometrium | uterine corpus endometrioid carcinoma | Female | <65 | III/IV | Chemotherapy | cisplatin | SD |
| CKLF | SNV | Missense_Mutation | rs372959958 | c.32N>A | p.Arg11His | p.R11H | Q9UBR5 | protein_coding | deleterious(0.03) | probably_damaging(0.929) | TCGA-BG-A222-01 | Endometrium | uterine corpus endometrioid carcinoma | Female | <65 | I/II | Unknown | Unknown | SD |
| Page: 1 2 |
Top |
Related drugs of malignant transformation related genes |
| Identification of chemicals and drugs interact with genes involved in malignant transfromation |
| (DGIdb 4.0) |
| Entrez ID | Symbol | Category | Interaction Types | Drug Claim Name | Drug Name | PMIDs |
| Page: 1 |

Copyright 2023-Present -The University of Texas Health Science Center at Houston |