
|
|||||
|
 | |
| |
| |
| |
| |
| |
|
Gene: CKB |
Gene summary for CKB |
| Gene information | Species | Human | Gene symbol | CKB | Gene ID | 1152 |
| Gene name | creatine kinase B | |
| Gene Alias | B-CK | |
| Cytomap | 14q32.33 | |
| Gene Type | protein-coding | GO ID | GO:0006575 | UniProtAcc | P12277 |
Top |
Malignant transformation analysis |
| Identification of the aberrant gene expression in precancerous and cancerous lesions by comparing the gene expression of stem-like cells in diseased tissues with normal stem cells |
| Entrez ID | Symbol | Replicates | Species | Organ | Tissue | Adj P-value | Log2FC | Malignancy |
| 1152 | CKB | GSM4909281 | Human | Breast | IDC | 3.49e-07 | 3.67e-01 | 0.21 |
| 1152 | CKB | GSM4909285 | Human | Breast | IDC | 7.01e-03 | 2.36e-01 | 0.21 |
| 1152 | CKB | GSM4909286 | Human | Breast | IDC | 3.61e-29 | 6.53e-01 | 0.1081 |
| 1152 | CKB | GSM4909296 | Human | Breast | IDC | 1.28e-05 | -1.73e-01 | 0.1524 |
| 1152 | CKB | GSM4909297 | Human | Breast | IDC | 2.26e-06 | 2.16e-01 | 0.1517 |
| 1152 | CKB | GSM4909298 | Human | Breast | IDC | 3.05e-03 | -1.81e-01 | 0.1551 |
| 1152 | CKB | GSM4909302 | Human | Breast | IDC | 2.61e-06 | -1.51e-01 | 0.1545 |
| 1152 | CKB | GSM4909307 | Human | Breast | IDC | 6.41e-04 | -1.83e-01 | 0.1569 |
| 1152 | CKB | GSM4909308 | Human | Breast | IDC | 2.57e-02 | -1.84e-01 | 0.158 |
| 1152 | CKB | GSM4909311 | Human | Breast | IDC | 3.69e-10 | -2.11e-01 | 0.1534 |
| 1152 | CKB | GSM4909312 | Human | Breast | IDC | 5.73e-08 | -1.89e-01 | 0.1552 |
| 1152 | CKB | GSM4909315 | Human | Breast | IDC | 1.45e-32 | 8.83e-01 | 0.21 |
| 1152 | CKB | GSM4909316 | Human | Breast | IDC | 7.29e-22 | 1.08e+00 | 0.21 |
| 1152 | CKB | GSM4909317 | Human | Breast | IDC | 4.31e-13 | 5.51e-01 | 0.1355 |
| 1152 | CKB | GSM4909319 | Human | Breast | IDC | 7.42e-11 | -2.03e-01 | 0.1563 |
| 1152 | CKB | GSM4909321 | Human | Breast | IDC | 4.10e-03 | 5.03e-03 | 0.1559 |
| 1152 | CKB | P1 | Human | Breast | IDC | 1.72e-02 | -1.80e-01 | 0.1527 |
| 1152 | CKB | P2 | Human | Breast | IDC | 4.60e-17 | 7.86e-01 | 0.21 |
| 1152 | CKB | DCIS2 | Human | Breast | DCIS | 7.35e-12 | -9.63e-02 | 0.0085 |
| 1152 | CKB | CA_HPV_1 | Human | Cervix | CC | 1.93e-06 | -2.86e-01 | 0.0264 |
| Page: 1 2 3 4 5 6 7 8 9 10 11 12 |
| Tissue | Expression Dynamics | Abbreviation |
| Breast | 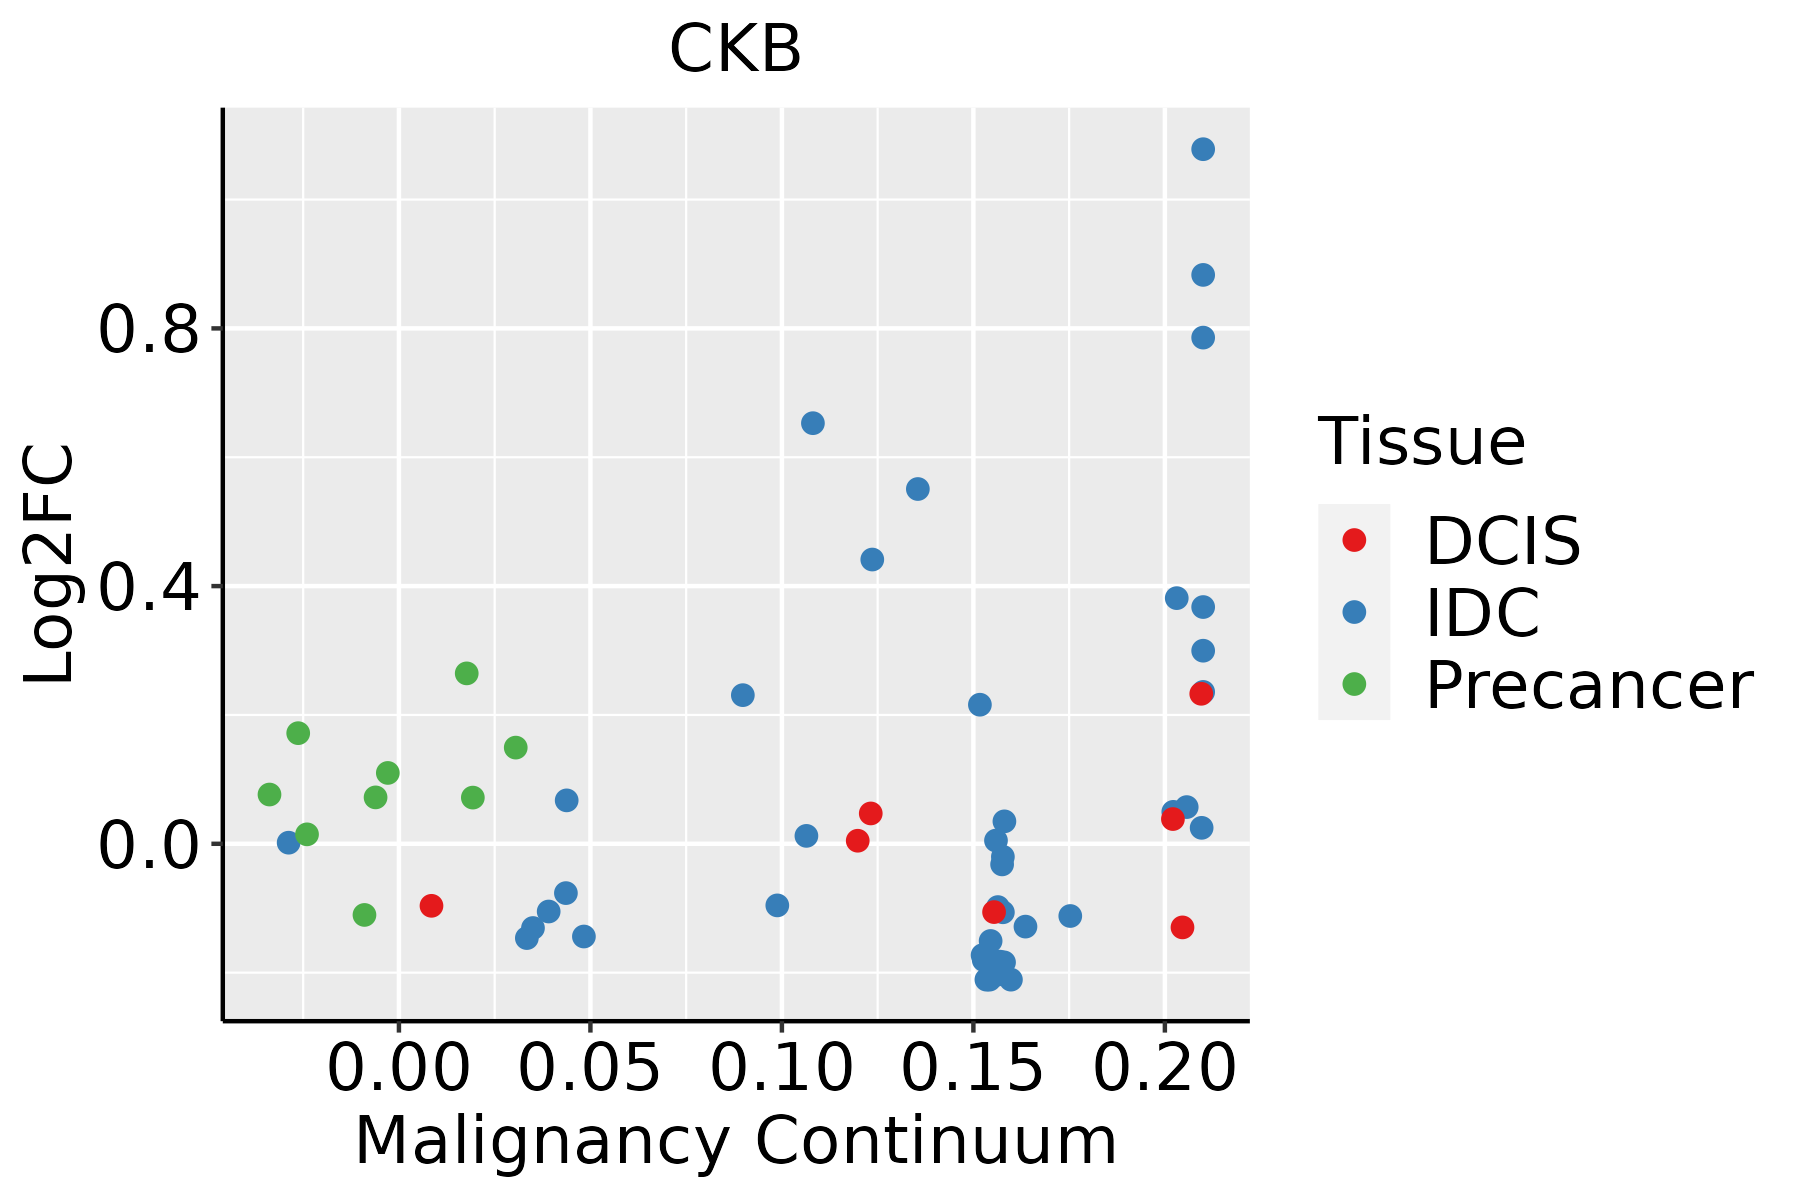 | IDC: Invasive ductal carcinoma |
| DCIS: Ductal carcinoma in situ | ||
| Precancer(BRCA1-mut): Precancerous lesion from BRCA1 mutation carriers | ||
| Cervix | 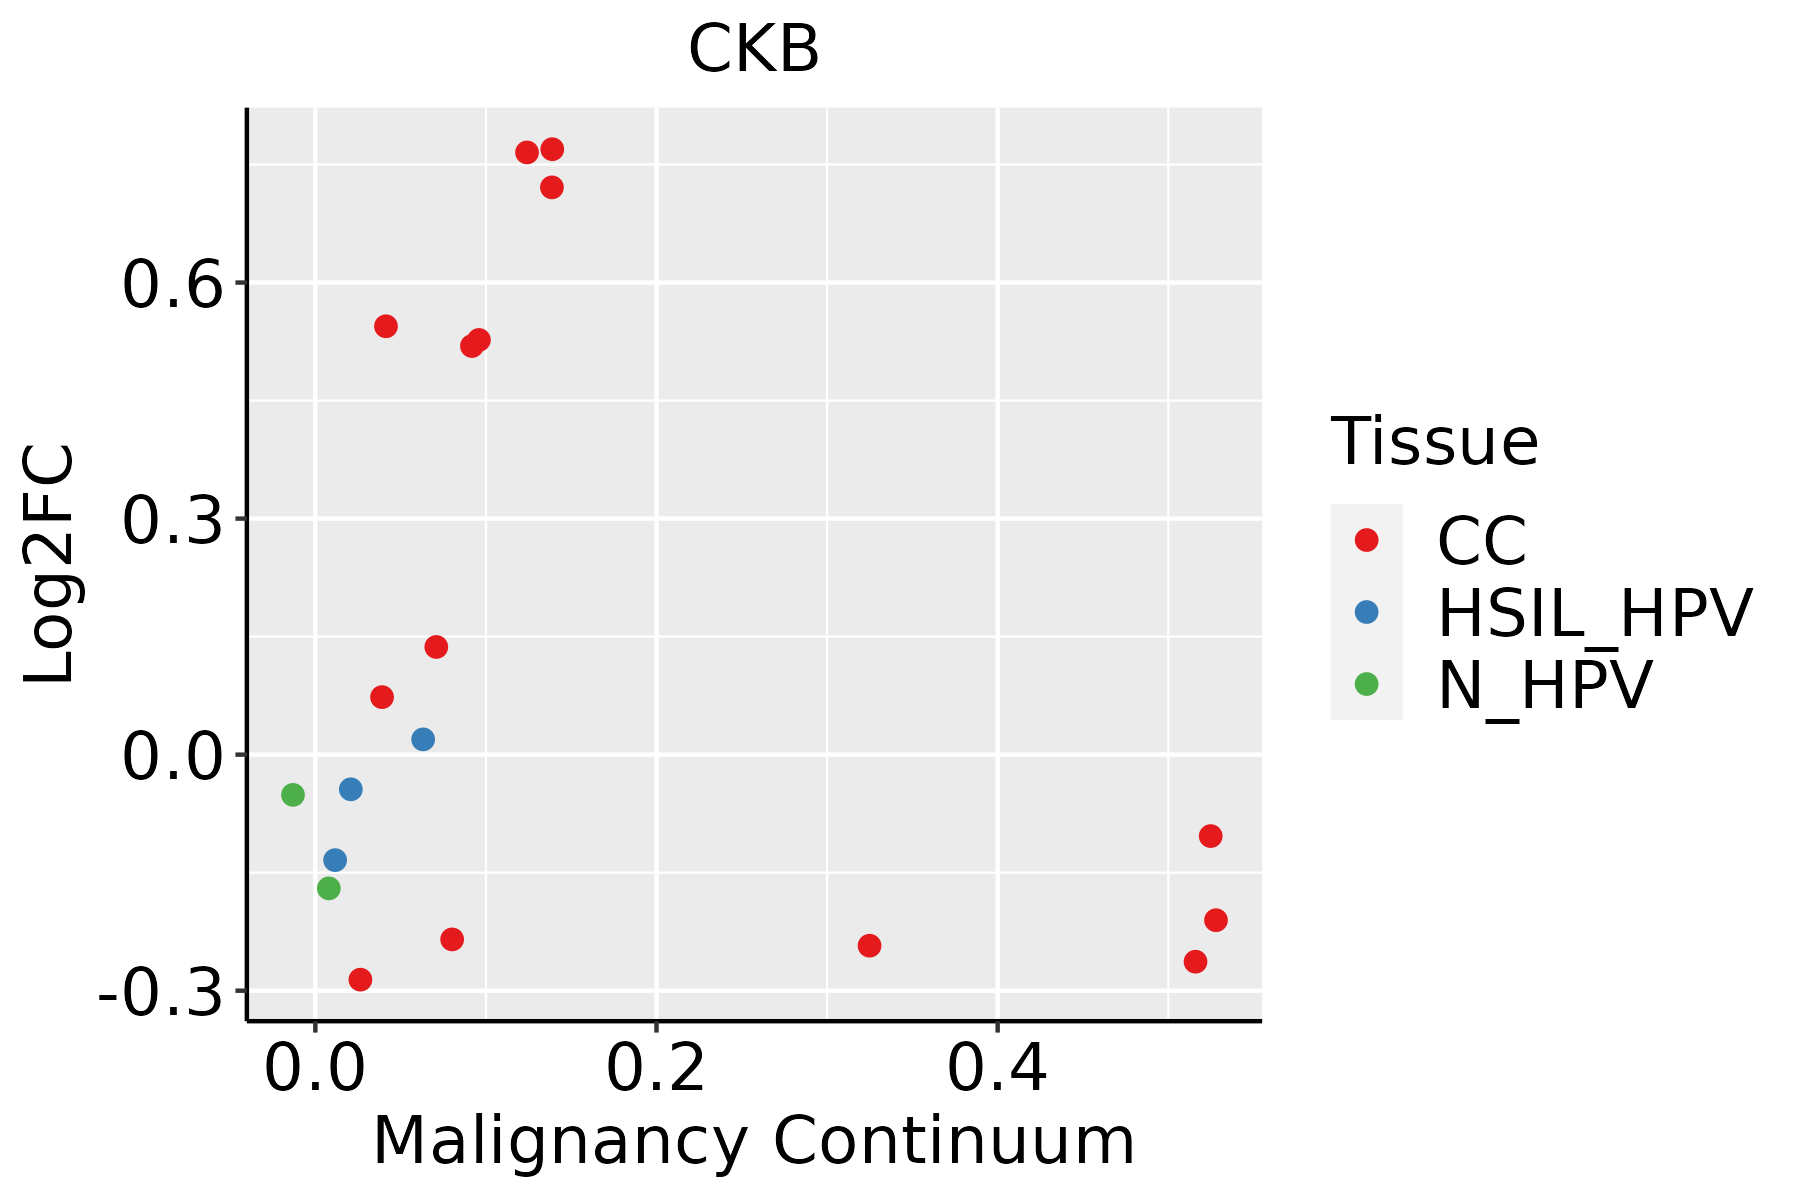 | CC: Cervix cancer |
| HSIL_HPV: HPV-infected high-grade squamous intraepithelial lesions | ||
| N_HPV: HPV-infected normal cervix | ||
| Colorectum (GSE201348) |  | FAP: Familial adenomatous polyposis |
| CRC: Colorectal cancer | ||
| Colorectum (HTA11) |  | AD: Adenomas |
| SER: Sessile serrated lesions | ||
| MSI-H: Microsatellite-high colorectal cancer | ||
| MSS: Microsatellite stable colorectal cancer | ||
| Endometrium |  | AEH: Atypical endometrial hyperplasia |
| EEC: Endometrioid Cancer | ||
| Esophagus | 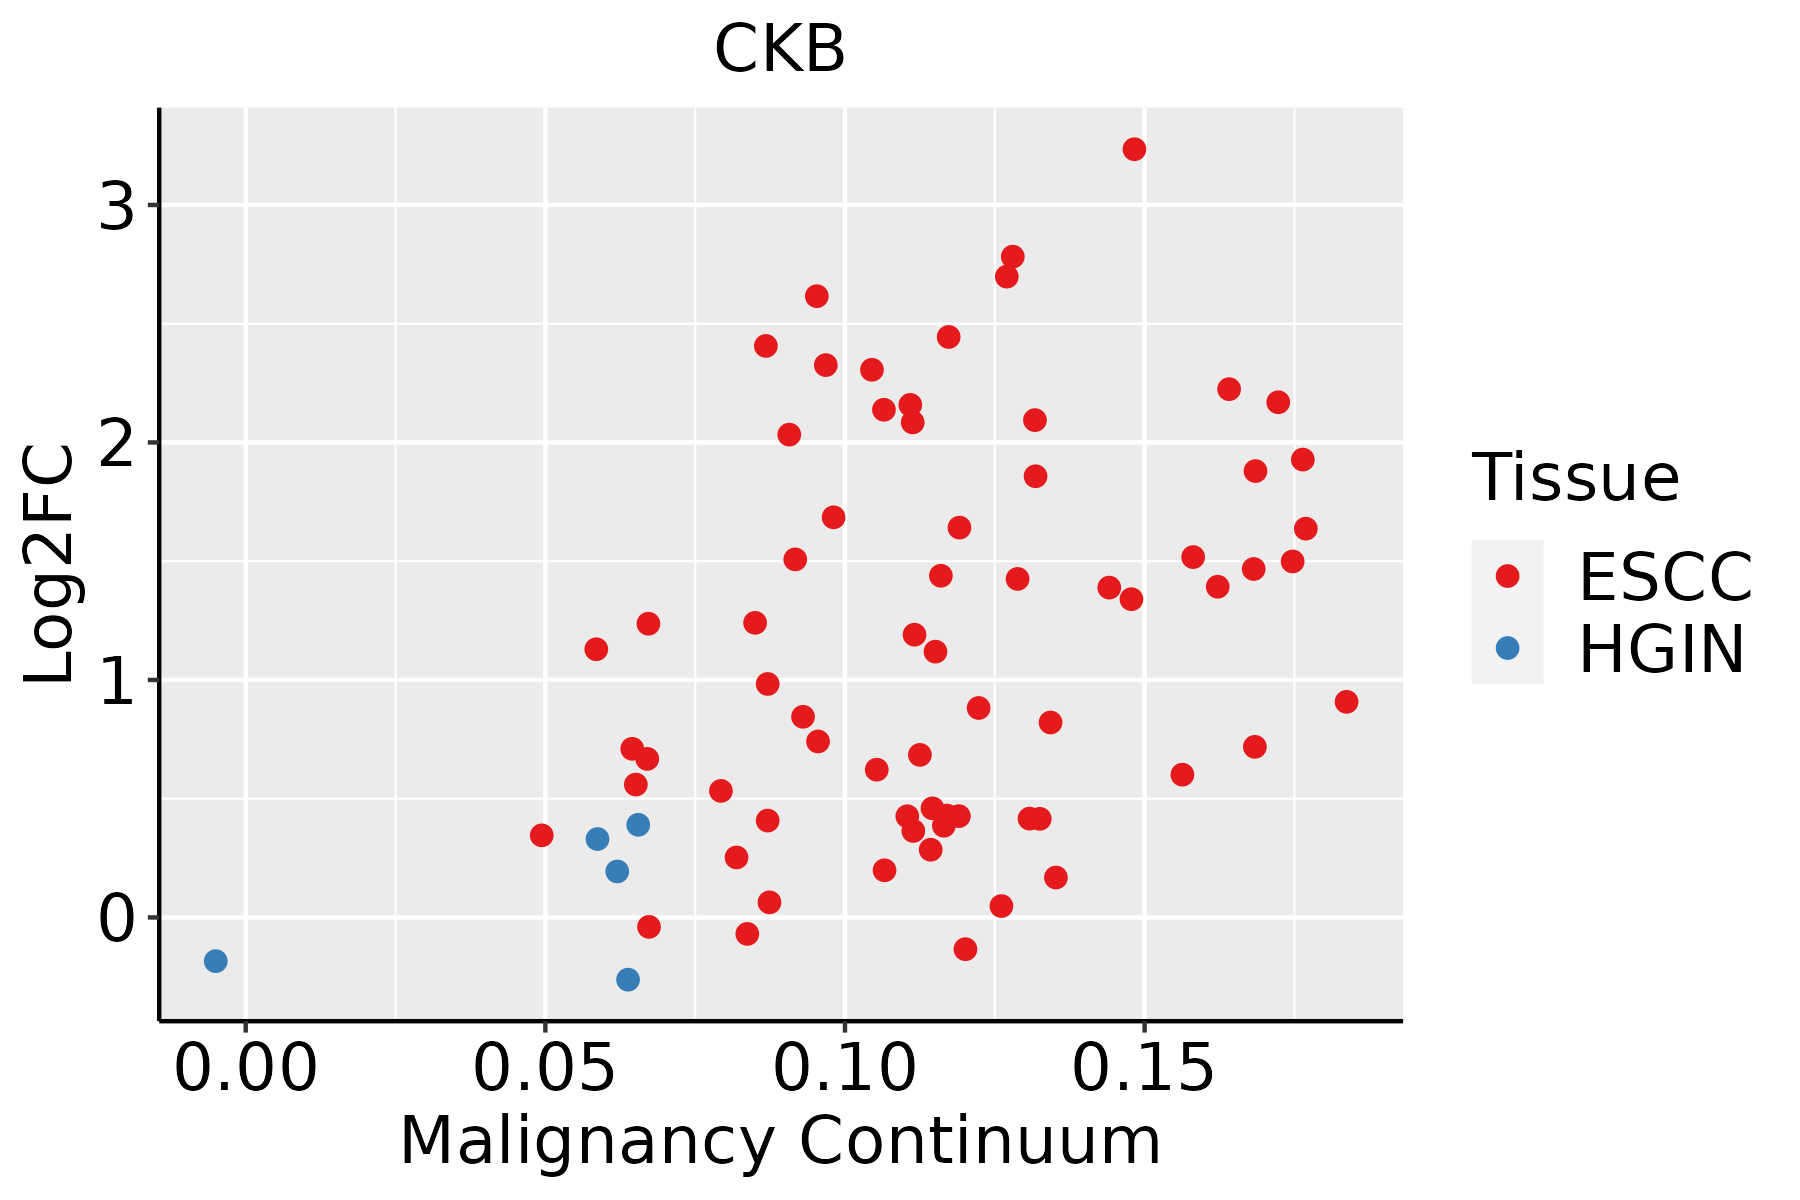 | ESCC: Esophageal squamous cell carcinoma |
| HGIN: High-grade intraepithelial neoplasias | ||
| LGIN: Low-grade intraepithelial neoplasias | ||
| Liver | 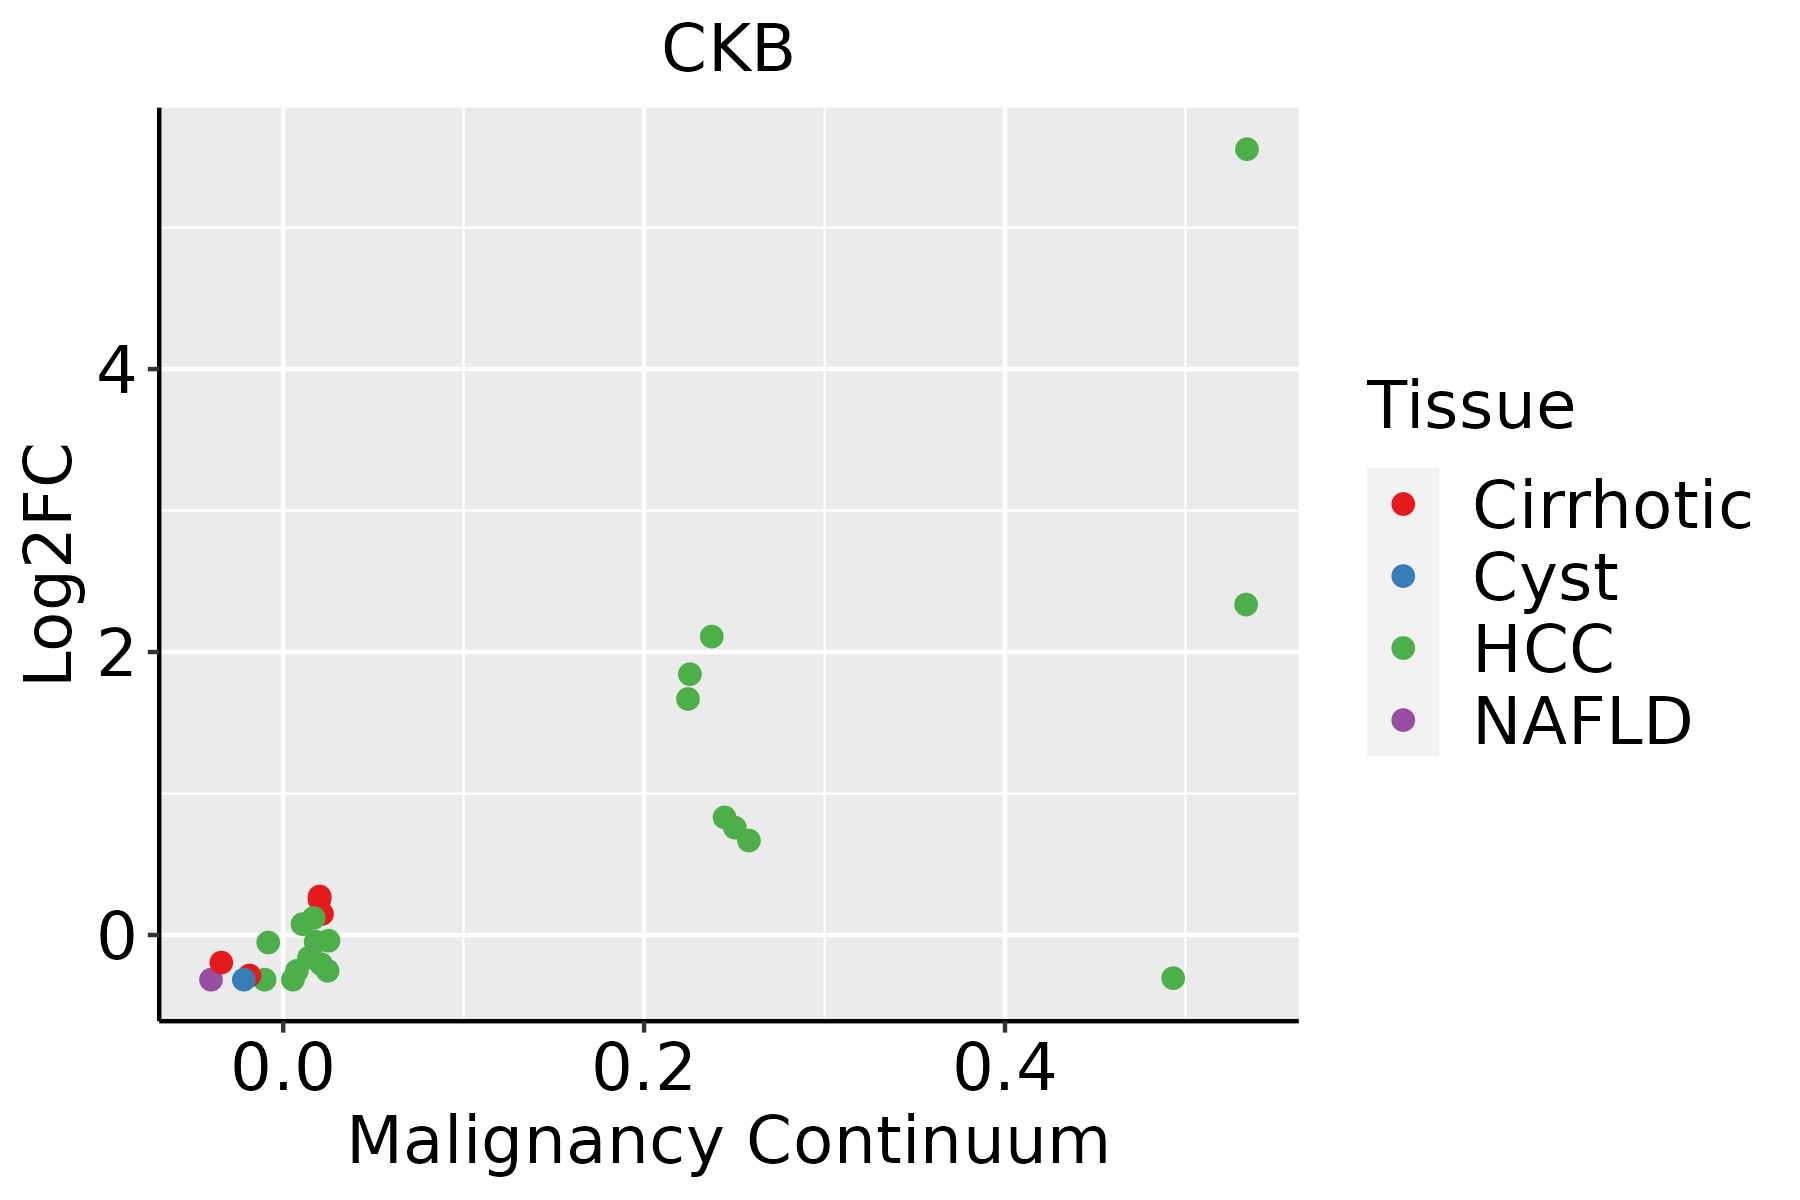 | HCC: Hepatocellular carcinoma |
| NAFLD: Non-alcoholic fatty liver disease | ||
| Oral Cavity | 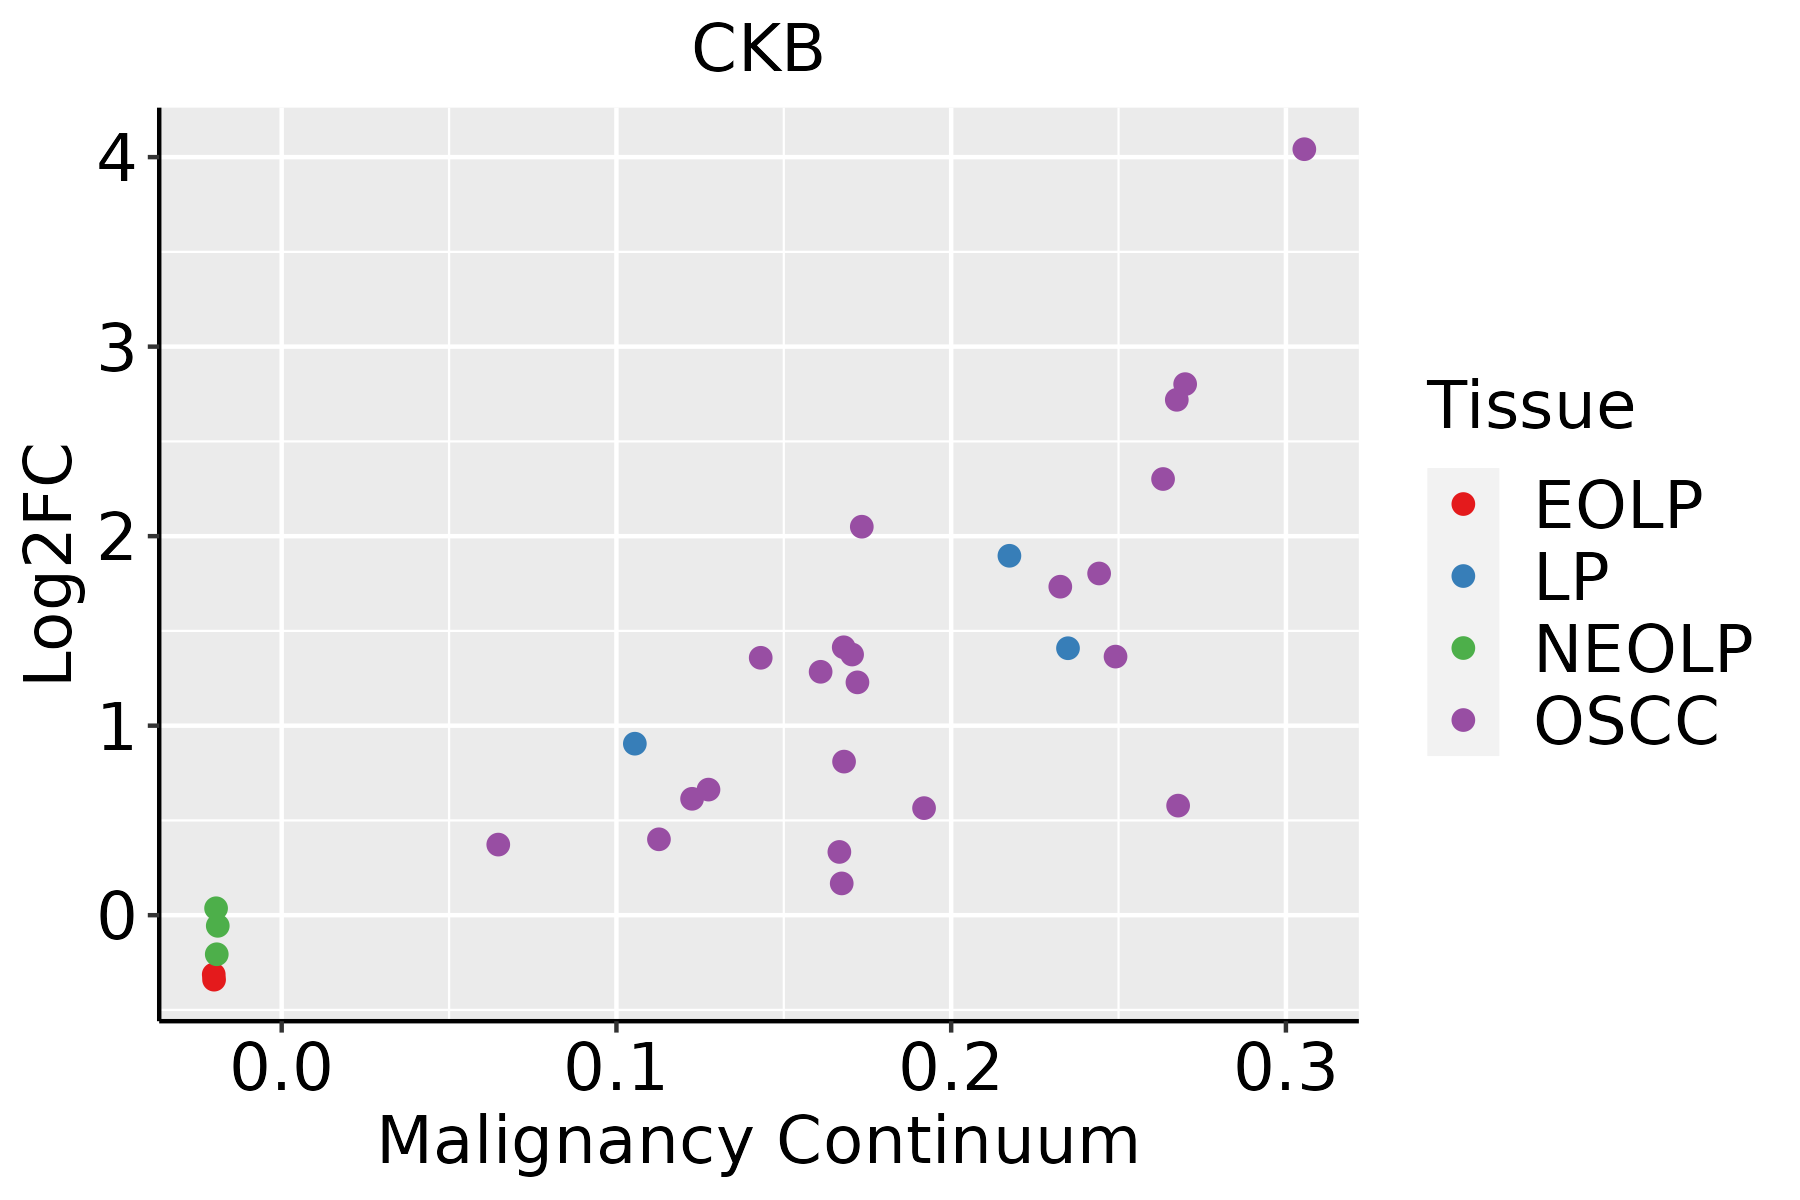 | EOLP: Erosive Oral lichen planus |
| LP: leukoplakia | ||
| NEOLP: Non-erosive oral lichen planus | ||
| OSCC: Oral squamous cell carcinoma | ||
| Prostate |  | BPH: Benign Prostatic Hyperplasia |
| Skin | 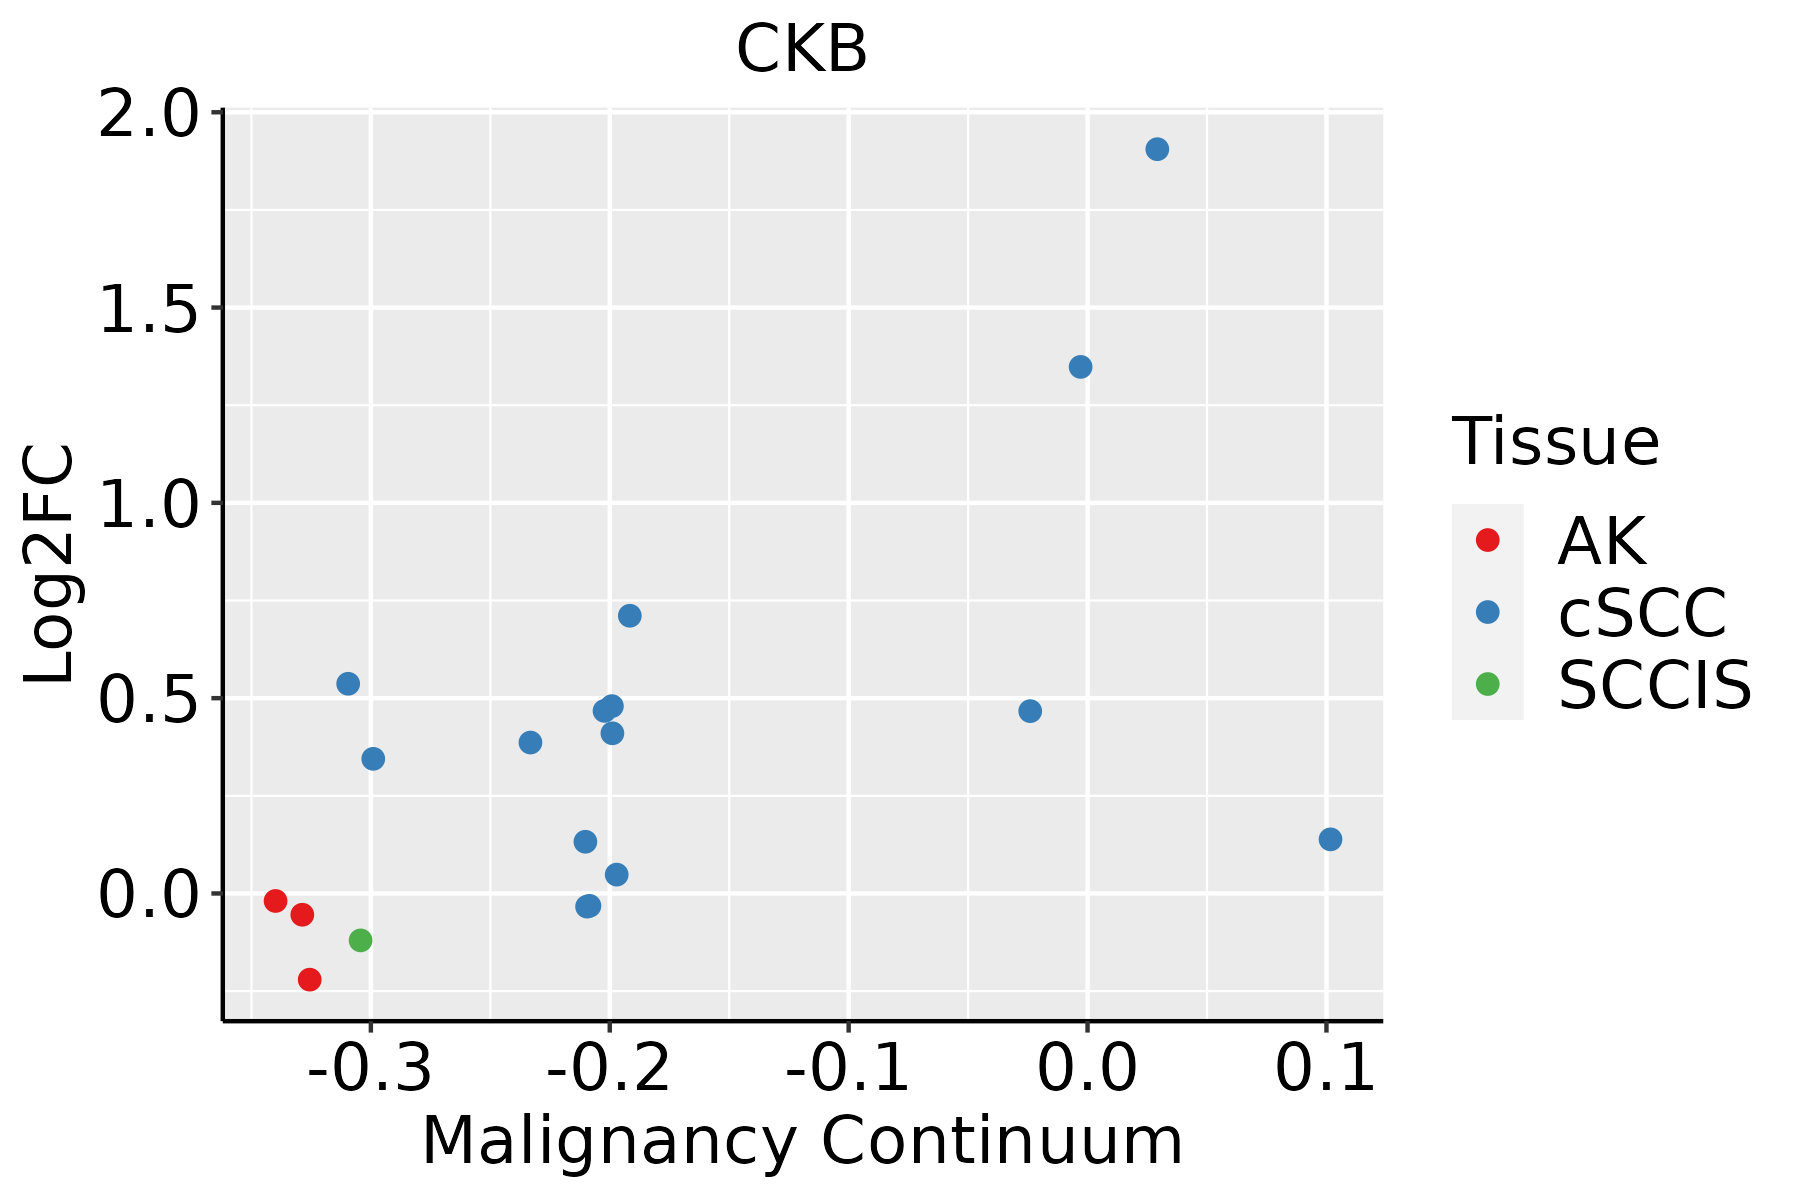 | AK: Actinic keratosis |
| cSCC: Cutaneous squamous cell carcinoma | ||
| SCCIS:squamous cell carcinoma in situ | ||
| Thyroid | 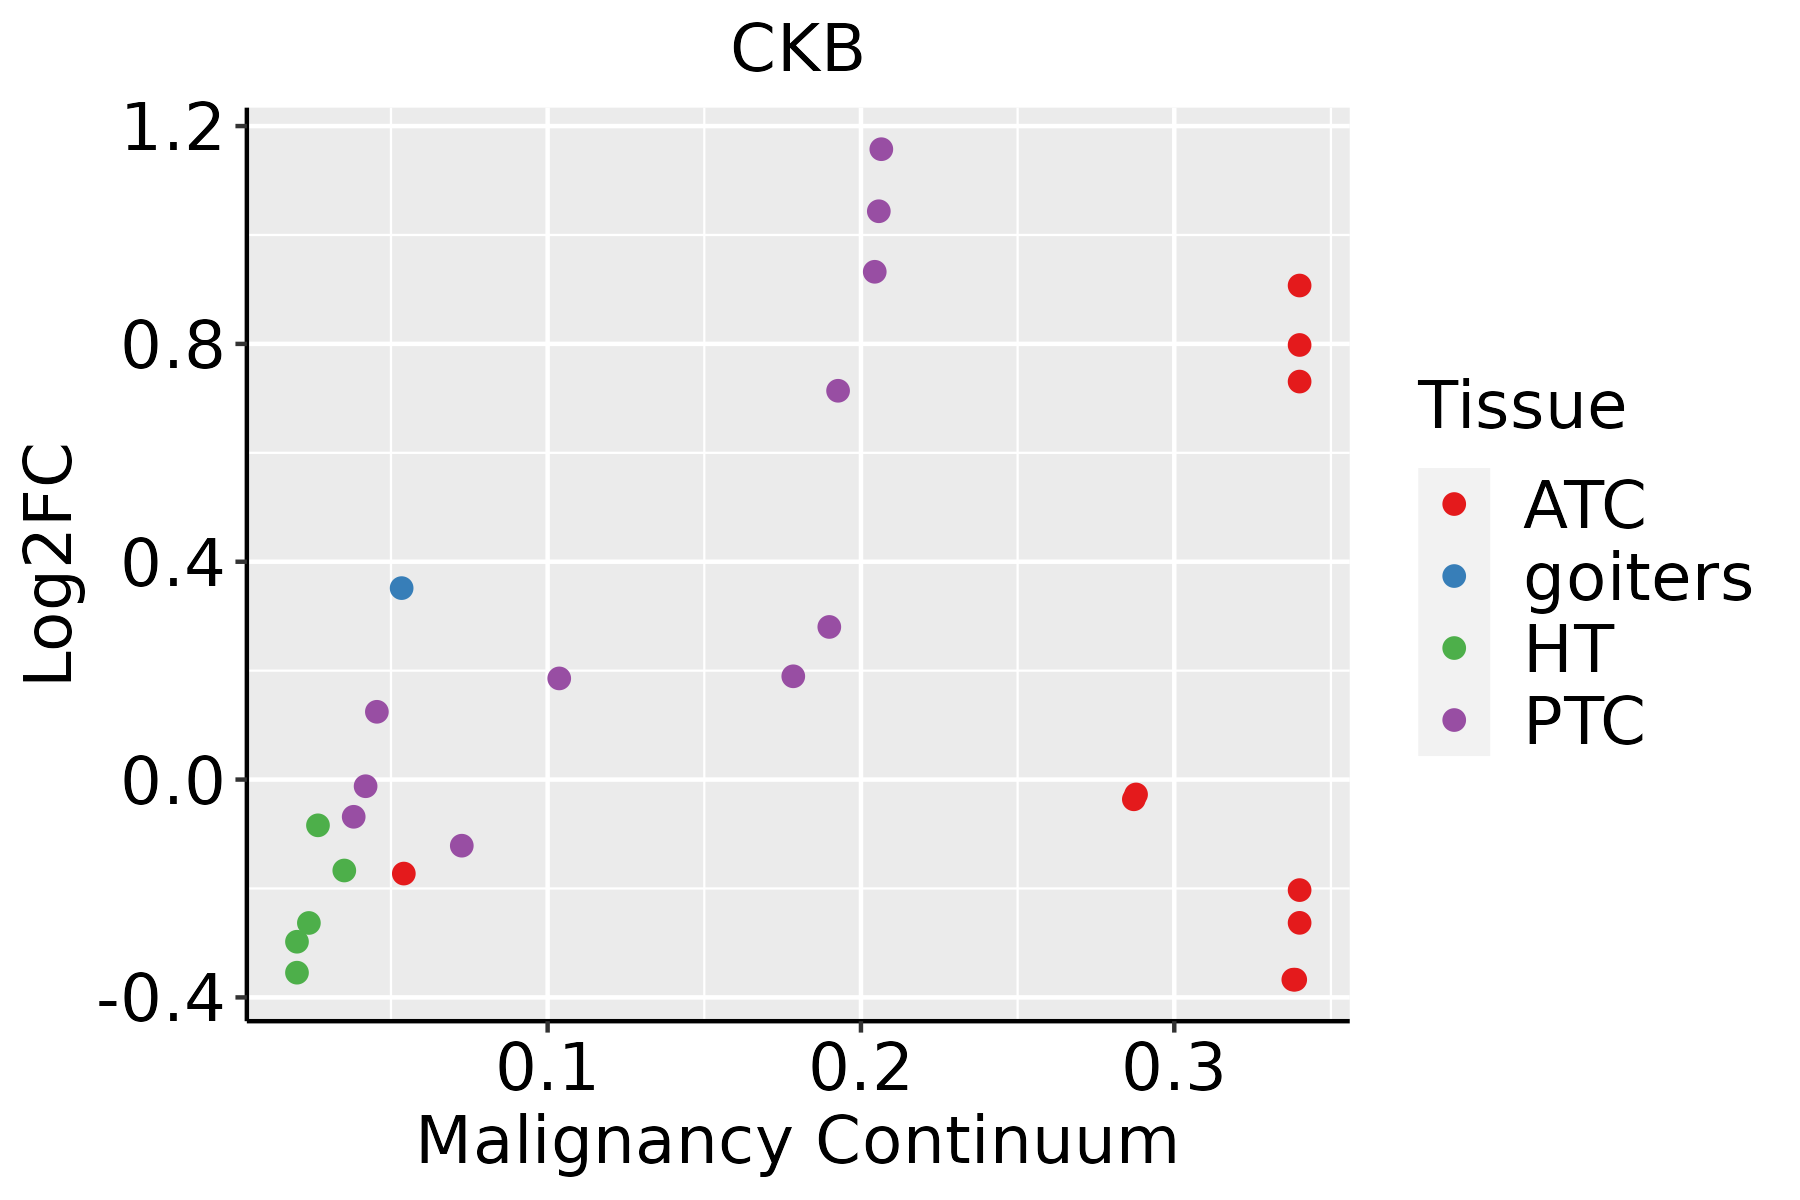 | ATC: Anaplastic thyroid cancer |
| HT: Hashimoto's thyroiditis | ||
| PTC: Papillary thyroid cancer |
| ∗log2FC in expression of this searched gene in stem-like cells from each diseased tissue sample relative to stem-like cells in normal samples in each tissue plotted against the malignancy continuum. Samples are colored based on if they are from different disease stage. |
Top |
Malignant transformation related pathway analysis |
| Find out the enriched GO biological processes and KEGG pathways involved in transition from healthy to precancer to cancer |
| Tissue | Disease Stage | Enriched GO biological Processes |
| Colorectum | AD |  |
| Colorectum | SER |  |
| Colorectum | MSS |  |
| Colorectum | MSI-H |  |
| Colorectum | FAP |  |
| ∗Top 15 enriched GO BP terms are showed in the bar plot of each disease state in each tissue. Each row represents a significant GO biological process which is colored according to the -log10(p.adjust). |
| Page: 1 2 3 4 5 6 7 8 9 |
| GO ID | Tissue | Disease Stage | Description | Gene Ratio | Bg Ratio | pvalue | p.adjust | Count |
| GO:002176214 | Breast | IDC | substantia nigra development | 18/1434 | 44/18723 | 1.11e-09 | 1.07e-07 | 18 |
| GO:004885713 | Breast | IDC | neural nucleus development | 21/1434 | 64/18723 | 5.35e-09 | 4.28e-07 | 21 |
| GO:003090112 | Breast | IDC | midbrain development | 24/1434 | 90/18723 | 4.35e-08 | 2.87e-06 | 24 |
| GO:002176223 | Breast | DCIS | substantia nigra development | 17/1390 | 44/18723 | 5.72e-09 | 4.76e-07 | 17 |
| GO:004885723 | Breast | DCIS | neural nucleus development | 20/1390 | 64/18723 | 1.87e-08 | 1.29e-06 | 20 |
| GO:003090122 | Breast | DCIS | midbrain development | 23/1390 | 90/18723 | 1.10e-07 | 5.93e-06 | 23 |
| GO:00309019 | Cervix | CC | midbrain development | 26/2311 | 90/18723 | 2.12e-05 | 3.82e-04 | 26 |
| GO:002176210 | Cervix | CC | substantia nigra development | 16/2311 | 44/18723 | 3.81e-05 | 5.99e-04 | 16 |
| GO:00488579 | Cervix | CC | neural nucleus development | 18/2311 | 64/18723 | 5.42e-04 | 5.23e-03 | 18 |
| GO:0021762 | Colorectum | AD | substantia nigra development | 21/3918 | 44/18723 | 6.60e-05 | 1.07e-03 | 21 |
| GO:0048857 | Colorectum | AD | neural nucleus development | 27/3918 | 64/18723 | 9.57e-05 | 1.45e-03 | 27 |
| GO:0006575 | Colorectum | AD | cellular modified amino acid metabolic process | 59/3918 | 188/18723 | 4.80e-04 | 5.27e-03 | 59 |
| GO:0030901 | Colorectum | AD | midbrain development | 32/3918 | 90/18723 | 9.45e-04 | 8.95e-03 | 32 |
| GO:0042398 | Colorectum | AD | cellular modified amino acid biosynthetic process | 18/3918 | 46/18723 | 3.67e-03 | 2.60e-02 | 18 |
| GO:00217621 | Colorectum | SER | substantia nigra development | 21/2897 | 44/18723 | 4.77e-07 | 2.40e-05 | 21 |
| GO:00488571 | Colorectum | SER | neural nucleus development | 26/2897 | 64/18723 | 1.09e-06 | 5.11e-05 | 26 |
| GO:00309011 | Colorectum | SER | midbrain development | 29/2897 | 90/18723 | 5.50e-05 | 1.30e-03 | 29 |
| GO:00217622 | Colorectum | MSS | substantia nigra development | 21/3467 | 44/18723 | 9.54e-06 | 2.33e-04 | 21 |
| GO:00488572 | Colorectum | MSS | neural nucleus development | 26/3467 | 64/18723 | 3.19e-05 | 6.30e-04 | 26 |
| GO:00423981 | Colorectum | MSS | cellular modified amino acid biosynthetic process | 20/3467 | 46/18723 | 8.26e-05 | 1.35e-03 | 20 |
| Page: 1 2 3 4 5 |
| Pathway ID | Tissue | Disease Stage | Description | Gene Ratio | Bg Ratio | pvalue | p.adjust | qvalue | Count |
| hsa00330 | Colorectum | AD | Arginine and proline metabolism | 23/2092 | 50/8465 | 8.27e-04 | 5.90e-03 | 3.76e-03 | 23 |
| hsa003301 | Colorectum | AD | Arginine and proline metabolism | 23/2092 | 50/8465 | 8.27e-04 | 5.90e-03 | 3.76e-03 | 23 |
| hsa003302 | Colorectum | SER | Arginine and proline metabolism | 17/1580 | 50/8465 | 7.12e-03 | 3.77e-02 | 2.74e-02 | 17 |
| hsa003303 | Colorectum | SER | Arginine and proline metabolism | 17/1580 | 50/8465 | 7.12e-03 | 3.77e-02 | 2.74e-02 | 17 |
| hsa003304 | Colorectum | MSS | Arginine and proline metabolism | 23/1875 | 50/8465 | 1.52e-04 | 1.24e-03 | 7.61e-04 | 23 |
| hsa003305 | Colorectum | MSS | Arginine and proline metabolism | 23/1875 | 50/8465 | 1.52e-04 | 1.24e-03 | 7.61e-04 | 23 |
| hsa003306 | Colorectum | FAP | Arginine and proline metabolism | 16/1404 | 50/8465 | 5.33e-03 | 2.10e-02 | 1.27e-02 | 16 |
| hsa003307 | Colorectum | FAP | Arginine and proline metabolism | 16/1404 | 50/8465 | 5.33e-03 | 2.10e-02 | 1.27e-02 | 16 |
| hsa003308 | Liver | Cirrhotic | Arginine and proline metabolism | 25/2530 | 50/8465 | 2.18e-03 | 9.41e-03 | 5.80e-03 | 25 |
| hsa0033011 | Liver | Cirrhotic | Arginine and proline metabolism | 25/2530 | 50/8465 | 2.18e-03 | 9.41e-03 | 5.80e-03 | 25 |
| hsa0033021 | Liver | HCC | Arginine and proline metabolism | 33/4020 | 50/8465 | 6.28e-03 | 1.77e-02 | 9.83e-03 | 33 |
| hsa0033031 | Liver | HCC | Arginine and proline metabolism | 33/4020 | 50/8465 | 6.28e-03 | 1.77e-02 | 9.83e-03 | 33 |
| hsa0033010 | Oral cavity | OSCC | Arginine and proline metabolism | 30/3704 | 50/8465 | 1.50e-02 | 3.26e-02 | 1.66e-02 | 30 |
| hsa0033013 | Oral cavity | OSCC | Arginine and proline metabolism | 30/3704 | 50/8465 | 1.50e-02 | 3.26e-02 | 1.66e-02 | 30 |
| hsa0033023 | Oral cavity | LP | Arginine and proline metabolism | 26/2418 | 50/8465 | 3.94e-04 | 2.08e-03 | 1.34e-03 | 26 |
| hsa0033033 | Oral cavity | LP | Arginine and proline metabolism | 26/2418 | 50/8465 | 3.94e-04 | 2.08e-03 | 1.34e-03 | 26 |
| hsa0033022 | Prostate | Tumor | Arginine and proline metabolism | 19/1791 | 50/8465 | 4.73e-03 | 1.67e-02 | 1.03e-02 | 19 |
| hsa0033032 | Prostate | Tumor | Arginine and proline metabolism | 19/1791 | 50/8465 | 4.73e-03 | 1.67e-02 | 1.03e-02 | 19 |
| Page: 1 |
Top |
Cell-cell communication analysis |
| Identification of potential cell-cell interactions between two cell types and their ligand-receptor pairs for different disease states |
| Ligand | Receptor | LRpair | Pathway | Tissue | Disease Stage |
| Page: 1 |
Top |
Single-cell gene regulatory network inference analysis |
| Find out the significant the regulons (TFs) and the target genes of each regulon across cell types for different disease states |
| TF | Cell Type | Tissue | Disease Stage | Target Gene | RSS | Regulon Activity |
| ∗The dot plots of a searched regulon are shown for all cell subpopulations in each disease state of each tissue based on the regulon specific score inferred using pySCENIC and by calculating the average expression. |
| Page: 1 |
Top |
Somatic mutation of malignant transformation related genes |
| Annotation of somatic variants for genes involved in malignant transformation |
| Hugo Symbol | Variant Class | Variant Classification | dbSNP RS | HGVSc | HGVSp | HGVSp Short | SWISSPROT | BIOTYPE | SIFT | PolyPhen | Tumor Sample Barcode | Tissue | Histology | Sex | Age | Stage | Therapy Types | Drugs | Outcome |
| CKB | SNV | Missense_Mutation | c.940N>T | p.Arg314Trp | p.R314W | P12277 | protein_coding | deleterious(0) | probably_damaging(0.959) | TCGA-E9-A1RF-01 | Breast | breast invasive carcinoma | Female | >=65 | III/IV | Hormone Therapy | tamoxiphen | SD | |
| CKB | insertion | Frame_Shift_Ins | novel | c.1122_1123insATGGGAGAGAGCGAGGGAG | p.Asp375MetfsTer48 | p.D375Mfs*48 | P12277 | protein_coding | TCGA-AO-A0JB-01 | Breast | breast invasive carcinoma | Female | <65 | III/IV | Chemotherapy | cyclophosphamide | SD | ||
| CKB | insertion | Frame_Shift_Ins | novel | c.1120_1121insGGCTGTGCAGGCAGGA | p.Asp374GlyfsTer48 | p.D374Gfs*48 | P12277 | protein_coding | TCGA-AO-A0JB-01 | Breast | breast invasive carcinoma | Female | <65 | III/IV | Chemotherapy | cyclophosphamide | SD | ||
| CKB | SNV | Missense_Mutation | novel | c.1003N>A | p.Asp335Asn | p.D335N | P12277 | protein_coding | deleterious(0) | probably_damaging(0.997) | TCGA-AA-A010-01 | Colorectum | colon adenocarcinoma | Female | <65 | I/II | Chemotherapy | folinic | CR |
| CKB | SNV | Missense_Mutation | c.130G>A | p.Ala44Thr | p.A44T | P12277 | protein_coding | deleterious(0.03) | benign(0) | TCGA-QG-A5Z2-01 | Colorectum | colon adenocarcinoma | Male | <65 | I/II | Unknown | Unknown | SD | |
| CKB | SNV | Missense_Mutation | c.908N>A | p.Gly303Asp | p.G303D | P12277 | protein_coding | tolerated(0.06) | benign(0.027) | TCGA-WS-AB45-01 | Colorectum | colon adenocarcinoma | Female | <65 | I/II | Unknown | Unknown | SD | |
| CKB | SNV | Missense_Mutation | c.143C>G | p.Pro48Arg | p.P48R | P12277 | protein_coding | deleterious(0) | probably_damaging(0.937) | TCGA-AG-3732-01 | Colorectum | rectum adenocarcinoma | Female | >=65 | I/II | Chemotherapy | capecitabine | SD | |
| CKB | SNV | Missense_Mutation | novel | c.669N>T | p.Lys223Asn | p.K223N | P12277 | protein_coding | deleterious(0) | probably_damaging(0.998) | TCGA-AP-A0LM-01 | Endometrium | uterine corpus endometrioid carcinoma | Female | <65 | III/IV | Chemotherapy | cisplatin | SD |
| CKB | SNV | Missense_Mutation | novel | c.577N>A | p.Leu193Ile | p.L193I | P12277 | protein_coding | deleterious(0.02) | possibly_damaging(0.551) | TCGA-AP-A1DM-01 | Endometrium | uterine corpus endometrioid carcinoma | Female | <65 | I/II | Unknown | Unknown | SD |
| CKB | SNV | Missense_Mutation | novel | c.1136N>T | p.Ala379Val | p.A379V | P12277 | protein_coding | deleterious(0.03) | benign(0.02) | TCGA-AP-A1DV-01 | Endometrium | uterine corpus endometrioid carcinoma | Female | <65 | I/II | Unknown | Unknown | SD |
| Page: 1 2 3 |
Top |
Related drugs of malignant transformation related genes |
| Identification of chemicals and drugs interact with genes involved in malignant transfromation |
| (DGIdb 4.0) |
| Entrez ID | Symbol | Category | Interaction Types | Drug Claim Name | Drug Name | PMIDs |
| Page: 1 |

Copyright 2023-Present -The University of Texas Health Science Center at Houston |