
|
|||||
|
 | |
| |
| |
| |
| |
| |
|
Gene: CKAP4 |
Gene summary for CKAP4 |
| Gene information | Species | Human | Gene symbol | CKAP4 | Gene ID | 10970 |
| Gene name | cytoskeleton associated protein 4 | |
| Gene Alias | CLIMP-63 | |
| Cytomap | 12q23.3 | |
| Gene Type | protein-coding | GO ID | GO:0000323 | UniProtAcc | A0A024RBH2 |
Top |
Malignant transformation analysis |
| Identification of the aberrant gene expression in precancerous and cancerous lesions by comparing the gene expression of stem-like cells in diseased tissues with normal stem cells |
| Entrez ID | Symbol | Replicates | Species | Organ | Tissue | Adj P-value | Log2FC | Malignancy |
| 10970 | CKAP4 | HTA11_3410_2000001011 | Human | Colorectum | AD | 1.07e-20 | 4.49e-01 | 0.0155 |
| 10970 | CKAP4 | HTA11_2487_2000001011 | Human | Colorectum | SER | 9.05e-15 | 6.26e-01 | -0.1808 |
| 10970 | CKAP4 | HTA11_2951_2000001011 | Human | Colorectum | AD | 4.81e-02 | 2.98e-01 | 0.0216 |
| 10970 | CKAP4 | HTA11_1938_2000001011 | Human | Colorectum | AD | 3.54e-13 | 6.09e-01 | -0.0811 |
| 10970 | CKAP4 | HTA11_78_2000001011 | Human | Colorectum | AD | 2.65e-22 | 7.14e-01 | -0.1088 |
| 10970 | CKAP4 | HTA11_347_2000001011 | Human | Colorectum | AD | 3.65e-34 | 8.41e-01 | -0.1954 |
| 10970 | CKAP4 | HTA11_411_2000001011 | Human | Colorectum | SER | 9.48e-18 | 1.63e+00 | -0.2602 |
| 10970 | CKAP4 | HTA11_2112_2000001011 | Human | Colorectum | SER | 7.15e-09 | 1.17e+00 | -0.2196 |
| 10970 | CKAP4 | HTA11_3361_2000001011 | Human | Colorectum | AD | 9.79e-16 | 7.97e-01 | -0.1207 |
| 10970 | CKAP4 | HTA11_83_2000001011 | Human | Colorectum | SER | 1.92e-13 | 6.15e-01 | -0.1526 |
| 10970 | CKAP4 | HTA11_696_2000001011 | Human | Colorectum | AD | 1.45e-34 | 1.09e+00 | -0.1464 |
| 10970 | CKAP4 | HTA11_866_2000001011 | Human | Colorectum | AD | 1.66e-16 | 6.44e-01 | -0.1001 |
| 10970 | CKAP4 | HTA11_1391_2000001011 | Human | Colorectum | AD | 6.71e-34 | 9.73e-01 | -0.059 |
| 10970 | CKAP4 | HTA11_2992_2000001011 | Human | Colorectum | SER | 3.67e-06 | 5.69e-01 | -0.1706 |
| 10970 | CKAP4 | HTA11_5212_2000001011 | Human | Colorectum | AD | 4.38e-12 | 5.28e-01 | -0.2061 |
| 10970 | CKAP4 | HTA11_5216_2000001011 | Human | Colorectum | SER | 3.73e-05 | 4.48e-01 | -0.1462 |
| 10970 | CKAP4 | HTA11_546_2000001011 | Human | Colorectum | AD | 7.63e-11 | 6.78e-01 | -0.0842 |
| 10970 | CKAP4 | HTA11_9341_2000001011 | Human | Colorectum | SER | 1.84e-04 | 5.99e-01 | -0.00410000000000005 |
| 10970 | CKAP4 | HTA11_7862_2000001011 | Human | Colorectum | AD | 5.29e-09 | 5.50e-01 | -0.0179 |
| 10970 | CKAP4 | HTA11_866_3004761011 | Human | Colorectum | AD | 1.91e-12 | 5.03e-01 | 0.096 |
| Page: 1 2 3 4 5 6 7 8 9 |
| Tissue | Expression Dynamics | Abbreviation |
| Colorectum (GSE201348) |  | FAP: Familial adenomatous polyposis |
| CRC: Colorectal cancer | ||
| Colorectum (HTA11) |  | AD: Adenomas |
| SER: Sessile serrated lesions | ||
| MSI-H: Microsatellite-high colorectal cancer | ||
| MSS: Microsatellite stable colorectal cancer | ||
| Endometrium | 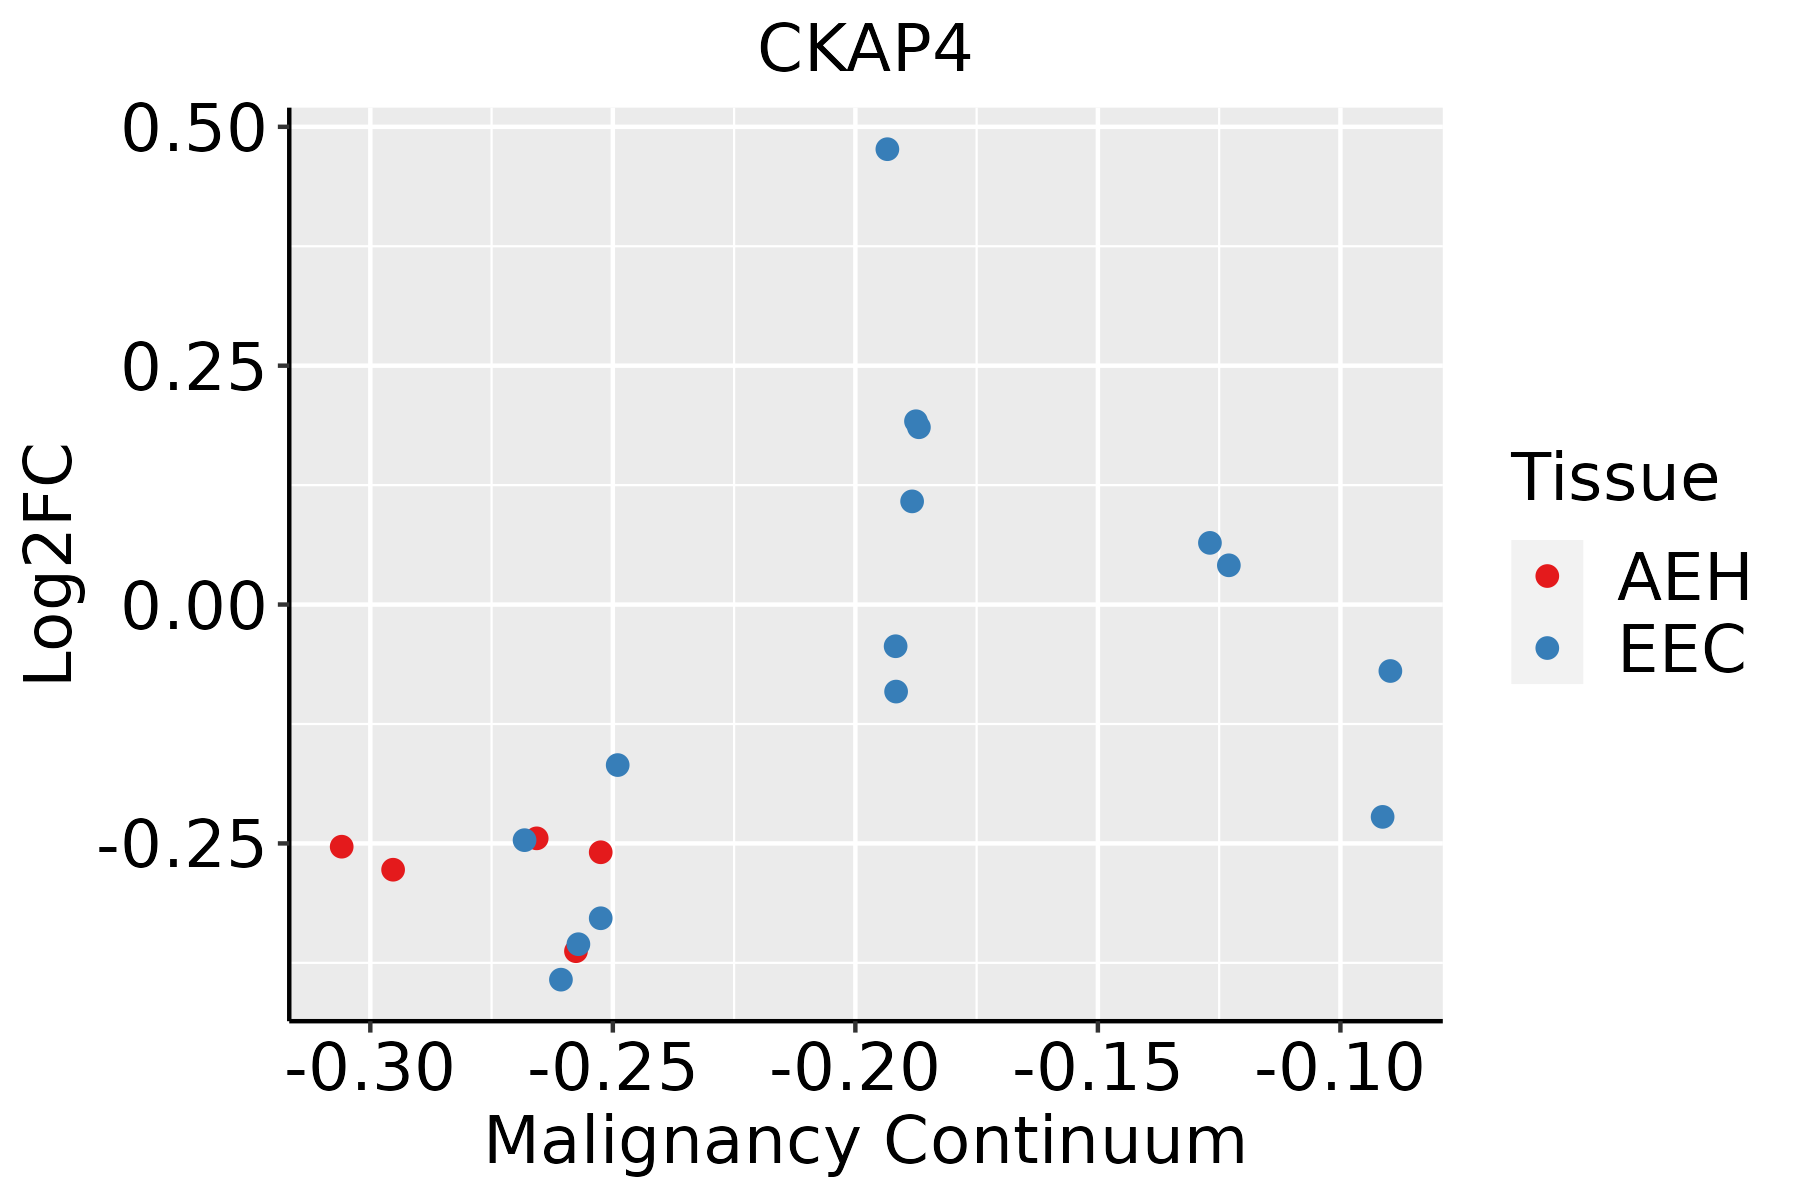 | AEH: Atypical endometrial hyperplasia |
| EEC: Endometrioid Cancer | ||
| Esophagus | 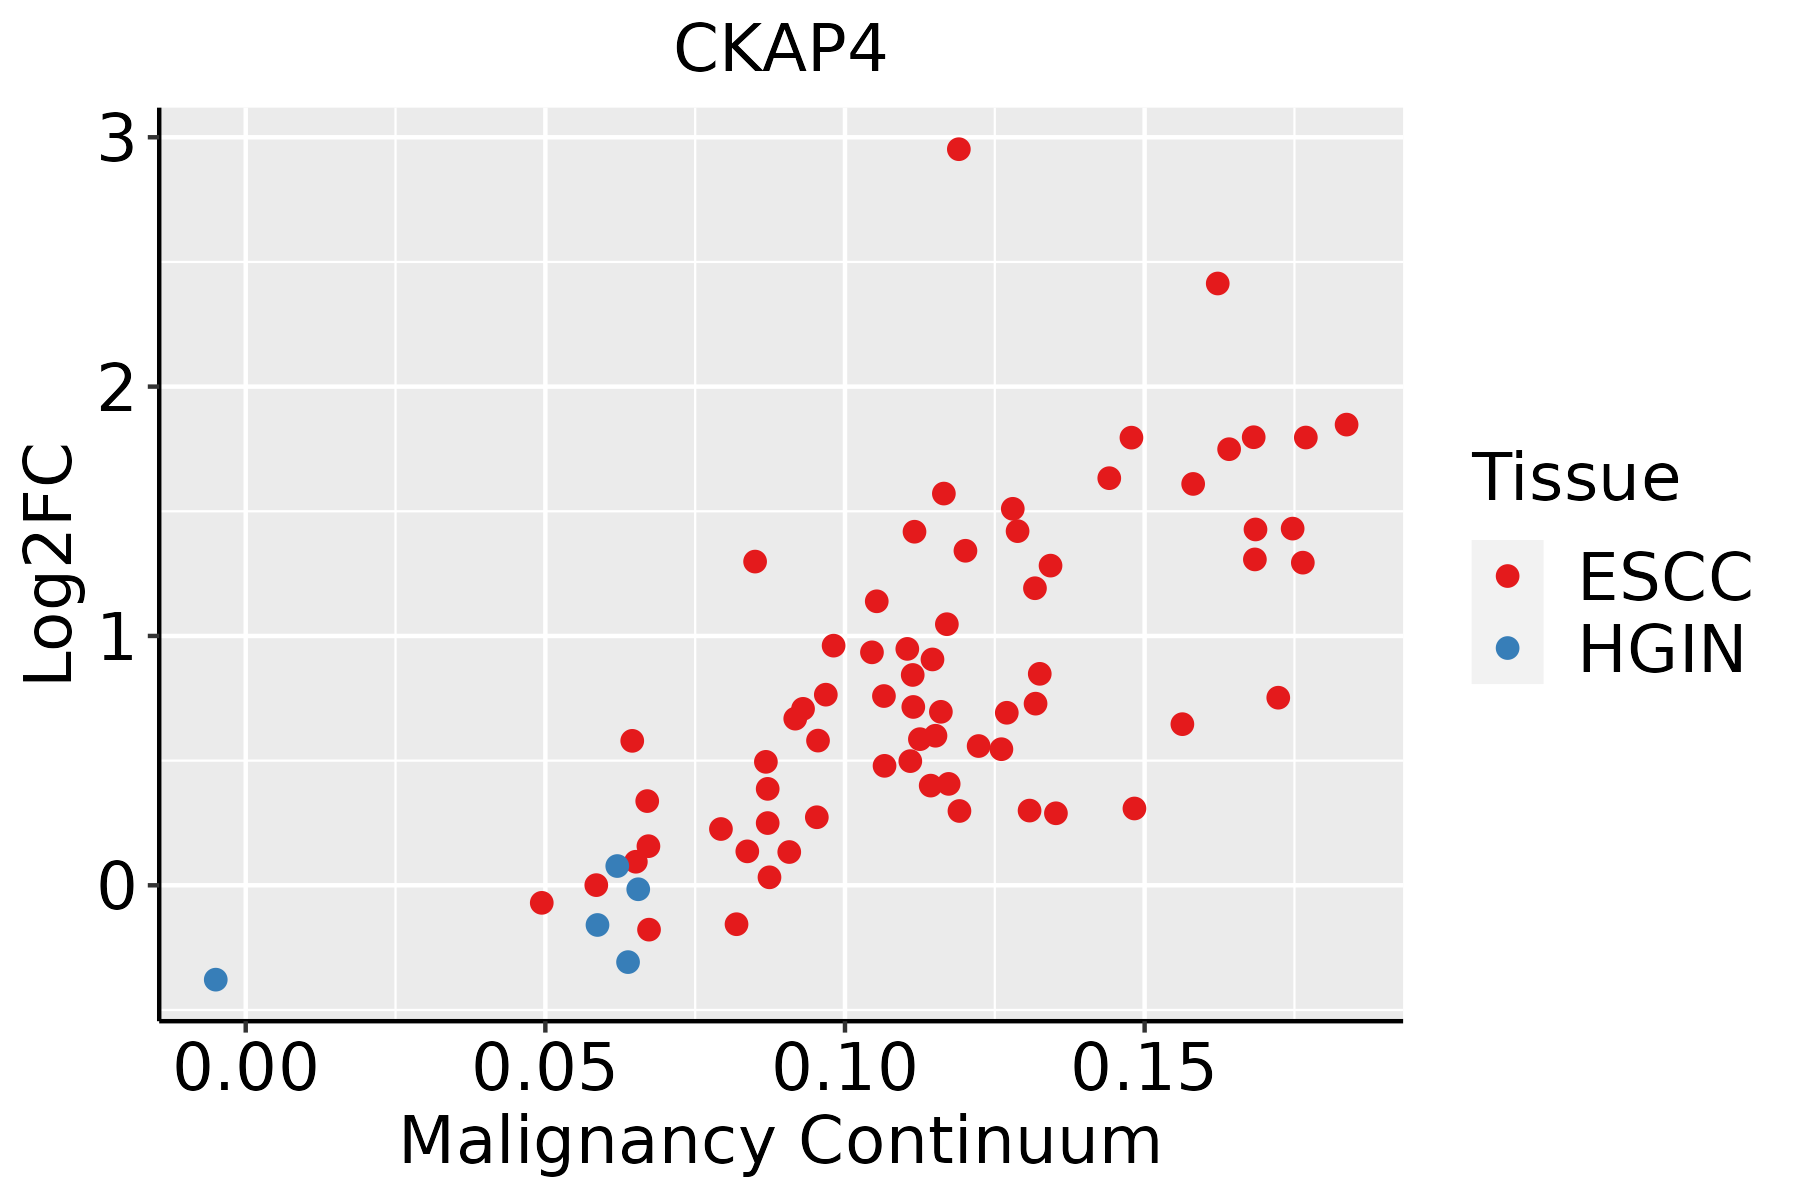 | ESCC: Esophageal squamous cell carcinoma |
| HGIN: High-grade intraepithelial neoplasias | ||
| LGIN: Low-grade intraepithelial neoplasias | ||
| Liver | 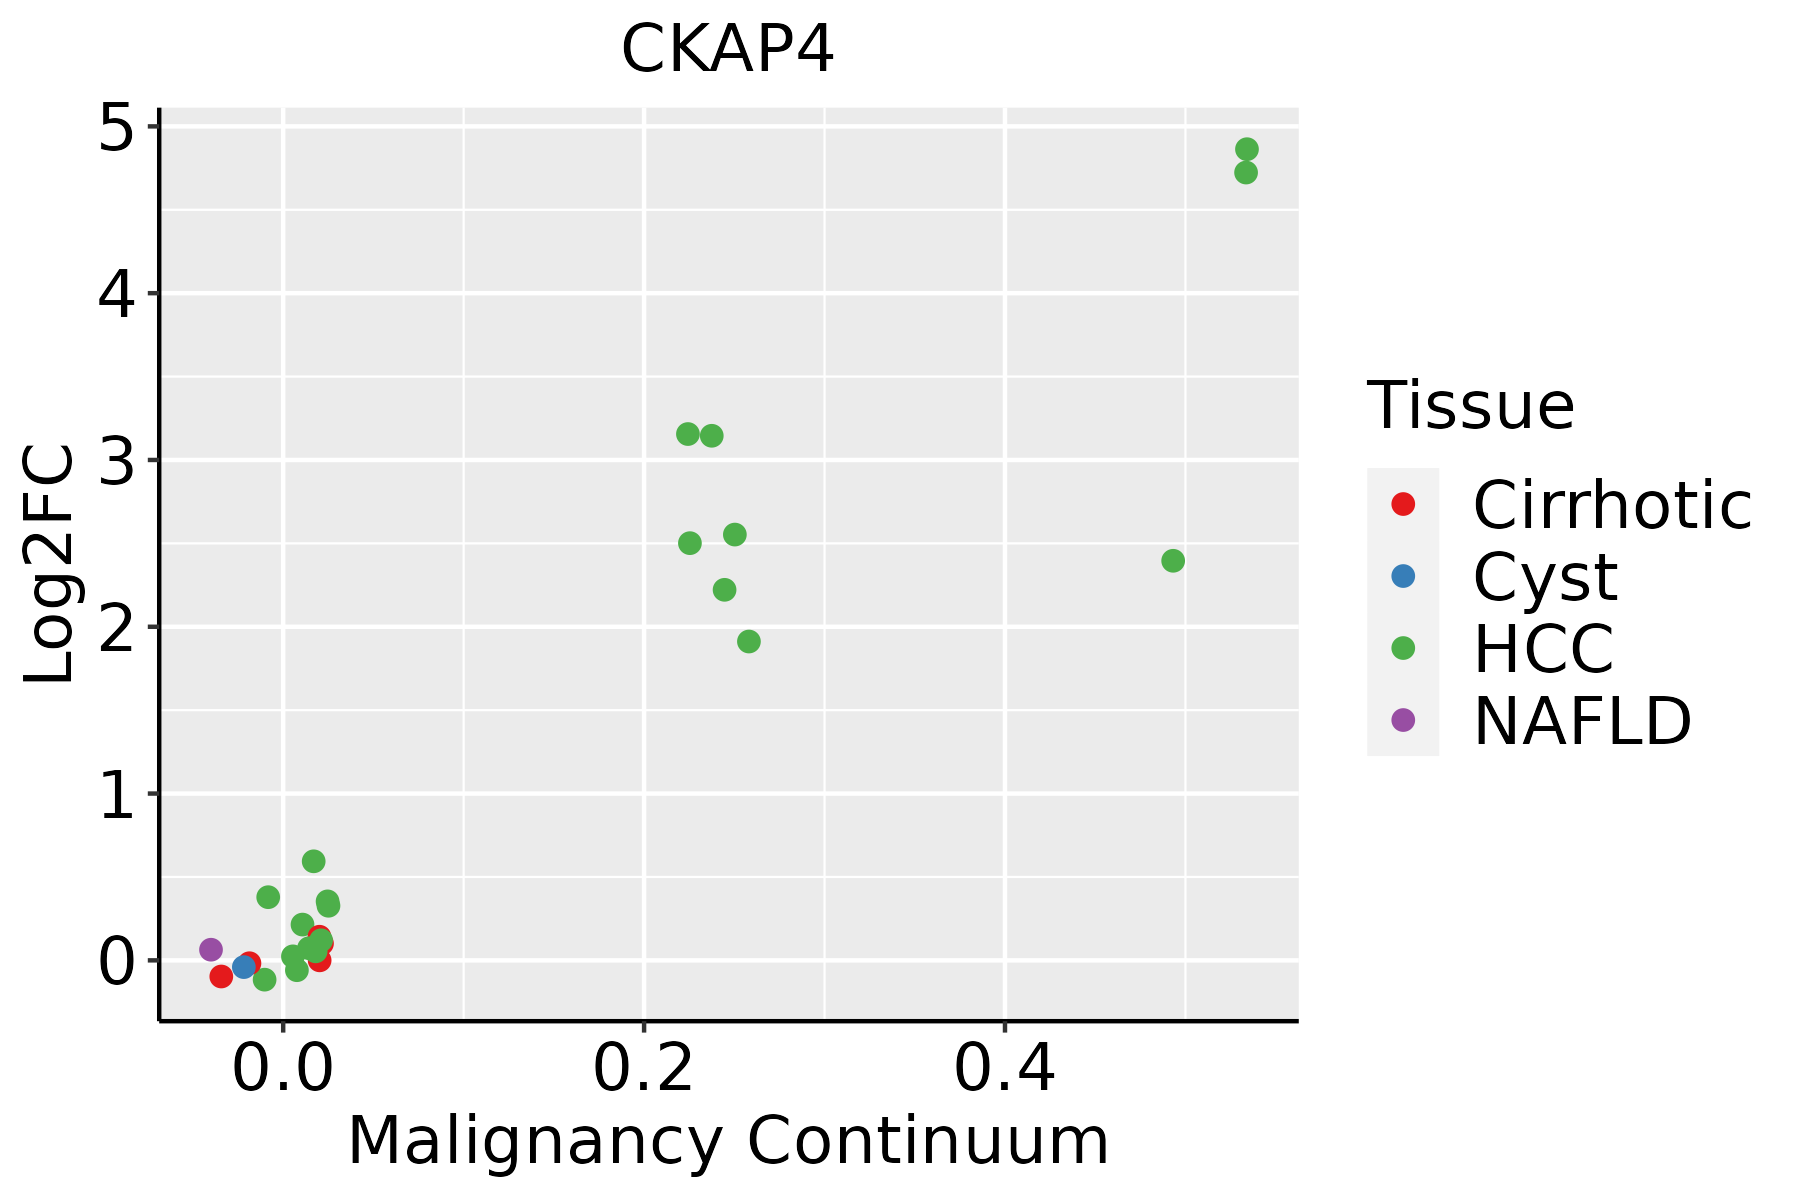 | HCC: Hepatocellular carcinoma |
| NAFLD: Non-alcoholic fatty liver disease | ||
| Oral Cavity | 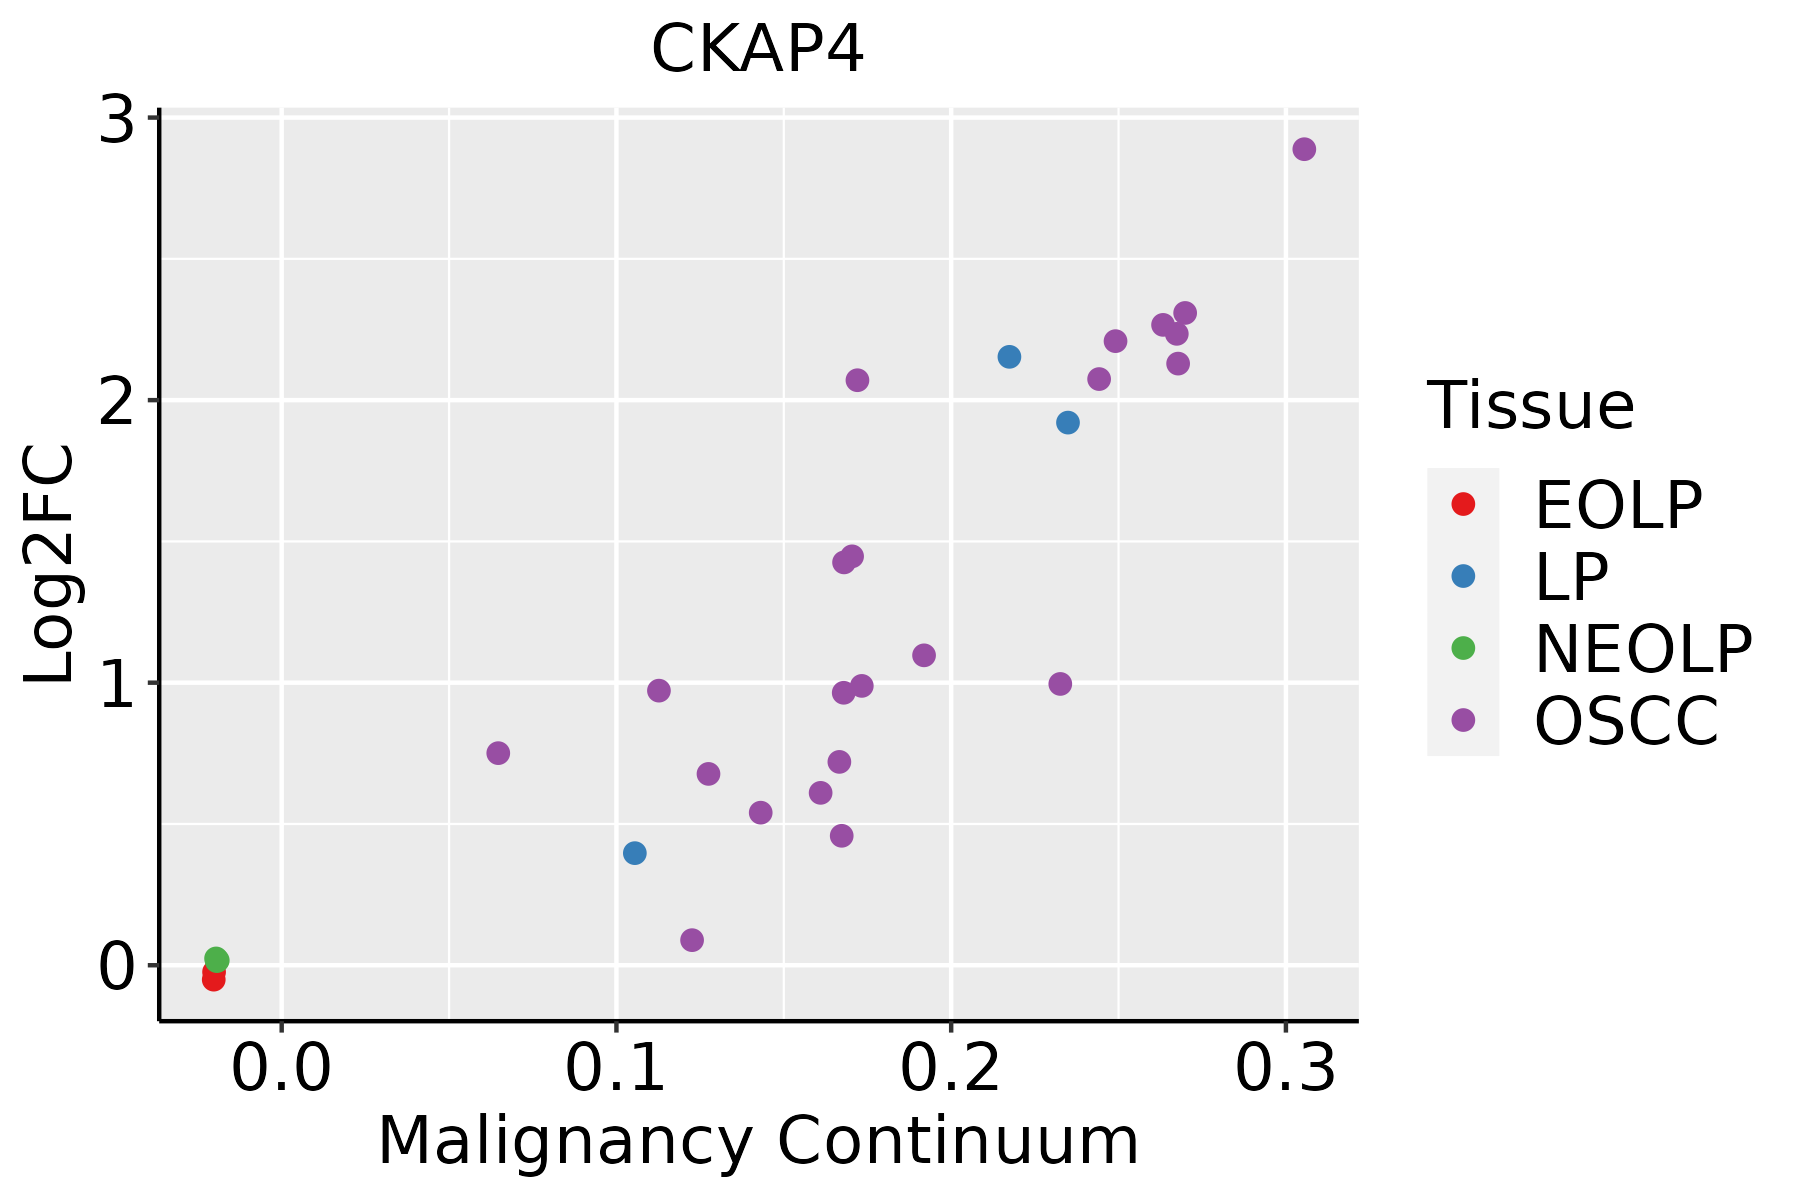 | EOLP: Erosive Oral lichen planus |
| LP: leukoplakia | ||
| NEOLP: Non-erosive oral lichen planus | ||
| OSCC: Oral squamous cell carcinoma | ||
| Prostate |  | BPH: Benign Prostatic Hyperplasia |
| Skin | 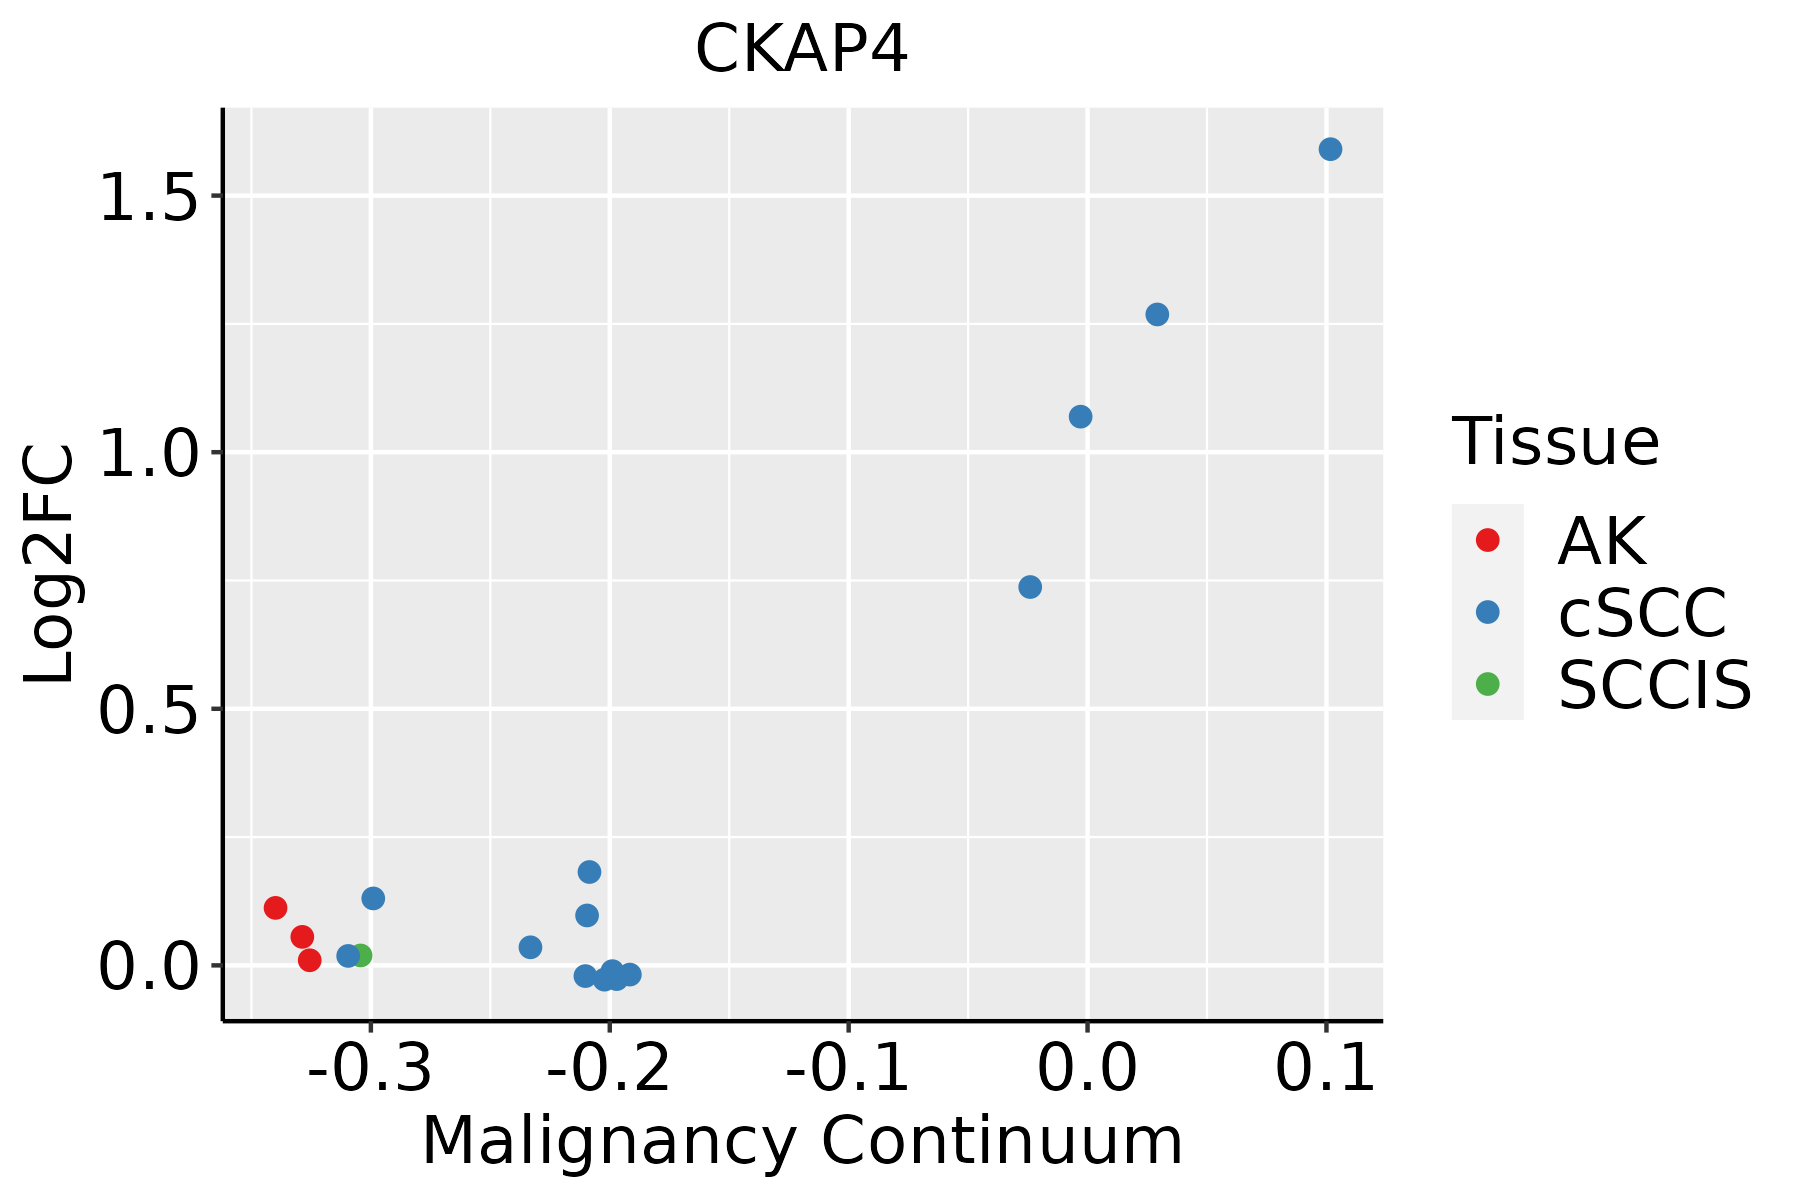 | AK: Actinic keratosis |
| cSCC: Cutaneous squamous cell carcinoma | ||
| SCCIS:squamous cell carcinoma in situ | ||
| Thyroid |  | ATC: Anaplastic thyroid cancer |
| HT: Hashimoto's thyroiditis | ||
| PTC: Papillary thyroid cancer |
| ∗log2FC in expression of this searched gene in stem-like cells from each diseased tissue sample relative to stem-like cells in normal samples in each tissue plotted against the malignancy continuum. Samples are colored based on if they are from different disease stage. |
Top |
Malignant transformation related pathway analysis |
| Find out the enriched GO biological processes and KEGG pathways involved in transition from healthy to precancer to cancer |
| Tissue | Disease Stage | Enriched GO biological Processes |
| Colorectum | AD |  |
| Colorectum | SER |  |
| Colorectum | MSS |  |
| Colorectum | MSI-H |  |
| Colorectum | FAP |  |
| ∗Top 15 enriched GO BP terms are showed in the bar plot of each disease state in each tissue. Each row represents a significant GO biological process which is colored according to the -log10(p.adjust). |
| Page: 1 2 3 4 5 6 7 8 9 |
| GO ID | Tissue | Disease Stage | Description | Gene Ratio | Bg Ratio | pvalue | p.adjust | Count |
| Page: 1 |
| Pathway ID | Tissue | Disease Stage | Description | Gene Ratio | Bg Ratio | pvalue | p.adjust | qvalue | Count |
| hsa04141 | Colorectum | AD | Protein processing in endoplasmic reticulum | 80/2092 | 174/8465 | 5.96e-10 | 1.25e-08 | 7.96e-09 | 80 |
| hsa041411 | Colorectum | AD | Protein processing in endoplasmic reticulum | 80/2092 | 174/8465 | 5.96e-10 | 1.25e-08 | 7.96e-09 | 80 |
| hsa041412 | Colorectum | SER | Protein processing in endoplasmic reticulum | 60/1580 | 174/8465 | 4.20e-07 | 7.33e-06 | 5.32e-06 | 60 |
| hsa041413 | Colorectum | SER | Protein processing in endoplasmic reticulum | 60/1580 | 174/8465 | 4.20e-07 | 7.33e-06 | 5.32e-06 | 60 |
| hsa041414 | Colorectum | MSS | Protein processing in endoplasmic reticulum | 75/1875 | 174/8465 | 3.78e-10 | 8.44e-09 | 5.17e-09 | 75 |
| hsa041415 | Colorectum | MSS | Protein processing in endoplasmic reticulum | 75/1875 | 174/8465 | 3.78e-10 | 8.44e-09 | 5.17e-09 | 75 |
| hsa041416 | Colorectum | MSI-H | Protein processing in endoplasmic reticulum | 46/797 | 174/8465 | 4.53e-11 | 9.78e-10 | 8.19e-10 | 46 |
| hsa041417 | Colorectum | MSI-H | Protein processing in endoplasmic reticulum | 46/797 | 174/8465 | 4.53e-11 | 9.78e-10 | 8.19e-10 | 46 |
| hsa0414126 | Endometrium | AEH | Protein processing in endoplasmic reticulum | 62/1197 | 174/8465 | 5.97e-13 | 1.39e-11 | 1.01e-11 | 62 |
| hsa04141111 | Endometrium | AEH | Protein processing in endoplasmic reticulum | 62/1197 | 174/8465 | 5.97e-13 | 1.39e-11 | 1.01e-11 | 62 |
| hsa0414127 | Endometrium | EEC | Protein processing in endoplasmic reticulum | 64/1237 | 174/8465 | 2.17e-13 | 5.09e-12 | 3.80e-12 | 64 |
| hsa0414136 | Endometrium | EEC | Protein processing in endoplasmic reticulum | 64/1237 | 174/8465 | 2.17e-13 | 5.09e-12 | 3.80e-12 | 64 |
| hsa0414139 | Esophagus | HGIN | Protein processing in endoplasmic reticulum | 67/1383 | 174/8465 | 1.06e-12 | 2.16e-11 | 1.72e-11 | 67 |
| hsa04141114 | Esophagus | HGIN | Protein processing in endoplasmic reticulum | 67/1383 | 174/8465 | 1.06e-12 | 2.16e-11 | 1.72e-11 | 67 |
| hsa04141211 | Esophagus | ESCC | Protein processing in endoplasmic reticulum | 147/4205 | 174/8465 | 3.29e-22 | 1.10e-19 | 5.64e-20 | 147 |
| hsa04141310 | Esophagus | ESCC | Protein processing in endoplasmic reticulum | 147/4205 | 174/8465 | 3.29e-22 | 1.10e-19 | 5.64e-20 | 147 |
| hsa0414114 | Liver | Cirrhotic | Protein processing in endoplasmic reticulum | 114/2530 | 174/8465 | 1.16e-22 | 9.67e-21 | 5.96e-21 | 114 |
| hsa0414115 | Liver | Cirrhotic | Protein processing in endoplasmic reticulum | 114/2530 | 174/8465 | 1.16e-22 | 9.67e-21 | 5.96e-21 | 114 |
| hsa0414122 | Liver | HCC | Protein processing in endoplasmic reticulum | 146/4020 | 174/8465 | 7.34e-24 | 2.46e-21 | 1.37e-21 | 146 |
| hsa0414132 | Liver | HCC | Protein processing in endoplasmic reticulum | 146/4020 | 174/8465 | 7.34e-24 | 2.46e-21 | 1.37e-21 | 146 |
| Page: 1 2 |
Top |
Cell-cell communication analysis |
| Identification of potential cell-cell interactions between two cell types and their ligand-receptor pairs for different disease states |
| Ligand | Receptor | LRpair | Pathway | Tissue | Disease Stage |
| Page: 1 |
Top |
Single-cell gene regulatory network inference analysis |
| Find out the significant the regulons (TFs) and the target genes of each regulon across cell types for different disease states |
| TF | Cell Type | Tissue | Disease Stage | Target Gene | RSS | Regulon Activity |
| ∗The dot plots of a searched regulon are shown for all cell subpopulations in each disease state of each tissue based on the regulon specific score inferred using pySCENIC and by calculating the average expression. |
| Page: 1 |
Top |
Somatic mutation of malignant transformation related genes |
| Annotation of somatic variants for genes involved in malignant transformation |
| Hugo Symbol | Variant Class | Variant Classification | dbSNP RS | HGVSc | HGVSp | HGVSp Short | SWISSPROT | BIOTYPE | SIFT | PolyPhen | Tumor Sample Barcode | Tissue | Histology | Sex | Age | Stage | Therapy Types | Drugs | Outcome |
| CKAP4 | SNV | Missense_Mutation | c.1105N>C | p.Glu369Gln | p.E369Q | Q07065 | protein_coding | tolerated(0.1) | benign(0.269) | TCGA-AC-A23H-01 | Breast | breast invasive carcinoma | Female | >=65 | I/II | Unknown | Unknown | PD | |
| CKAP4 | SNV | Missense_Mutation | novel | c.1489C>A | p.Pro497Thr | p.P497T | Q07065 | protein_coding | deleterious(0.01) | possibly_damaging(0.862) | TCGA-AN-A0AK-01 | Breast | breast invasive carcinoma | Female | >=65 | I/II | Unknown | Unknown | SD |
| CKAP4 | SNV | Missense_Mutation | c.824N>T | p.Ser275Phe | p.S275F | Q07065 | protein_coding | deleterious(0) | probably_damaging(0.947) | TCGA-EK-A3GK-01 | Cervix | cervical & endocervical cancer | Female | <65 | I/II | Unknown | Unknown | SD | |
| CKAP4 | SNV | Missense_Mutation | c.719G>A | p.Arg240Gln | p.R240Q | Q07065 | protein_coding | deleterious(0) | probably_damaging(0.985) | TCGA-AA-3710-01 | Colorectum | colon adenocarcinoma | Female | >=65 | I/II | Unknown | Unknown | SD | |
| CKAP4 | SNV | Missense_Mutation | rs141394460 | c.1094N>A | p.Arg365His | p.R365H | Q07065 | protein_coding | tolerated(0.58) | benign(0) | TCGA-AA-3984-01 | Colorectum | colon adenocarcinoma | Female | <65 | I/II | Unknown | Unknown | SD |
| CKAP4 | SNV | Missense_Mutation | rs376479872 | c.604N>A | p.Glu202Lys | p.E202K | Q07065 | protein_coding | deleterious(0) | probably_damaging(0.993) | TCGA-AA-3984-01 | Colorectum | colon adenocarcinoma | Female | <65 | I/II | Unknown | Unknown | SD |
| CKAP4 | SNV | Missense_Mutation | c.1251N>T | p.Glu417Asp | p.E417D | Q07065 | protein_coding | deleterious(0) | possibly_damaging(0.894) | TCGA-AA-A022-01 | Colorectum | colon adenocarcinoma | Female | >=65 | I/II | Unknown | Unknown | SD | |
| CKAP4 | SNV | Missense_Mutation | rs769777070 | c.979N>A | p.Glu327Lys | p.E327K | Q07065 | protein_coding | deleterious(0.01) | possibly_damaging(0.794) | TCGA-AG-A002-01 | Colorectum | rectum adenocarcinoma | Male | <65 | I/II | Unknown | Unknown | SD |
| CKAP4 | SNV | Missense_Mutation | novel | c.1052N>G | p.Ala351Gly | p.A351G | Q07065 | protein_coding | deleterious(0.02) | benign(0.124) | TCGA-AG-A036-01 | Colorectum | rectum adenocarcinoma | Male | >=65 | III/IV | Chemotherapy | 5-fluorouracil | CR |
| CKAP4 | SNV | Missense_Mutation | rs771014402 | c.1450N>A | p.Gly484Ser | p.G484S | Q07065 | protein_coding | tolerated(0.81) | benign(0.001) | TCGA-A5-A0G1-01 | Endometrium | uterine corpus endometrioid carcinoma | Female | >=65 | I/II | Unknown | Unknown | SD |
| Page: 1 2 3 4 5 6 |
Top |
Related drugs of malignant transformation related genes |
| Identification of chemicals and drugs interact with genes involved in malignant transfromation |
| (DGIdb 4.0) |
| Entrez ID | Symbol | Category | Interaction Types | Drug Claim Name | Drug Name | PMIDs |
| Page: 1 |

Copyright 2023-Present -The University of Texas Health Science Center at Houston |