
|
|||||
|
 | |
| |
| |
| |
| |
| |
|
Gene: CKAP2L |
Gene summary for CKAP2L |
| Gene information | Species | Human | Gene symbol | CKAP2L | Gene ID | 150468 |
| Gene name | cytoskeleton associated protein 2 like | |
| Gene Alias | CKAP2L | |
| Cytomap | 2q14.1 | |
| Gene Type | protein-coding | GO ID | GO:0000922 | UniProtAcc | Q8IYA6 |
Top |
Malignant transformation analysis |
| Identification of the aberrant gene expression in precancerous and cancerous lesions by comparing the gene expression of stem-like cells in diseased tissues with normal stem cells |
| Entrez ID | Symbol | Replicates | Species | Organ | Tissue | Adj P-value | Log2FC | Malignancy |
| 150468 | CKAP2L | LZE21T | Human | Esophagus | ESCC | 8.02e-04 | 4.29e-01 | 0.0655 |
| 150468 | CKAP2L | P1T-E | Human | Esophagus | ESCC | 2.97e-02 | 2.41e-01 | 0.0875 |
| 150468 | CKAP2L | P2T-E | Human | Esophagus | ESCC | 9.44e-07 | 2.61e-01 | 0.1177 |
| 150468 | CKAP2L | P4T-E | Human | Esophagus | ESCC | 2.90e-03 | 1.96e-01 | 0.1323 |
| 150468 | CKAP2L | P5T-E | Human | Esophagus | ESCC | 8.08e-19 | 4.49e-01 | 0.1327 |
| 150468 | CKAP2L | P9T-E | Human | Esophagus | ESCC | 6.74e-06 | 1.82e-01 | 0.1131 |
| 150468 | CKAP2L | P10T-E | Human | Esophagus | ESCC | 2.03e-09 | 4.39e-01 | 0.116 |
| 150468 | CKAP2L | P15T-E | Human | Esophagus | ESCC | 3.26e-02 | 1.40e-01 | 0.1149 |
| 150468 | CKAP2L | P17T-E | Human | Esophagus | ESCC | 2.60e-06 | 4.69e-01 | 0.1278 |
| 150468 | CKAP2L | P21T-E | Human | Esophagus | ESCC | 2.20e-17 | 7.24e-01 | 0.1617 |
| 150468 | CKAP2L | P24T-E | Human | Esophagus | ESCC | 9.53e-09 | 4.11e-01 | 0.1287 |
| 150468 | CKAP2L | P26T-E | Human | Esophagus | ESCC | 9.44e-07 | 2.47e-01 | 0.1276 |
| 150468 | CKAP2L | P28T-E | Human | Esophagus | ESCC | 9.20e-06 | 1.86e-01 | 0.1149 |
| 150468 | CKAP2L | P30T-E | Human | Esophagus | ESCC | 4.44e-04 | 4.72e-01 | 0.137 |
| 150468 | CKAP2L | P31T-E | Human | Esophagus | ESCC | 4.31e-06 | 2.66e-01 | 0.1251 |
| 150468 | CKAP2L | P32T-E | Human | Esophagus | ESCC | 9.74e-22 | 5.58e-01 | 0.1666 |
| 150468 | CKAP2L | P37T-E | Human | Esophagus | ESCC | 1.42e-07 | 1.79e-01 | 0.1371 |
| 150468 | CKAP2L | P38T-E | Human | Esophagus | ESCC | 2.58e-10 | 7.10e-01 | 0.127 |
| 150468 | CKAP2L | P42T-E | Human | Esophagus | ESCC | 9.46e-03 | 2.18e-01 | 0.1175 |
| 150468 | CKAP2L | P44T-E | Human | Esophagus | ESCC | 6.93e-04 | 2.32e-01 | 0.1096 |
| Page: 1 2 3 |
| Tissue | Expression Dynamics | Abbreviation |
| Esophagus | 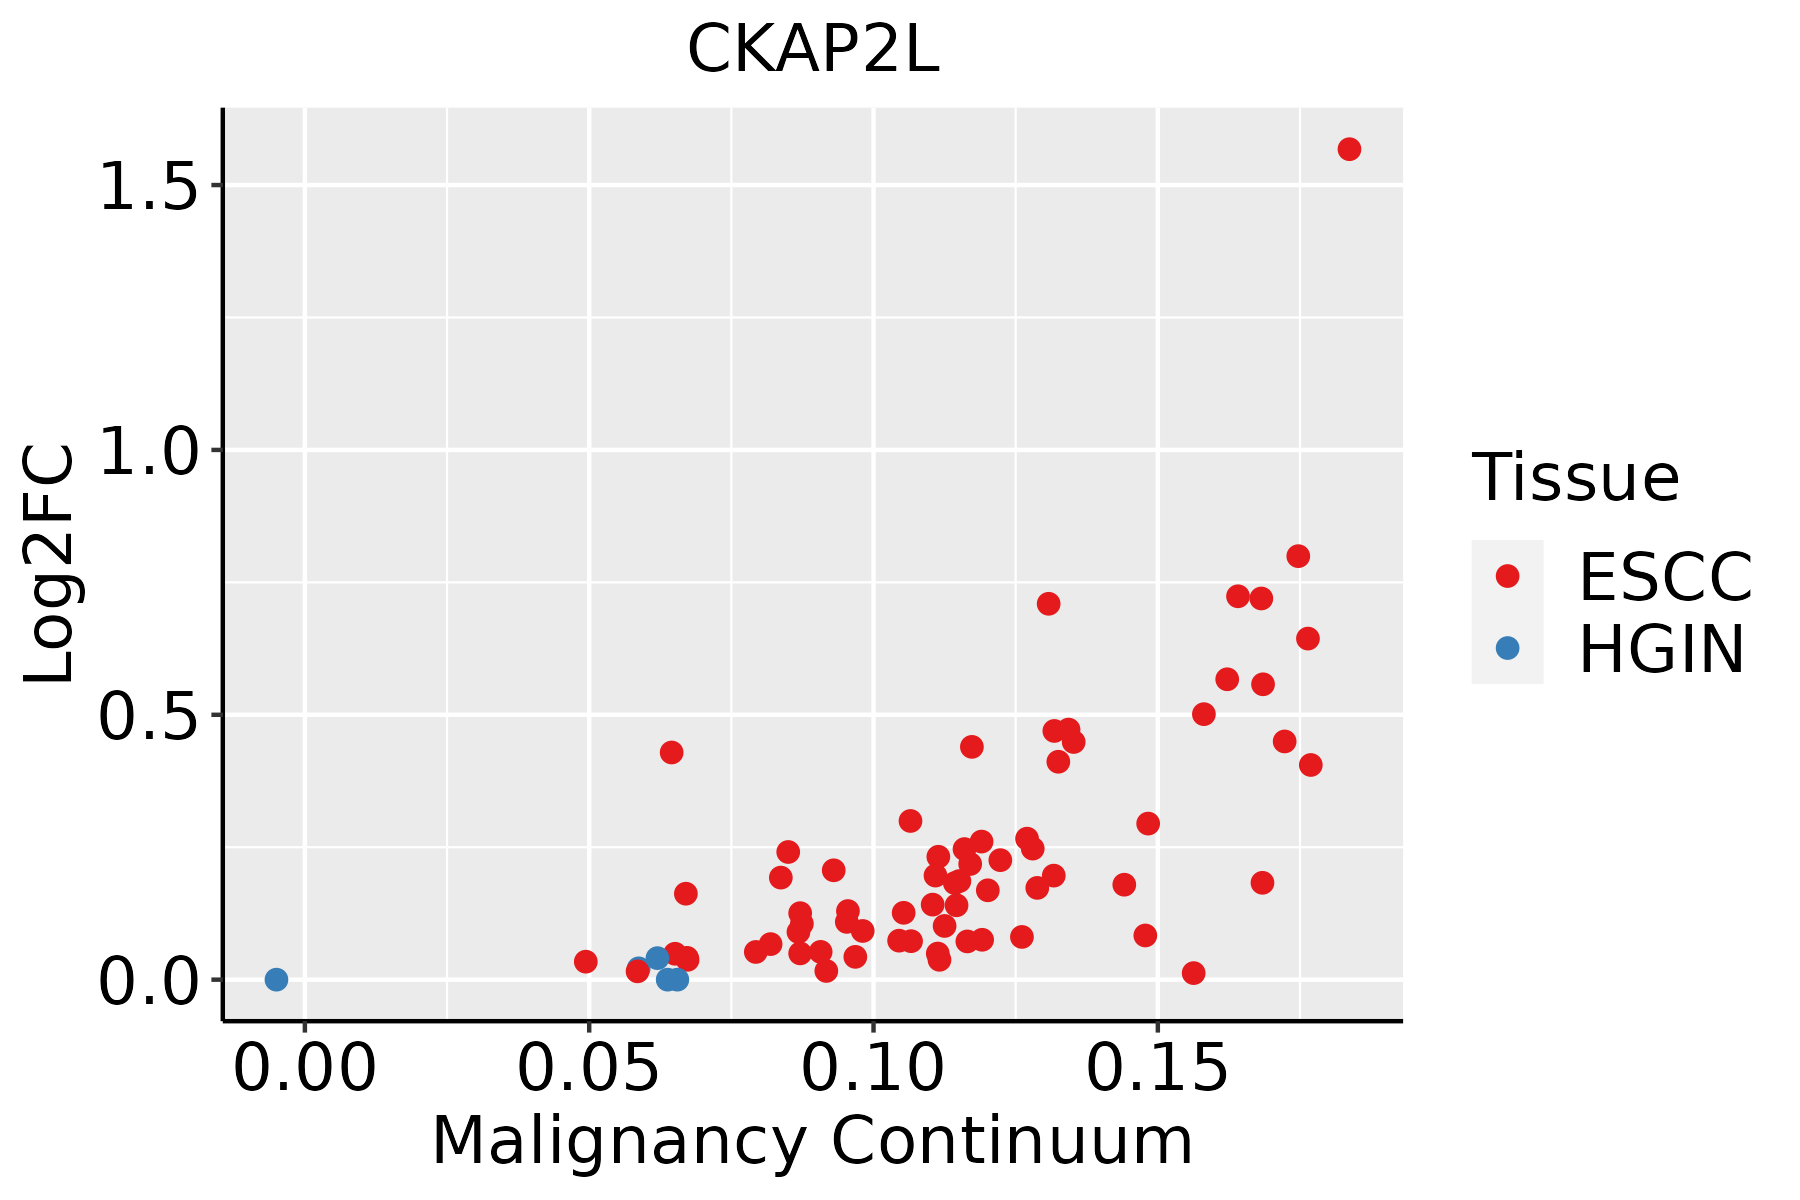 | ESCC: Esophageal squamous cell carcinoma |
| HGIN: High-grade intraepithelial neoplasias | ||
| LGIN: Low-grade intraepithelial neoplasias | ||
| Liver | 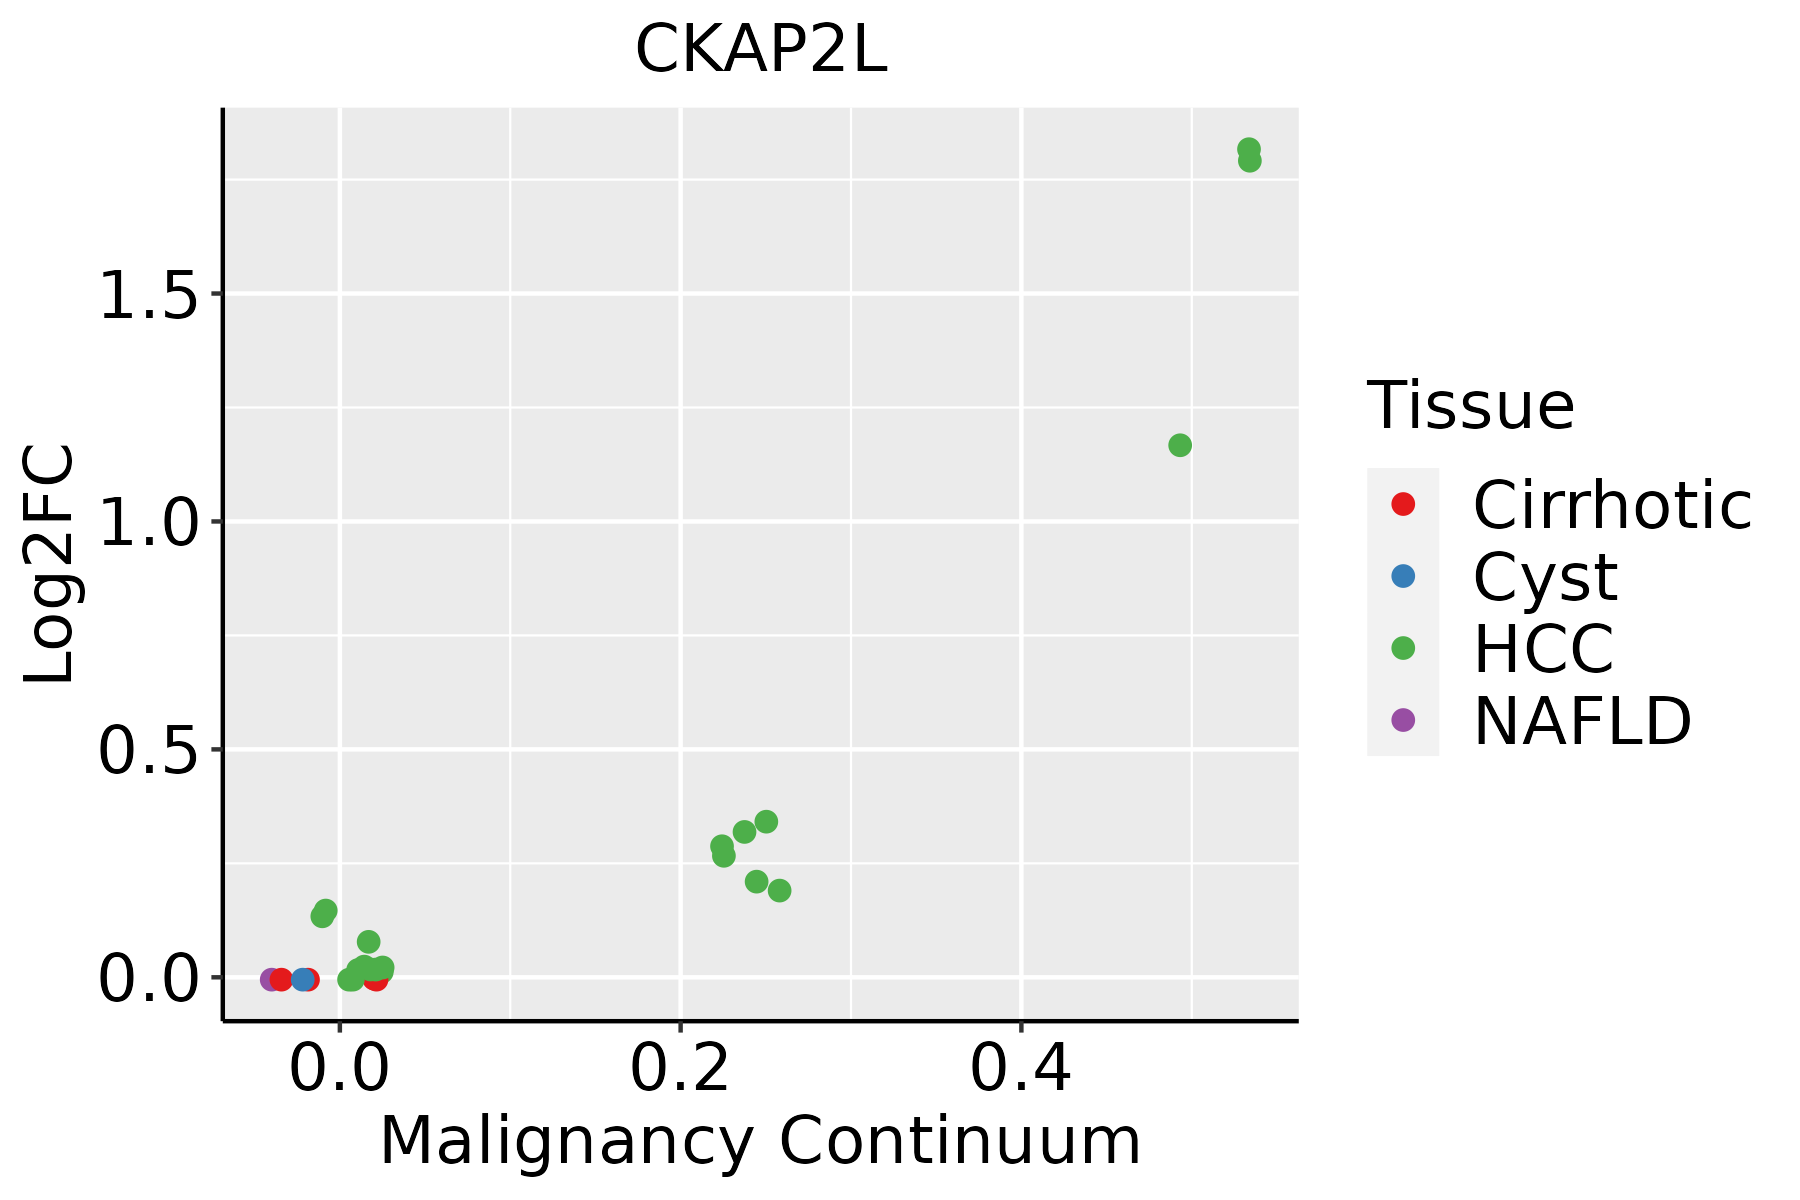 | HCC: Hepatocellular carcinoma |
| NAFLD: Non-alcoholic fatty liver disease | ||
| Oral Cavity |  | EOLP: Erosive Oral lichen planus |
| LP: leukoplakia | ||
| NEOLP: Non-erosive oral lichen planus | ||
| OSCC: Oral squamous cell carcinoma |
| ∗log2FC in expression of this searched gene in stem-like cells from each diseased tissue sample relative to stem-like cells in normal samples in each tissue plotted against the malignancy continuum. Samples are colored based on if they are from different disease stage. |
Top |
Malignant transformation related pathway analysis |
| Find out the enriched GO biological processes and KEGG pathways involved in transition from healthy to precancer to cancer |
| Tissue | Disease Stage | Enriched GO biological Processes |
| Colorectum | AD |  |
| Colorectum | SER |  |
| Colorectum | MSS |  |
| Colorectum | MSI-H |  |
| Colorectum | FAP |  |
| ∗Top 15 enriched GO BP terms are showed in the bar plot of each disease state in each tissue. Each row represents a significant GO biological process which is colored according to the -log10(p.adjust). |
| Page: 1 2 3 4 5 6 7 8 9 |
| GO ID | Tissue | Disease Stage | Description | Gene Ratio | Bg Ratio | pvalue | p.adjust | Count |
| Page: 1 |
| Pathway ID | Tissue | Disease Stage | Description | Gene Ratio | Bg Ratio | pvalue | p.adjust | qvalue | Count |
| Page: 1 |
Top |
Cell-cell communication analysis |
| Identification of potential cell-cell interactions between two cell types and their ligand-receptor pairs for different disease states |
| Ligand | Receptor | LRpair | Pathway | Tissue | Disease Stage |
| Page: 1 |
Top |
Single-cell gene regulatory network inference analysis |
| Find out the significant the regulons (TFs) and the target genes of each regulon across cell types for different disease states |
| TF | Cell Type | Tissue | Disease Stage | Target Gene | RSS | Regulon Activity |
| ∗The dot plots of a searched regulon are shown for all cell subpopulations in each disease state of each tissue based on the regulon specific score inferred using pySCENIC and by calculating the average expression. |
| Page: 1 |
Top |
Somatic mutation of malignant transformation related genes |
| Annotation of somatic variants for genes involved in malignant transformation |
| Hugo Symbol | Variant Class | Variant Classification | dbSNP RS | HGVSc | HGVSp | HGVSp Short | SWISSPROT | BIOTYPE | SIFT | PolyPhen | Tumor Sample Barcode | Tissue | Histology | Sex | Age | Stage | Therapy Types | Drugs | Outcome |
| CKAP2L | SNV | Missense_Mutation | c.413N>A | p.Pro138His | p.P138H | Q8IYA6 | protein_coding | deleterious(0.01) | possibly_damaging(0.694) | TCGA-A2-A0YC-01 | Breast | breast invasive carcinoma | Female | <65 | I/II | Hormone Therapy | arimidex | PD | |
| CKAP2L | SNV | Missense_Mutation | novel | c.736N>A | p.Val246Ile | p.V246I | Q8IYA6 | protein_coding | tolerated(0.15) | benign(0.067) | TCGA-A8-A09Z-01 | Breast | breast invasive carcinoma | Female | >=65 | I/II | Unknown | Unknown | SD |
| CKAP2L | SNV | Missense_Mutation | c.572N>A | p.Ile191Asn | p.I191N | Q8IYA6 | protein_coding | deleterious(0.05) | benign(0) | TCGA-AN-A0AK-01 | Breast | breast invasive carcinoma | Female | >=65 | I/II | Unknown | Unknown | SD | |
| CKAP2L | SNV | Missense_Mutation | rs372791577 | c.520N>A | p.Glu174Lys | p.E174K | Q8IYA6 | protein_coding | tolerated(0.35) | benign(0.003) | TCGA-BH-A0B7-01 | Breast | breast invasive carcinoma | Female | <65 | I/II | Chemotherapy | adriamycin | CR |
| CKAP2L | SNV | Missense_Mutation | c.1514N>C | p.Glu505Ala | p.E505A | Q8IYA6 | protein_coding | deleterious(0.04) | possibly_damaging(0.641) | TCGA-BH-A0BS-01 | Breast | breast invasive carcinoma | Female | <65 | III/IV | Chemotherapy | adriamycin | CR | |
| CKAP2L | SNV | Missense_Mutation | rs772584190 | c.1031A>G | p.Tyr344Cys | p.Y344C | Q8IYA6 | protein_coding | tolerated(0.18) | benign(0) | TCGA-BH-A18G-01 | Breast | breast invasive carcinoma | Female | >=65 | I/II | Unknown | Unknown | SD |
| CKAP2L | SNV | Missense_Mutation | c.139N>G | p.Gln47Glu | p.Q47E | Q8IYA6 | protein_coding | deleterious(0.02) | benign(0) | TCGA-C8-A12K-01 | Breast | breast invasive carcinoma | Female | >=65 | I/II | Unknown | Unknown | SD | |
| CKAP2L | SNV | Missense_Mutation | novel | c.1190N>C | p.Arg397Thr | p.R397T | Q8IYA6 | protein_coding | tolerated(0.13) | benign(0.011) | TCGA-GM-A3NY-01 | Breast | breast invasive carcinoma | Female | >=65 | I/II | Hormone Therapy | arimidex | SD |
| CKAP2L | deletion | In_Frame_Del | c.1907_1909delNNN | p.Cys636_Leu637delinsPhe | p.C636_L637delinsF | Q8IYA6 | protein_coding | TCGA-AN-A0AK-01 | Breast | breast invasive carcinoma | Female | >=65 | I/II | Unknown | Unknown | SD | |||
| CKAP2L | SNV | Missense_Mutation | novel | c.935G>T | p.Arg312Ile | p.R312I | Q8IYA6 | protein_coding | deleterious(0.03) | possibly_damaging(0.452) | TCGA-2W-A8YY-01 | Cervix | cervical & endocervical cancer | Female | <65 | I/II | Chemotherapy | cisplatin | CR |
| Page: 1 2 3 4 5 6 7 8 |
Top |
Related drugs of malignant transformation related genes |
| Identification of chemicals and drugs interact with genes involved in malignant transfromation |
| (DGIdb 4.0) |
| Entrez ID | Symbol | Category | Interaction Types | Drug Claim Name | Drug Name | PMIDs |
| Page: 1 |

Copyright 2023-Present -The University of Texas Health Science Center at Houston |