Schematic overview of the cellular and molecular mechanisms involved in the cancer progression, including the proposed cellular and molecular mechanisms in cancer cells trajectory. AT1: alveolar type 1 cells; AT2: alveolar type 2 cells; AAH: atypical adenomatous hyperplasia; AIS: adenocarcinoma in situ; MIA: minimally invasive adenocarcinoma; IA: invasive adenocarcinoma; EMT: epithelial-mesenchymal transition

Home

Download

Statistics

Help

Contact

Center for Computational Systems Medicine
leaf

Gene summary

leaf

Malignant transformation analysis

leaf

Malignant transformation related pathway analysis

leaf

Cell-cell communication analysis

leaf

Single-cell gene regulatory network inference analysis

leaf

Somatic mutation of malignant transformation related genes

leaf

Related drugs of malignant transformation related genes

Gene: CKAP2

Gene summary for CKAP2

check button Gene summary.

Gene informationSpeciesHuman
Gene symbol

CKAP2

Gene ID

26586

Gene namecytoskeleton associated protein 2
Gene AliasLB1
Cytomap13q14.3
Gene Typeprotein-coding
GO ID

GO:0000226

UniProtAcc

Q8WWK9


Top

Malignant transformation analysis

check button Identification of the aberrant gene expression in precancerous and cancerous lesions by comparing the gene expression of stem-like cells in diseased tissues with normal stem cells
check button Malignant transformation involving gene list.
Entrez IDSymbolReplicatesSpeciesOrganTissueAdj P-valueLog2FCMalignancy
26586CKAP2LZE4THumanEsophagusESCC1.86e-063.10e-010.0811
26586CKAP2LZE7THumanEsophagusESCC1.52e-062.49e-010.0667
26586CKAP2LZE24THumanEsophagusESCC1.40e-113.01e-010.0596
26586CKAP2LZE21THumanEsophagusESCC1.31e-022.42e-010.0655
26586CKAP2LZE6THumanEsophagusESCC4.54e-041.85e-010.0845
26586CKAP2P1T-EHumanEsophagusESCC1.09e-054.76e-010.0875
26586CKAP2P2T-EHumanEsophagusESCC2.93e-257.54e-010.1177
26586CKAP2P4T-EHumanEsophagusESCC3.38e-268.19e-010.1323
26586CKAP2P5T-EHumanEsophagusESCC1.81e-103.98e-010.1327
26586CKAP2P8T-EHumanEsophagusESCC1.49e-032.28e-010.0889
26586CKAP2P9T-EHumanEsophagusESCC4.76e-083.67e-010.1131
26586CKAP2P10T-EHumanEsophagusESCC9.01e-206.46e-010.116
26586CKAP2P11T-EHumanEsophagusESCC1.66e-031.88e-010.1426
26586CKAP2P12T-EHumanEsophagusESCC3.34e-174.43e-010.1122
26586CKAP2P15T-EHumanEsophagusESCC1.51e-103.41e-010.1149
26586CKAP2P16T-EHumanEsophagusESCC3.41e-133.70e-010.1153
26586CKAP2P17T-EHumanEsophagusESCC6.41e-096.91e-010.1278
26586CKAP2P19T-EHumanEsophagusESCC1.01e-045.37e-010.1662
26586CKAP2P20T-EHumanEsophagusESCC5.41e-308.10e-010.1124
26586CKAP2P21T-EHumanEsophagusESCC3.08e-175.84e-010.1617
Page: 1 2 3 4 5 

check button Transcriptomic changes along malignancy continuum.
TissueExpression DynamicsAbbreviation
EsophagusThe image shows the transcriptomic changes along malignancy continuum.log2FC in expression of this searched gene in stem-like cells from each diseased tissue sample relative to stem-like cells in normal samples in each tissue plotted against the malignancy continuum. Samples are colored based on if they are from different disease stage.
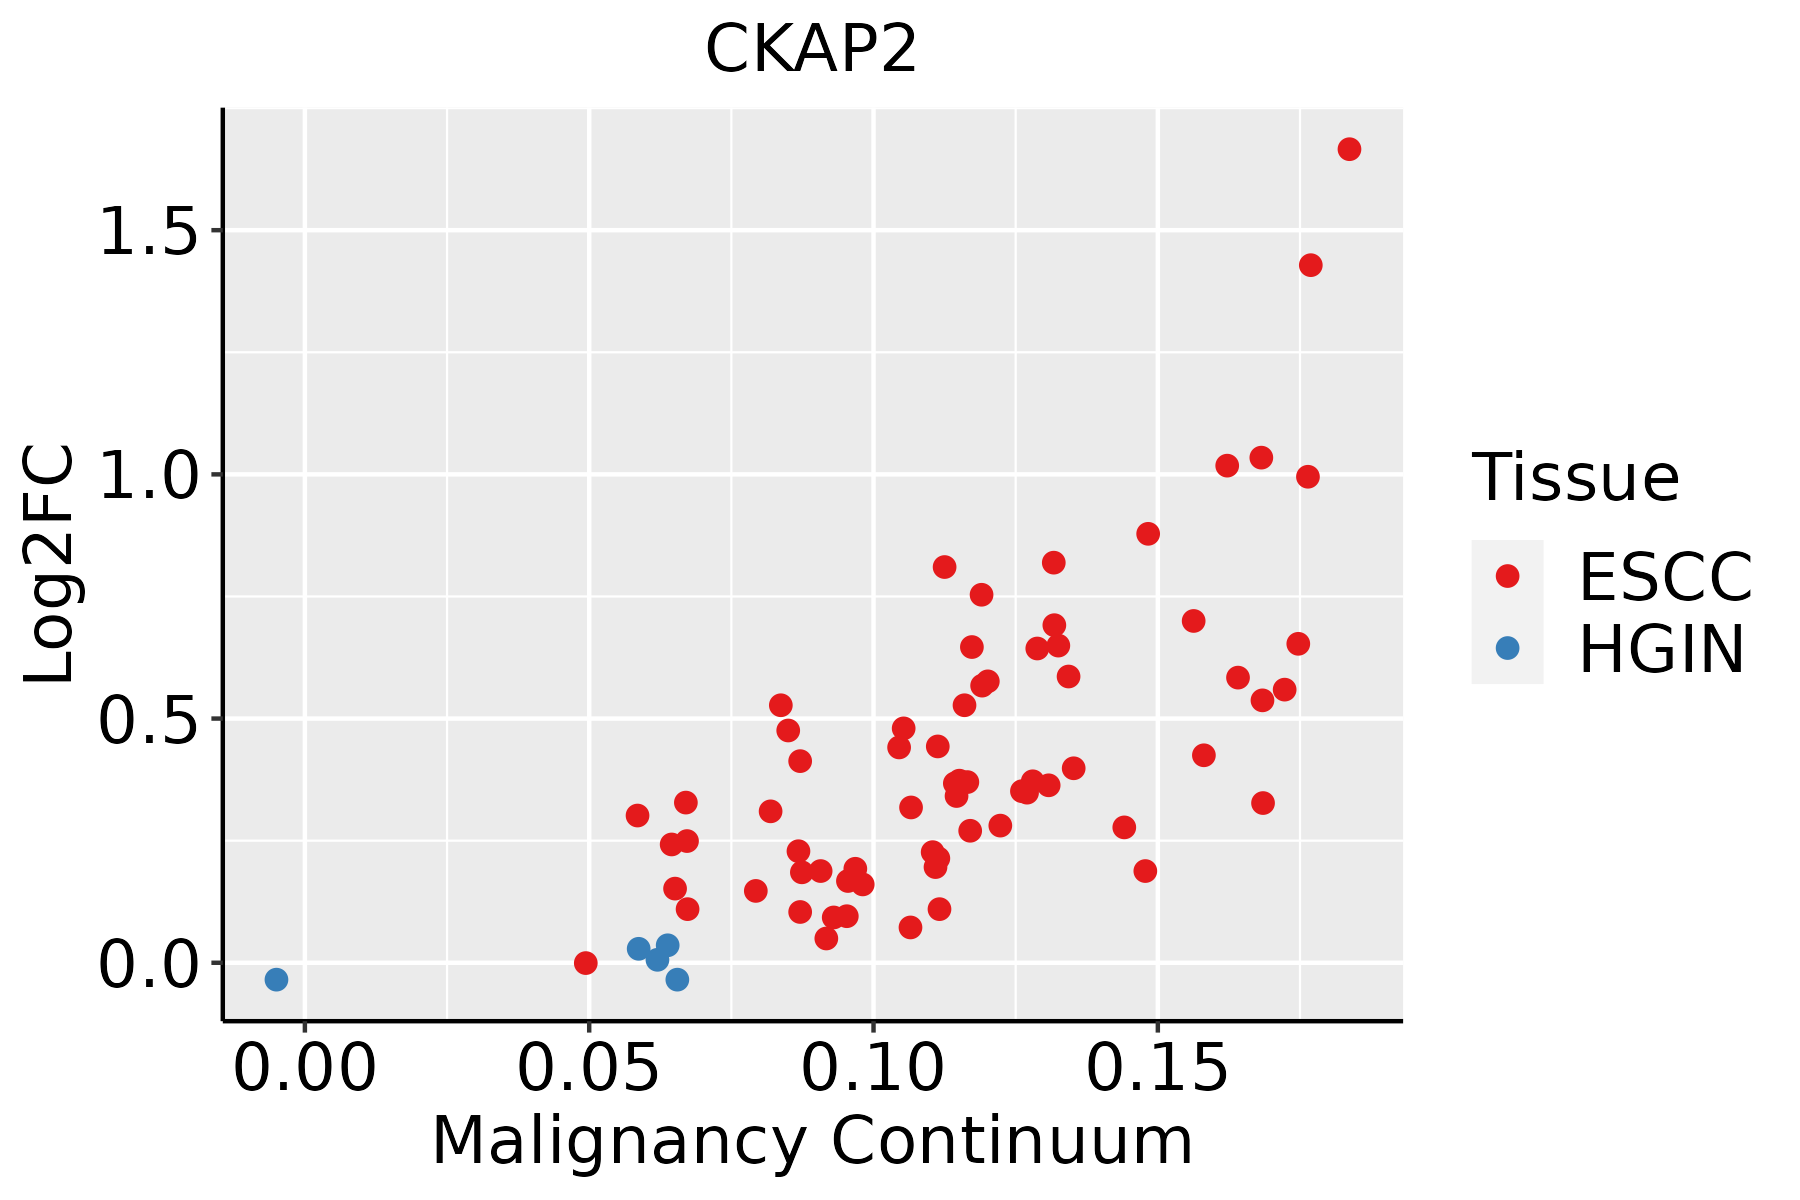
ESCC: Esophageal squamous cell carcinoma
HGIN: High-grade intraepithelial neoplasias
LGIN: Low-grade intraepithelial neoplasias
LiverThe image shows the transcriptomic changes along malignancy continuum.log2FC in expression of this searched gene in stem-like cells from each diseased tissue sample relative to stem-like cells in normal samples in each tissue plotted against the malignancy continuum. Samples are colored based on if they are from different disease stage.
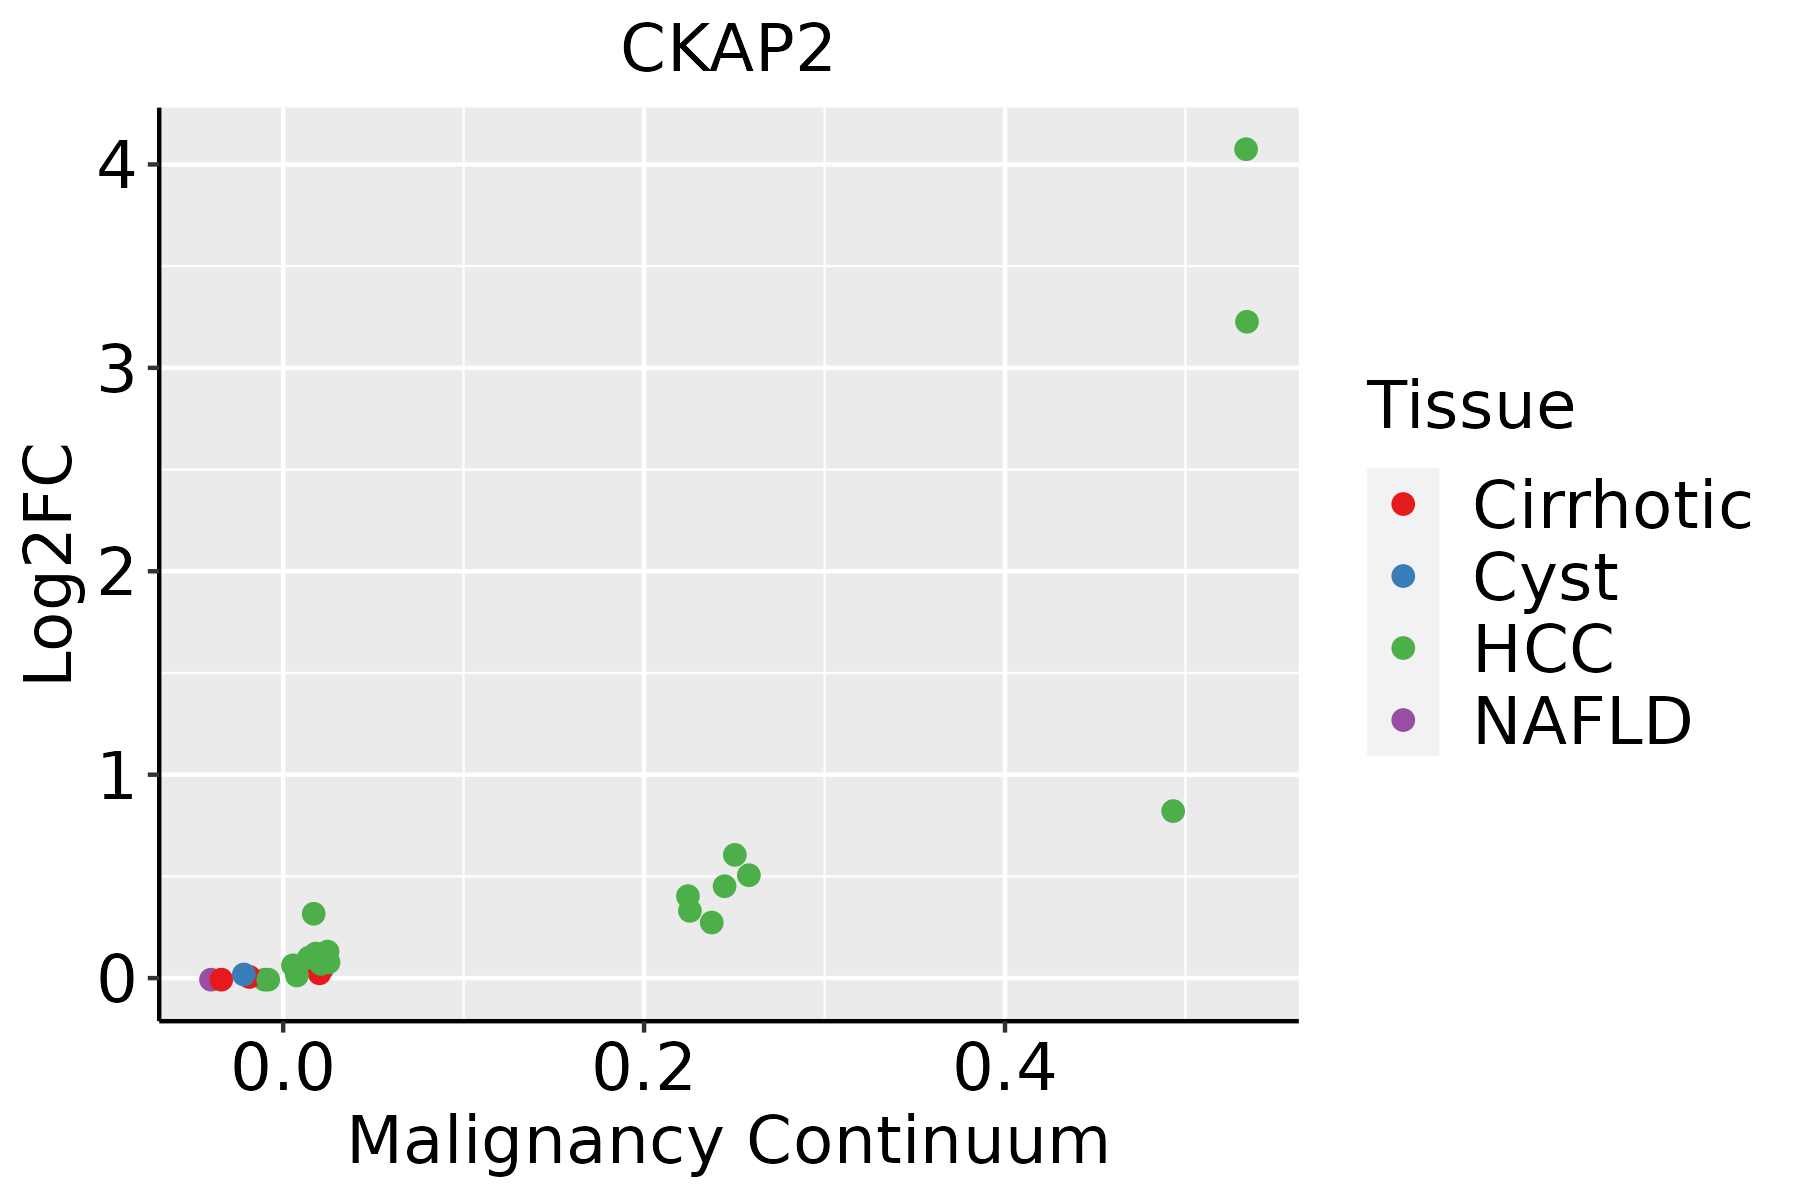
HCC: Hepatocellular carcinoma
NAFLD: Non-alcoholic fatty liver disease
Oral CavityThe image shows the transcriptomic changes along malignancy continuum.log2FC in expression of this searched gene in stem-like cells from each diseased tissue sample relative to stem-like cells in normal samples in each tissue plotted against the malignancy continuum. Samples are colored based on if they are from different disease stage.
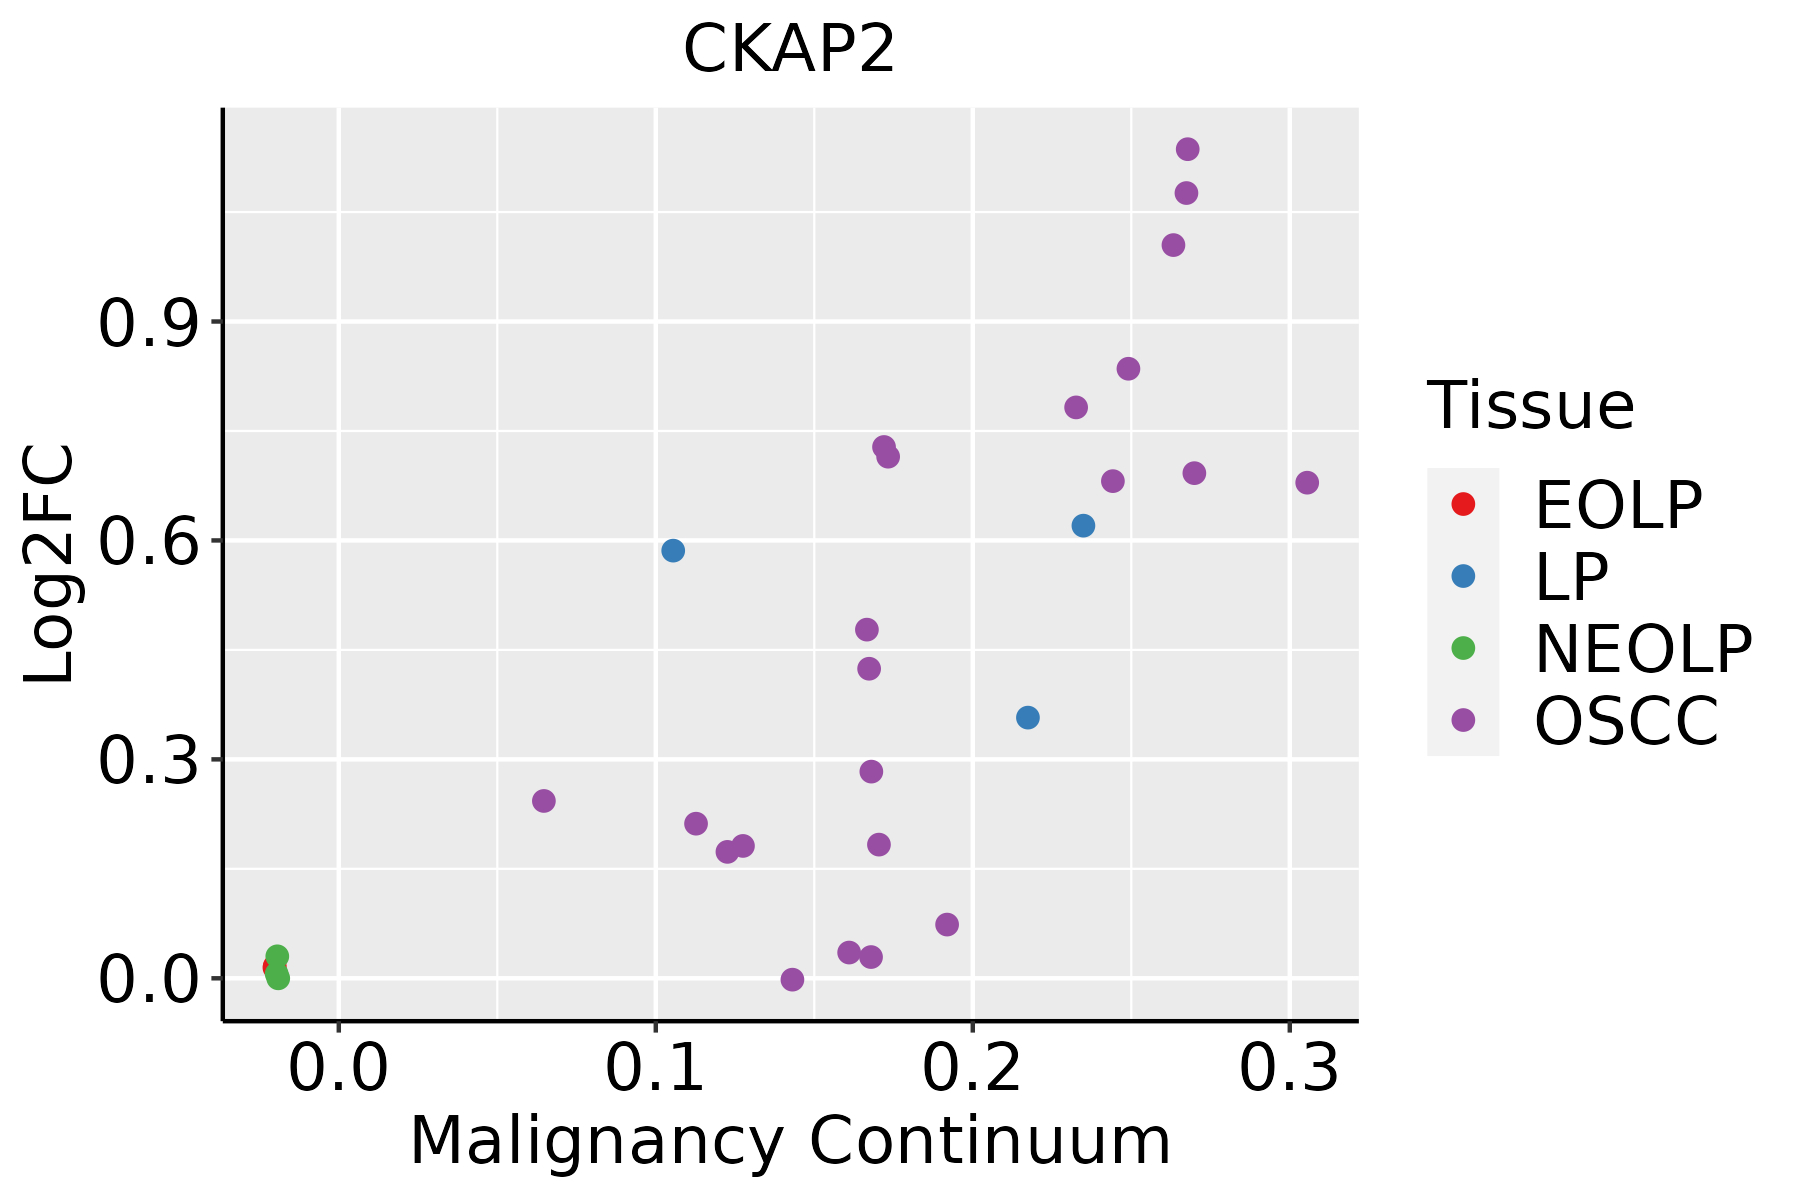
EOLP: Erosive Oral lichen planus
LP: leukoplakia
NEOLP: Non-erosive oral lichen planus
OSCC: Oral squamous cell carcinoma
SkinThe image shows the transcriptomic changes along malignancy continuum.log2FC in expression of this searched gene in stem-like cells from each diseased tissue sample relative to stem-like cells in normal samples in each tissue plotted against the malignancy continuum. Samples are colored based on if they are from different disease stage.
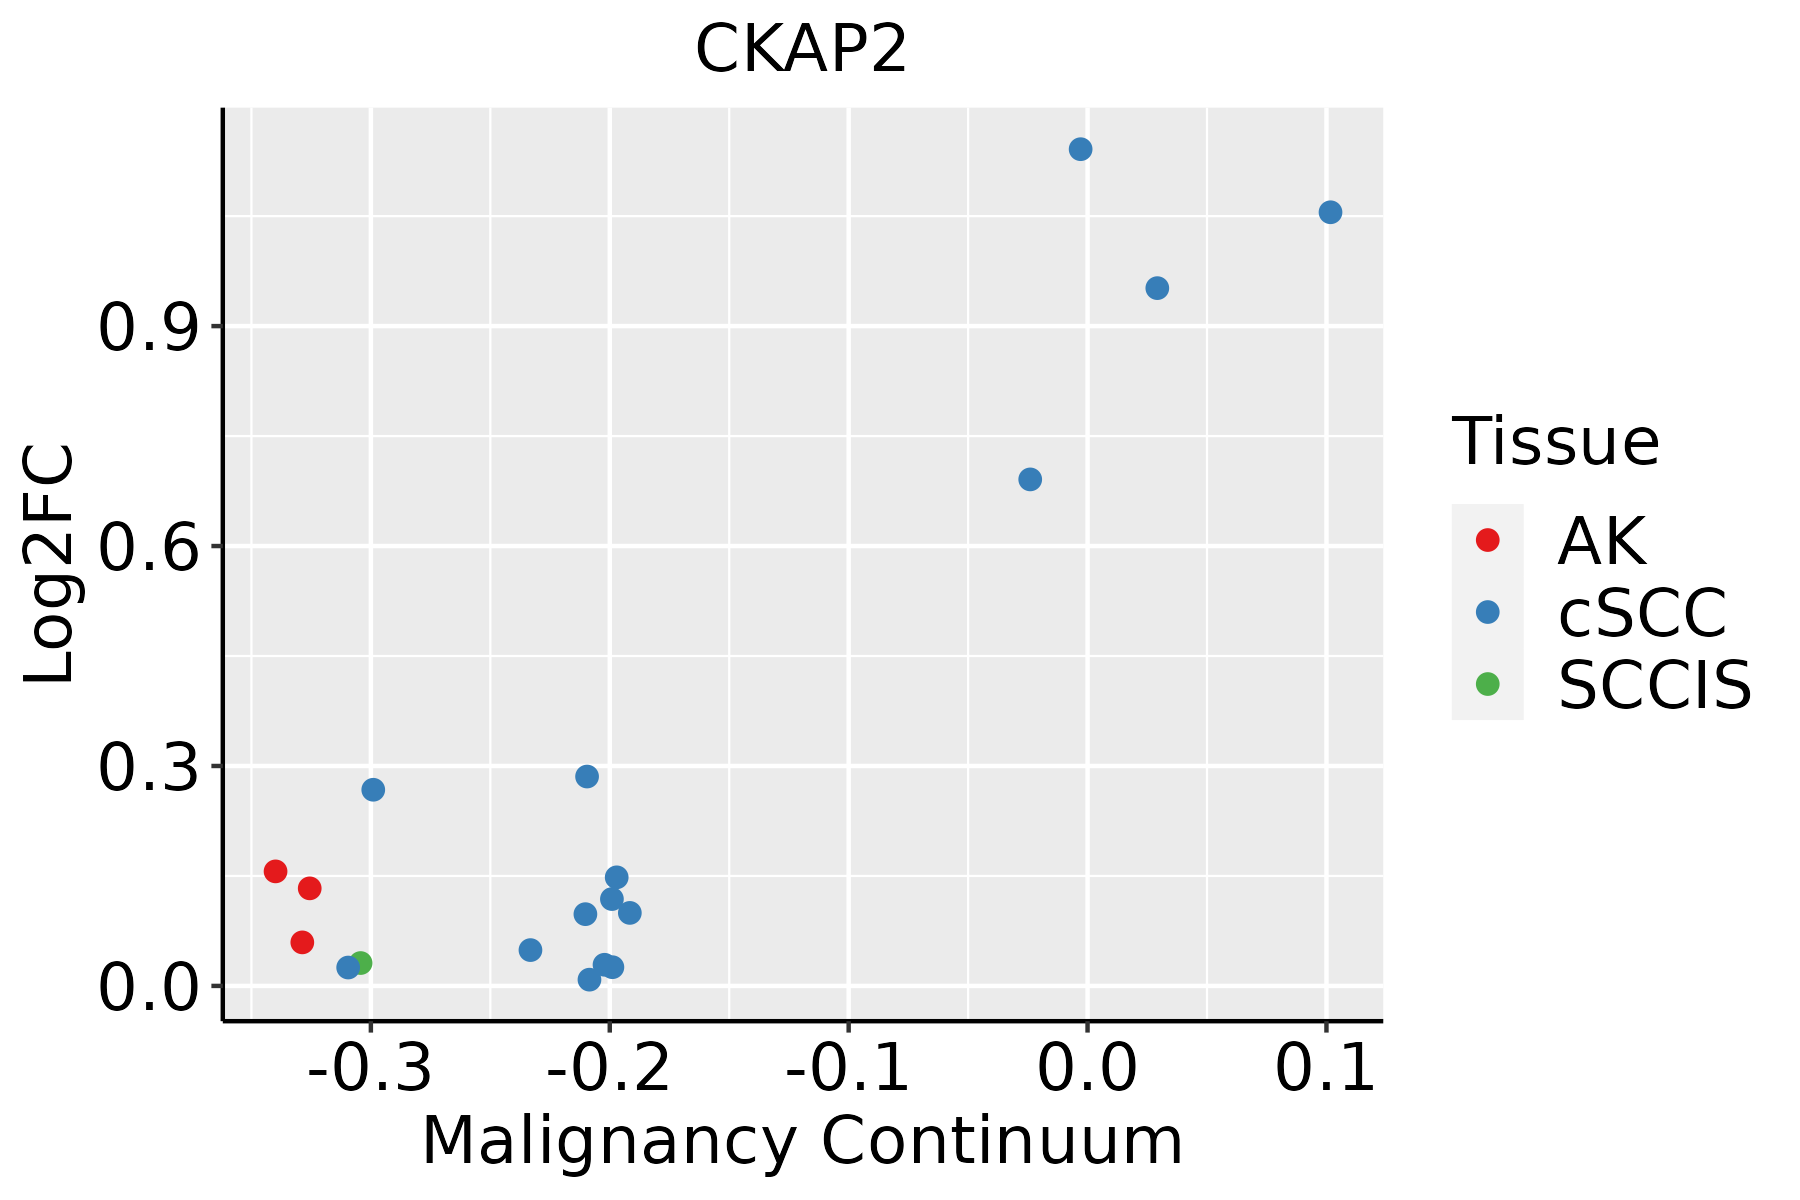
AK: Actinic keratosis
cSCC: Cutaneous squamous cell carcinoma
SCCIS:squamous cell carcinoma in situ
ThyroidThe image shows the transcriptomic changes along malignancy continuum.log2FC in expression of this searched gene in stem-like cells from each diseased tissue sample relative to stem-like cells in normal samples in each tissue plotted against the malignancy continuum. Samples are colored based on if they are from different disease stage.ATC: Anaplastic thyroid cancer
HT: Hashimoto's thyroiditis
PTC: Papillary thyroid cancer
∗log2FC in expression of this searched gene in stem-like cells from each diseased tissue sample relative to stem-like cells in normal samples in each tissue plotted against the malignancy continuum. Samples are colored based on if they are from different disease stage.

Top

Malignant transformation related pathway analysis

check buttonFind out the enriched GO biological processes and KEGG pathways involved in transition from healthy to precancer to cancer
check button Figure of enriched GO biological processes.
TissueDisease StageEnriched GO biological Processes
ColorectumADGO analysis - Figure of enriched GO biological processes: Top 15 enriched GO BP terms are showed in the bar plot of each disease state in each tissue. Each row represents a significant GO biological process which is colored according to the -log10(p.adjust).
ColorectumSERGO analysis - Figure of enriched GO biological processes: Top 15 enriched GO BP terms are showed in the bar plot of each disease state in each tissue. Each row represents a significant GO biological process which is colored according to the -log10(p.adjust).
ColorectumMSSGO analysis - Figure of enriched GO biological processes: Top 15 enriched GO BP terms are showed in the bar plot of each disease state in each tissue. Each row represents a significant GO biological process which is colored according to the -log10(p.adjust).
ColorectumMSI-HGO analysis - Figure of enriched GO biological processes: Top 15 enriched GO BP terms are showed in the bar plot of each disease state in each tissue. Each row represents a significant GO biological process which is colored according to the -log10(p.adjust).
ColorectumFAPGO analysis - Figure of enriched GO biological processes: Top 15 enriched GO BP terms are showed in the bar plot of each disease state in each tissue. Each row represents a significant GO biological process which is colored according to the -log10(p.adjust).
∗Top 15 enriched GO BP terms are showed in the bar plot of each disease state in each tissue. Each row represents a significant GO biological process which is colored according to the -log10(p.adjust).
Page: 1 2 3 4 5 6 7 8 9 

check button Enriched GO biological processes.
GO IDTissueDisease StageDescriptionGene RatioBg Ratiopvaluep.adjustCount
GO:0022411111EsophagusESCCcellular component disassembly305/8552443/187231.94e-234.57e-21305
GO:003298416EsophagusESCCprotein-containing complex disassembly151/8552224/187233.45e-111.15e-09151
GO:1902903111EsophagusESCCregulation of supramolecular fiber organization237/8552383/187239.06e-112.75e-09237
GO:000028115EsophagusESCCmitotic cytokinesis58/855271/187234.34e-101.15e-0858
GO:0010639110EsophagusESCCnegative regulation of organelle organization215/8552348/187238.20e-102.01e-08215
GO:000091016EsophagusESCCcytokinesis115/8552173/187232.48e-084.68e-07115
GO:006164015EsophagusESCCcytoskeleton-dependent cytokinesis72/8552100/187238.10e-081.39e-0672
GO:00705078EsophagusESCCregulation of microtubule cytoskeleton organization99/8552148/187231.43e-072.29e-0699
GO:00311094EsophagusESCCmicrotubule polymerization or depolymerization77/8552122/187237.60e-055.68e-0477
GO:00432446EsophagusESCCregulation of protein-containing complex disassembly75/8552121/187232.17e-041.36e-0375
GO:00311104EsophagusESCCregulation of microtubule polymerization or depolymerization57/855288/187232.32e-041.44e-0357
GO:00328864EsophagusESCCregulation of microtubule-based process134/8552240/187239.44e-044.80e-03134
GO:00436245EsophagusESCCcellular protein complex disassembly78/8552136/187234.00e-031.62e-0278
GO:002241112LiverHCCcellular component disassembly282/7958443/187231.02e-191.38e-17282
GO:190290322LiverHCCregulation of supramolecular fiber organization224/7958383/187231.54e-105.33e-09224
GO:001063912LiverHCCnegative regulation of organelle organization204/7958348/187237.67e-102.37e-08204
GO:003298411LiverHCCprotein-containing complex disassembly138/7958224/187235.59e-091.46e-07138
GO:000028111LiverHCCmitotic cytokinesis51/795871/187235.20e-078.38e-0651
GO:007050711LiverHCCregulation of microtubule cytoskeleton organization88/7958148/187232.28e-052.41e-0488
GO:000091011LiverHCCcytokinesis100/7958173/187233.38e-053.39e-04100
Page: 1 2 3 4 5 6 

check button Enriched KEGG pathways.
Pathway IDTissueDisease StageDescriptionGene RatioBg Ratiopvaluep.adjustqvalueCount
Page: 1 

Top

Cell-cell communication analysis

check buttonIdentification of potential cell-cell interactions between two cell types and their ligand-receptor pairs for different disease states
LigandReceptorLRpairPathwayTissueDisease Stage
Page: 1 

Top

Single-cell gene regulatory network inference analysis

check buttonFind out the significant the regulons (TFs) and the target genes of each regulon across cell types for different disease states
TFCell TypeTissueDisease StageTarget GeneRSSRegulon Activity
∗The dot plots of a searched regulon are shown for all cell subpopulations in each disease state of each tissue based on the regulon specific score inferred using pySCENIC and by calculating the average expression.
Page: 1 

Top

Somatic mutation of malignant transformation related genes

check buttonAnnotation of somatic variants for genes involved in malignant transformation
Hugo SymbolVariant ClassVariant ClassificationdbSNP RSHGVScHGVSpHGVSp ShortSWISSPROTBIOTYPESIFTPolyPhenTumor Sample BarcodeTissueHistologySexAgeStageTherapy TypesDrugsOutcome
CKAP2SNVMissense_Mutationnovelc.1303N>Gp.Asn435Aspp.N435DQ8WWK9protein_codingtolerated(0.13)possibly_damaging(0.616)TCGA-A2-A0CP-01Breastbreast invasive carcinomaFemale<65I/IIChemotherapycytoxanSD
CKAP2SNVMissense_Mutationrs775705785c.383C>Tp.Pro128Leup.P128LQ8WWK9protein_codingtolerated(1)benign(0)TCGA-A2-A3KC-01Breastbreast invasive carcinomaFemale<65I/IIChemotherapyadriamycinSD
CKAP2SNVMissense_Mutationnovelc.1739C>Ap.Pro580Hisp.P580HQ8WWK9protein_codingdeleterious(0)probably_damaging(0.983)TCGA-A8-A07J-01Breastbreast invasive carcinomaFemale<65I/IIChemotherapy5-fluorouracilCR
CKAP2SNVMissense_Mutationnovelc.304N>Tp.Pro102Serp.P102SQ8WWK9protein_codingtolerated(0.16)probably_damaging(0.998)TCGA-AO-A0JC-01Breastbreast invasive carcinomaFemale<65I/IIChemotherapyfluorouracilSD
CKAP2SNVMissense_Mutationc.1914N>Tp.Leu638Phep.L638FQ8WWK9protein_codingdeleterious(0)probably_damaging(0.987)TCGA-AQ-A0Y5-01Breastbreast invasive carcinomaFemale>=65III/IVChemotherapycytoxanSD
CKAP2SNVMissense_Mutationc.638N>Ap.Pro213Hisp.P213HQ8WWK9protein_codingdeleterious(0.04)possibly_damaging(0.724)TCGA-BH-A0C0-01Breastbreast invasive carcinomaFemale<65I/IIChemotherapycarboplatinSD
CKAP2SNVMissense_Mutationnovelc.1390T>Cp.Trp464Argp.W464RQ8WWK9protein_codingdeleterious(0)probably_damaging(0.999)TCGA-BH-A0HA-01Breastbreast invasive carcinomaFemale<65I/IIUnknownUnknownSD
CKAP2SNVMissense_Mutationc.1658N>Gp.Leu553Argp.L553RQ8WWK9protein_codingtolerated(0.46)benign(0)TCGA-C8-A133-01Breastbreast invasive carcinomaFemale>=65III/IVUnknownUnknownSD
CKAP2SNVMissense_Mutationc.1516N>Gp.Leu506Valp.L506VQ8WWK9protein_codingdeleterious(0.01)benign(0.415)TCGA-C8-A26V-01Breastbreast invasive carcinomaFemale<65III/IVHormone TherapytamoxiphenCR
CKAP2SNVMissense_Mutationnovelc.902A>Gp.Lys301Argp.K301RQ8WWK9protein_codingdeleterious(0.03)possibly_damaging(0.864)TCGA-S3-AA11-01Breastbreast invasive carcinomaFemale>=65I/IIHormone TherapyletrozoleCR
Page: 1 2 3 4 5 6 7 8 

Top

Related drugs of malignant transformation related genes

check buttonIdentification of chemicals and drugs interact with genes involved in malignant transfromation
(DGIdb 4.0)
Entrez IDSymbolCategoryInteraction TypesDrug Claim NameDrug NamePMIDs
Page: 1