
|
|||||
|
 | |
| |
| |
| |
| |
| |
|
Gene: CITED4 |
Gene summary for CITED4 |
| Gene information | Species | Human | Gene symbol | CITED4 | Gene ID | 163732 |
| Gene name | Cbp/p300 interacting transactivator with Glu/Asp rich carboxy-terminal domain 4 | |
| Gene Alias | CITED4 | |
| Cytomap | 1p34.2 | |
| Gene Type | protein-coding | GO ID | GO:0006139 | UniProtAcc | Q96RK1 |
Top |
Malignant transformation analysis |
| Identification of the aberrant gene expression in precancerous and cancerous lesions by comparing the gene expression of stem-like cells in diseased tissues with normal stem cells |
| Entrez ID | Symbol | Replicates | Species | Organ | Tissue | Adj P-value | Log2FC | Malignancy |
| 163732 | CITED4 | GSM4909281 | Human | Breast | IDC | 4.65e-13 | -4.53e-01 | 0.21 |
| 163732 | CITED4 | GSM4909282 | Human | Breast | IDC | 6.92e-03 | 2.69e-01 | -0.0288 |
| 163732 | CITED4 | GSM4909285 | Human | Breast | IDC | 4.00e-14 | -4.57e-01 | 0.21 |
| 163732 | CITED4 | GSM4909286 | Human | Breast | IDC | 1.52e-05 | 1.40e-01 | 0.1081 |
| 163732 | CITED4 | GSM4909290 | Human | Breast | IDC | 1.04e-14 | -4.79e-01 | 0.2096 |
| 163732 | CITED4 | GSM4909291 | Human | Breast | IDC | 2.08e-09 | -4.70e-01 | 0.1753 |
| 163732 | CITED4 | GSM4909294 | Human | Breast | IDC | 7.18e-07 | -4.04e-01 | 0.2022 |
| 163732 | CITED4 | GSM4909296 | Human | Breast | IDC | 9.09e-06 | -3.75e-01 | 0.1524 |
| 163732 | CITED4 | GSM4909297 | Human | Breast | IDC | 1.06e-17 | -4.61e-01 | 0.1517 |
| 163732 | CITED4 | GSM4909300 | Human | Breast | IDC | 1.37e-02 | -4.10e-01 | 0.0334 |
| 163732 | CITED4 | GSM4909301 | Human | Breast | IDC | 3.64e-17 | -4.68e-01 | 0.1577 |
| 163732 | CITED4 | GSM4909304 | Human | Breast | IDC | 9.78e-07 | 2.75e-01 | 0.1636 |
| 163732 | CITED4 | GSM4909306 | Human | Breast | IDC | 4.84e-04 | -3.69e-01 | 0.1564 |
| 163732 | CITED4 | GSM4909307 | Human | Breast | IDC | 5.82e-07 | -3.94e-01 | 0.1569 |
| 163732 | CITED4 | GSM4909308 | Human | Breast | IDC | 6.19e-12 | -4.50e-01 | 0.158 |
| 163732 | CITED4 | GSM4909309 | Human | Breast | IDC | 5.29e-07 | -3.92e-01 | 0.0483 |
| 163732 | CITED4 | GSM4909311 | Human | Breast | IDC | 3.86e-11 | -3.93e-01 | 0.1534 |
| 163732 | CITED4 | GSM4909312 | Human | Breast | IDC | 4.35e-15 | -4.46e-01 | 0.1552 |
| 163732 | CITED4 | GSM4909315 | Human | Breast | IDC | 3.19e-06 | -3.74e-01 | 0.21 |
| 163732 | CITED4 | GSM4909319 | Human | Breast | IDC | 3.63e-16 | -3.98e-01 | 0.1563 |
| Page: 1 2 3 4 5 6 7 8 |
| Tissue | Expression Dynamics | Abbreviation |
| Breast | 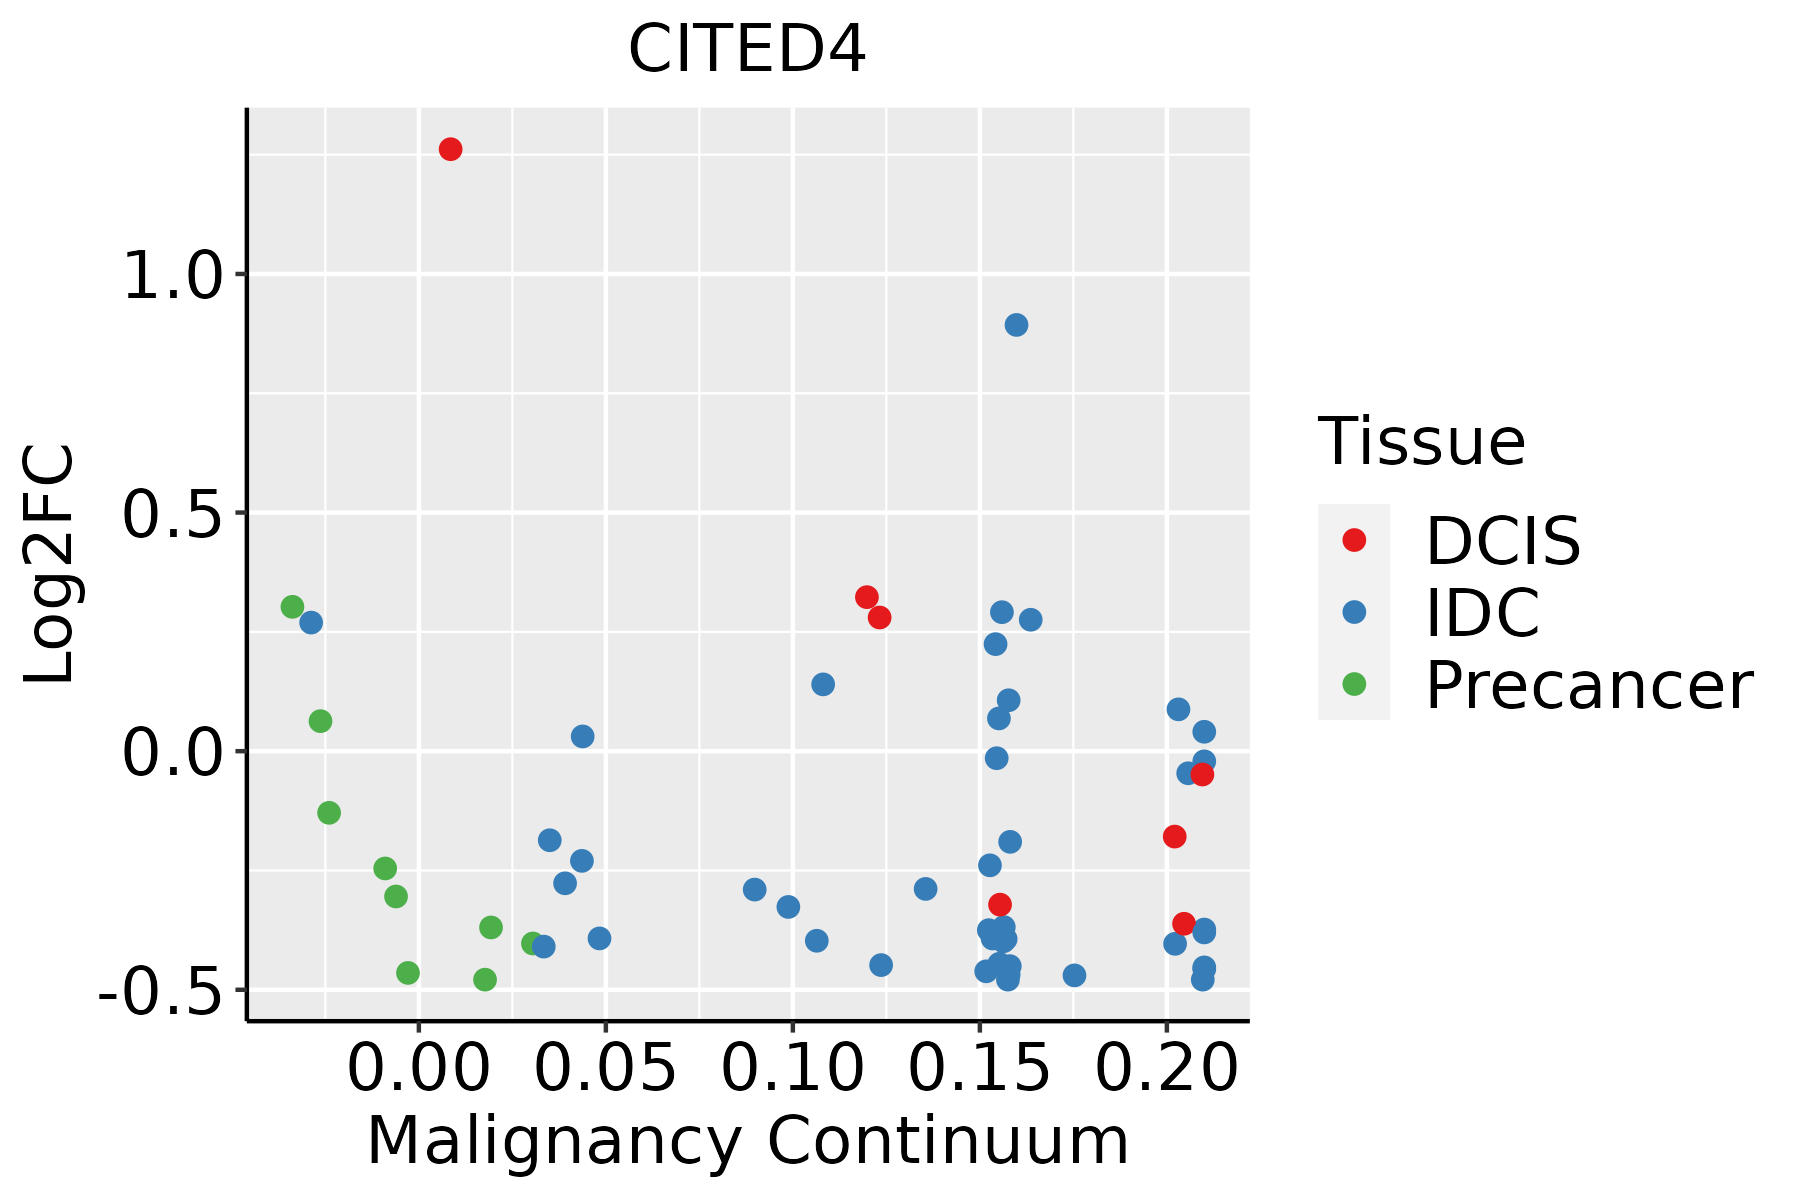 | IDC: Invasive ductal carcinoma |
| DCIS: Ductal carcinoma in situ | ||
| Precancer(BRCA1-mut): Precancerous lesion from BRCA1 mutation carriers | ||
| Endometrium |  | AEH: Atypical endometrial hyperplasia |
| EEC: Endometrioid Cancer | ||
| Esophagus |  | ESCC: Esophageal squamous cell carcinoma |
| HGIN: High-grade intraepithelial neoplasias | ||
| LGIN: Low-grade intraepithelial neoplasias | ||
| Liver |  | HCC: Hepatocellular carcinoma |
| NAFLD: Non-alcoholic fatty liver disease | ||
| Oral Cavity |  | EOLP: Erosive Oral lichen planus |
| LP: leukoplakia | ||
| NEOLP: Non-erosive oral lichen planus | ||
| OSCC: Oral squamous cell carcinoma | ||
| Prostate | 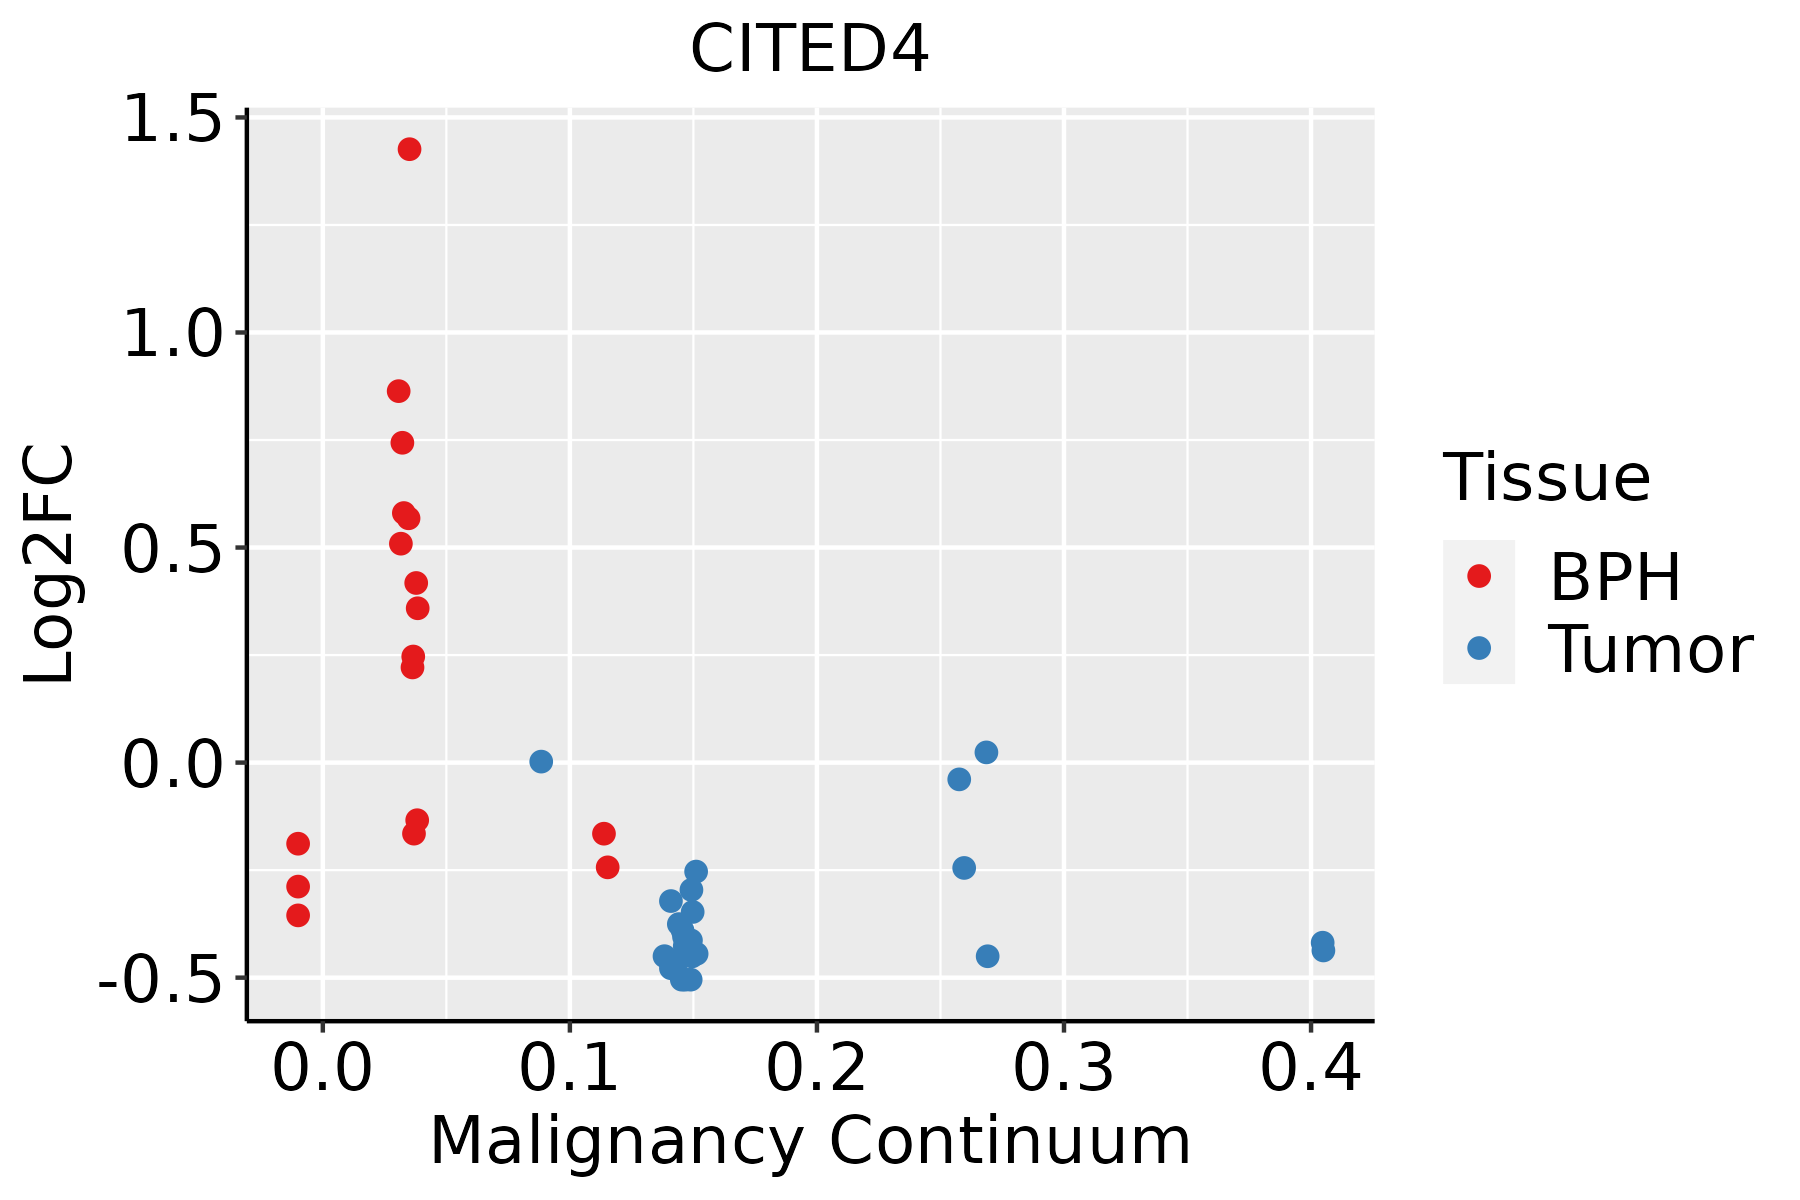 | BPH: Benign Prostatic Hyperplasia |
| Skin |  | AK: Actinic keratosis |
| cSCC: Cutaneous squamous cell carcinoma | ||
| SCCIS:squamous cell carcinoma in situ | ||
| Thyroid | 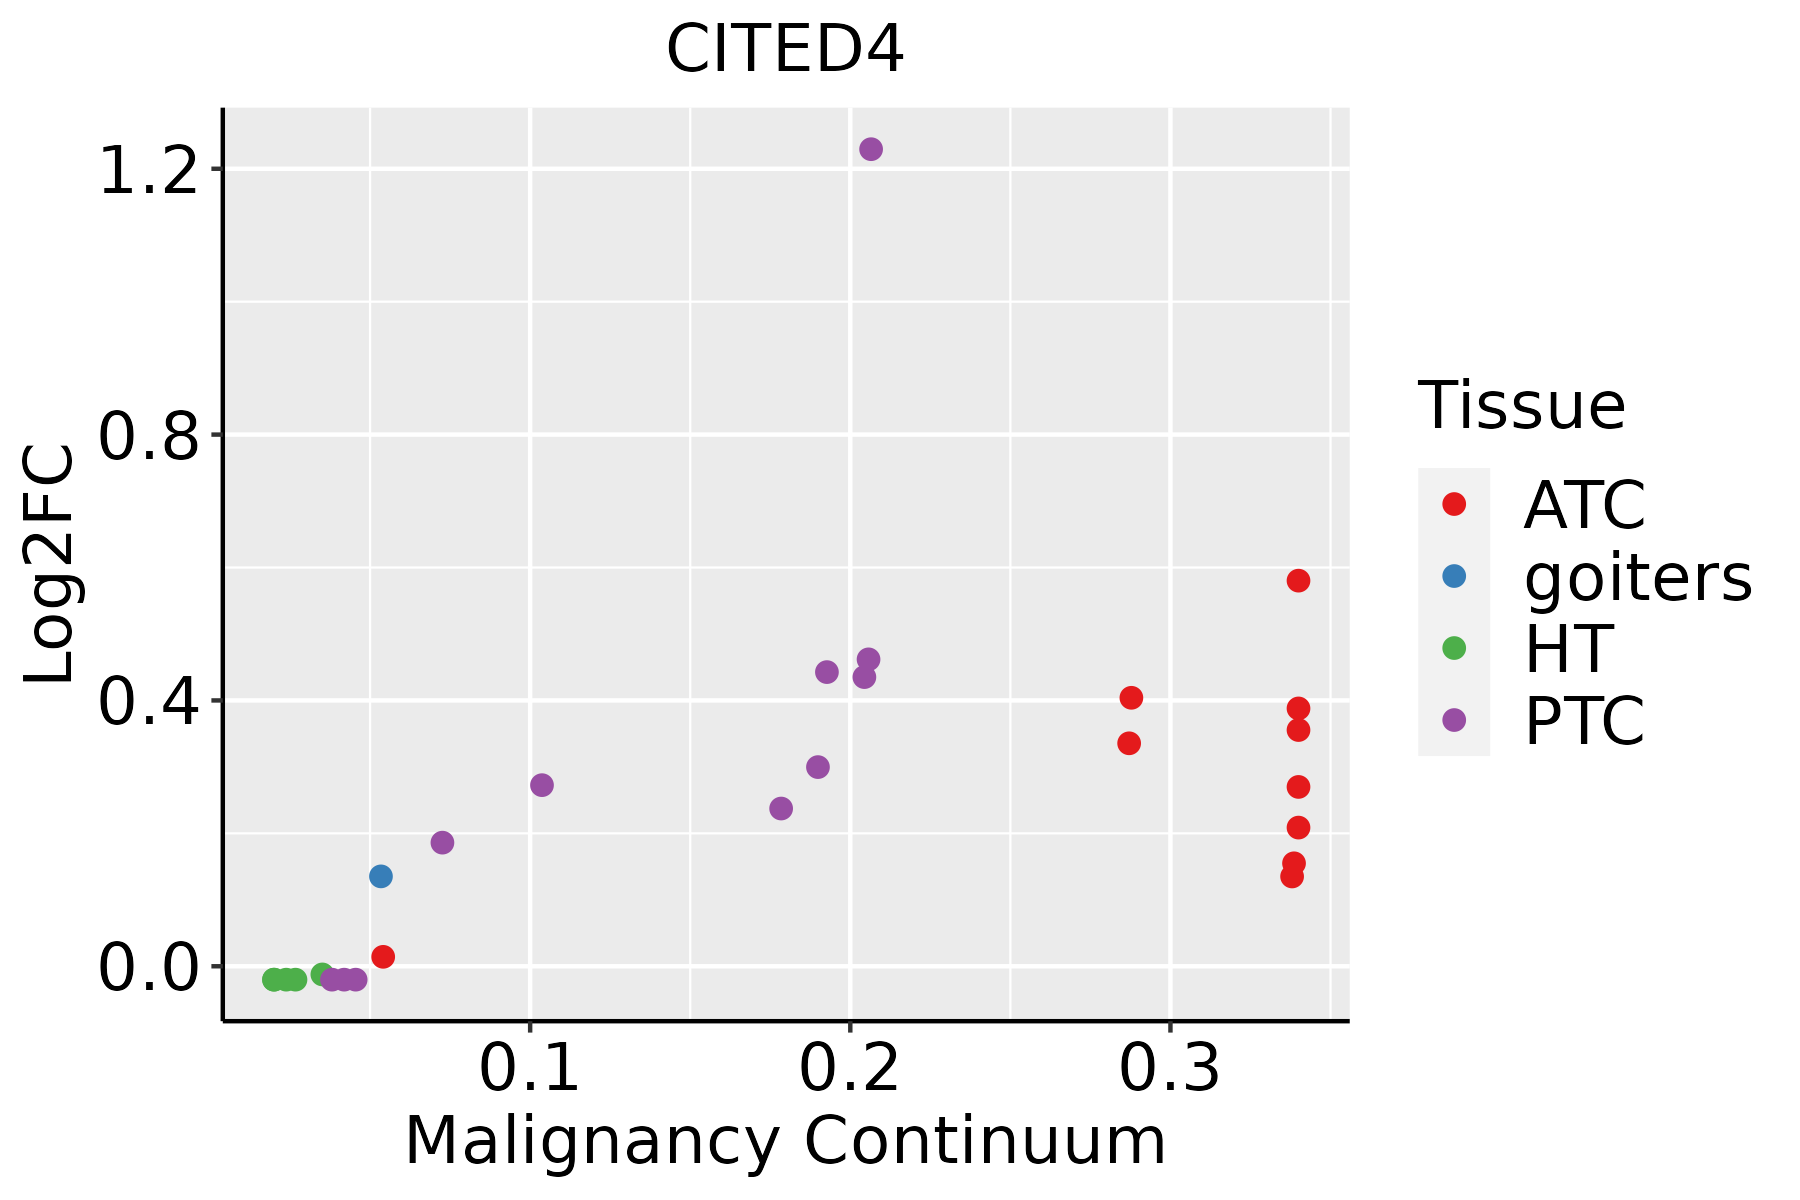 | ATC: Anaplastic thyroid cancer |
| HT: Hashimoto's thyroiditis | ||
| PTC: Papillary thyroid cancer |
| ∗log2FC in expression of this searched gene in stem-like cells from each diseased tissue sample relative to stem-like cells in normal samples in each tissue plotted against the malignancy continuum. Samples are colored based on if they are from different disease stage. |
Top |
Malignant transformation related pathway analysis |
| Find out the enriched GO biological processes and KEGG pathways involved in transition from healthy to precancer to cancer |
| Tissue | Disease Stage | Enriched GO biological Processes |
| Colorectum | AD |  |
| Colorectum | SER |  |
| Colorectum | MSS |  |
| Colorectum | MSI-H |  |
| Colorectum | FAP |  |
| ∗Top 15 enriched GO BP terms are showed in the bar plot of each disease state in each tissue. Each row represents a significant GO biological process which is colored according to the -log10(p.adjust). |
| Page: 1 2 3 4 5 6 7 8 9 |
| GO ID | Tissue | Disease Stage | Description | Gene Ratio | Bg Ratio | pvalue | p.adjust | Count |
| GO:00436273 | Breast | Precancer | response to estrogen | 15/1080 | 75/18723 | 2.06e-05 | 4.83e-04 | 15 |
| GO:004362711 | Breast | IDC | response to estrogen | 17/1434 | 75/18723 | 4.05e-05 | 9.25e-04 | 17 |
| GO:00436272 | Breast | DCIS | response to estrogen | 16/1390 | 75/18723 | 1.01e-04 | 1.84e-03 | 16 |
| GO:00436275 | Esophagus | ESCC | response to estrogen | 45/8552 | 75/18723 | 8.75e-03 | 3.08e-02 | 45 |
| GO:0043627 | Liver | Cirrhotic | response to estrogen | 30/4634 | 75/18723 | 2.52e-03 | 1.51e-02 | 30 |
| GO:00436271 | Liver | HCC | response to estrogen | 44/7958 | 75/18723 | 3.44e-03 | 1.55e-02 | 44 |
| GO:00436274 | Prostate | BPH | response to estrogen | 21/3107 | 75/18723 | 8.97e-03 | 3.83e-02 | 21 |
| GO:00436276 | Skin | AK | response to estrogen | 15/1910 | 75/18723 | 8.02e-03 | 4.05e-02 | 15 |
| Page: 1 |
| Pathway ID | Tissue | Disease Stage | Description | Gene Ratio | Bg Ratio | pvalue | p.adjust | qvalue | Count |
| Page: 1 |
Top |
Cell-cell communication analysis |
| Identification of potential cell-cell interactions between two cell types and their ligand-receptor pairs for different disease states |
| Ligand | Receptor | LRpair | Pathway | Tissue | Disease Stage |
| Page: 1 |
Top |
Single-cell gene regulatory network inference analysis |
| Find out the significant the regulons (TFs) and the target genes of each regulon across cell types for different disease states |
| TF | Cell Type | Tissue | Disease Stage | Target Gene | RSS | Regulon Activity |
| ∗The dot plots of a searched regulon are shown for all cell subpopulations in each disease state of each tissue based on the regulon specific score inferred using pySCENIC and by calculating the average expression. |
| Page: 1 |
Top |
Somatic mutation of malignant transformation related genes |
| Annotation of somatic variants for genes involved in malignant transformation |
| Hugo Symbol | Variant Class | Variant Classification | dbSNP RS | HGVSc | HGVSp | HGVSp Short | SWISSPROT | BIOTYPE | SIFT | PolyPhen | Tumor Sample Barcode | Tissue | Histology | Sex | Age | Stage | Therapy Types | Drugs | Outcome |
| Page: 1 |
Top |
Related drugs of malignant transformation related genes |
| Identification of chemicals and drugs interact with genes involved in malignant transfromation |
| (DGIdb 4.0) |
| Entrez ID | Symbol | Category | Interaction Types | Drug Claim Name | Drug Name | PMIDs |
| Page: 1 |

Copyright 2023-Present -The University of Texas Health Science Center at Houston |