
|
|||||
|
 | |
| |
| |
| |
| |
| |
|
Gene: CISD3 |
Gene summary for CISD3 |
| Gene information | Species | Human | Gene symbol | CISD3 | Gene ID | 284106 |
| Gene name | CDGSH iron sulfur domain 3 | |
| Gene Alias | MiNT | |
| Cytomap | 17q12 | |
| Gene Type | protein-coding | GO ID | GO:0006807 | UniProtAcc | P0C7P0 |
Top |
Malignant transformation analysis |
| Identification of the aberrant gene expression in precancerous and cancerous lesions by comparing the gene expression of stem-like cells in diseased tissues with normal stem cells |
| Entrez ID | Symbol | Replicates | Species | Organ | Tissue | Adj P-value | Log2FC | Malignancy |
| 284106 | CISD3 | GSM4909286 | Human | Breast | IDC | 3.90e-03 | 1.58e-01 | 0.1081 |
| 284106 | CISD3 | GSM4909290 | Human | Breast | IDC | 2.20e-96 | 1.42e+00 | 0.2096 |
| 284106 | CISD3 | GSM4909292 | Human | Breast | IDC | 3.16e-02 | 4.96e-01 | 0.1236 |
| 284106 | CISD3 | GSM4909293 | Human | Breast | IDC | 4.02e-93 | 1.33e+00 | 0.1581 |
| 284106 | CISD3 | GSM4909294 | Human | Breast | IDC | 1.19e-04 | 3.75e-01 | 0.2022 |
| 284106 | CISD3 | GSM4909298 | Human | Breast | IDC | 8.63e-03 | 1.86e-01 | 0.1551 |
| 284106 | CISD3 | GSM4909301 | Human | Breast | IDC | 2.63e-15 | 5.71e-01 | 0.1577 |
| 284106 | CISD3 | GSM4909302 | Human | Breast | IDC | 5.49e-07 | 3.22e-01 | 0.1545 |
| 284106 | CISD3 | GSM4909304 | Human | Breast | IDC | 3.17e-06 | 2.98e-01 | 0.1636 |
| 284106 | CISD3 | GSM4909306 | Human | Breast | IDC | 1.52e-12 | 4.26e-01 | 0.1564 |
| 284106 | CISD3 | GSM4909308 | Human | Breast | IDC | 1.15e-08 | 3.78e-01 | 0.158 |
| 284106 | CISD3 | GSM4909311 | Human | Breast | IDC | 6.55e-11 | 8.76e-02 | 0.1534 |
| 284106 | CISD3 | GSM4909312 | Human | Breast | IDC | 9.53e-04 | 2.15e-01 | 0.1552 |
| 284106 | CISD3 | GSM4909316 | Human | Breast | IDC | 1.14e-02 | 1.35e-01 | 0.21 |
| 284106 | CISD3 | GSM4909319 | Human | Breast | IDC | 3.98e-23 | 2.71e-01 | 0.1563 |
| 284106 | CISD3 | GSM4909320 | Human | Breast | IDC | 8.84e-09 | 3.09e-01 | 0.1575 |
| 284106 | CISD3 | GSM4909321 | Human | Breast | IDC | 1.05e-10 | 3.93e-01 | 0.1559 |
| 284106 | CISD3 | brca1 | Human | Breast | Precancer | 2.96e-05 | 2.47e-01 | -0.0338 |
| 284106 | CISD3 | brca2 | Human | Breast | Precancer | 2.01e-03 | 2.03e-01 | -0.024 |
| 284106 | CISD3 | NCCBC11 | Human | Breast | DCIS | 4.76e-02 | 1.73e-01 | 0.1232 |
| Page: 1 2 3 4 5 6 7 8 9 10 |
| Tissue | Expression Dynamics | Abbreviation |
| Breast | 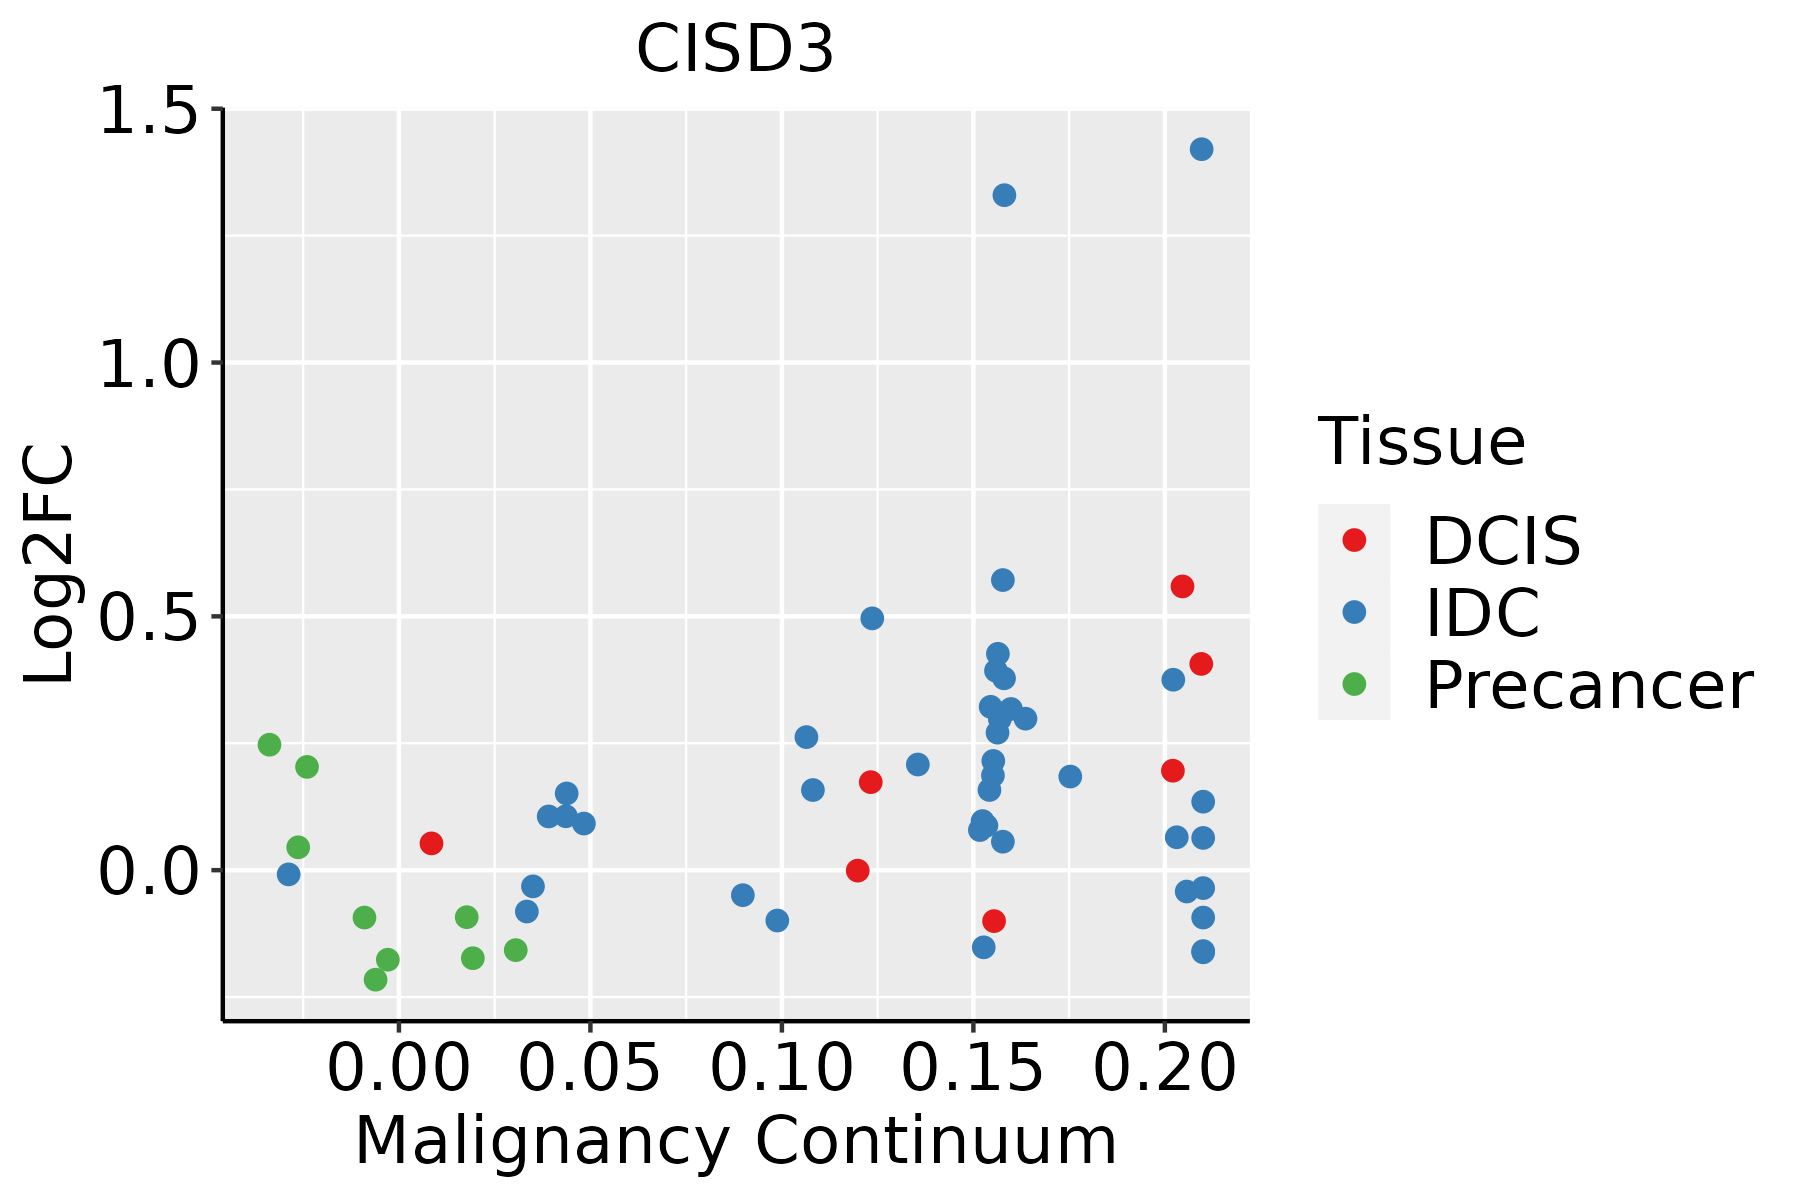 | IDC: Invasive ductal carcinoma |
| DCIS: Ductal carcinoma in situ | ||
| Precancer(BRCA1-mut): Precancerous lesion from BRCA1 mutation carriers | ||
| Colorectum (GSE201348) |  | FAP: Familial adenomatous polyposis |
| CRC: Colorectal cancer | ||
| Colorectum (HTA11) |  | AD: Adenomas |
| SER: Sessile serrated lesions | ||
| MSI-H: Microsatellite-high colorectal cancer | ||
| MSS: Microsatellite stable colorectal cancer | ||
| Esophagus | 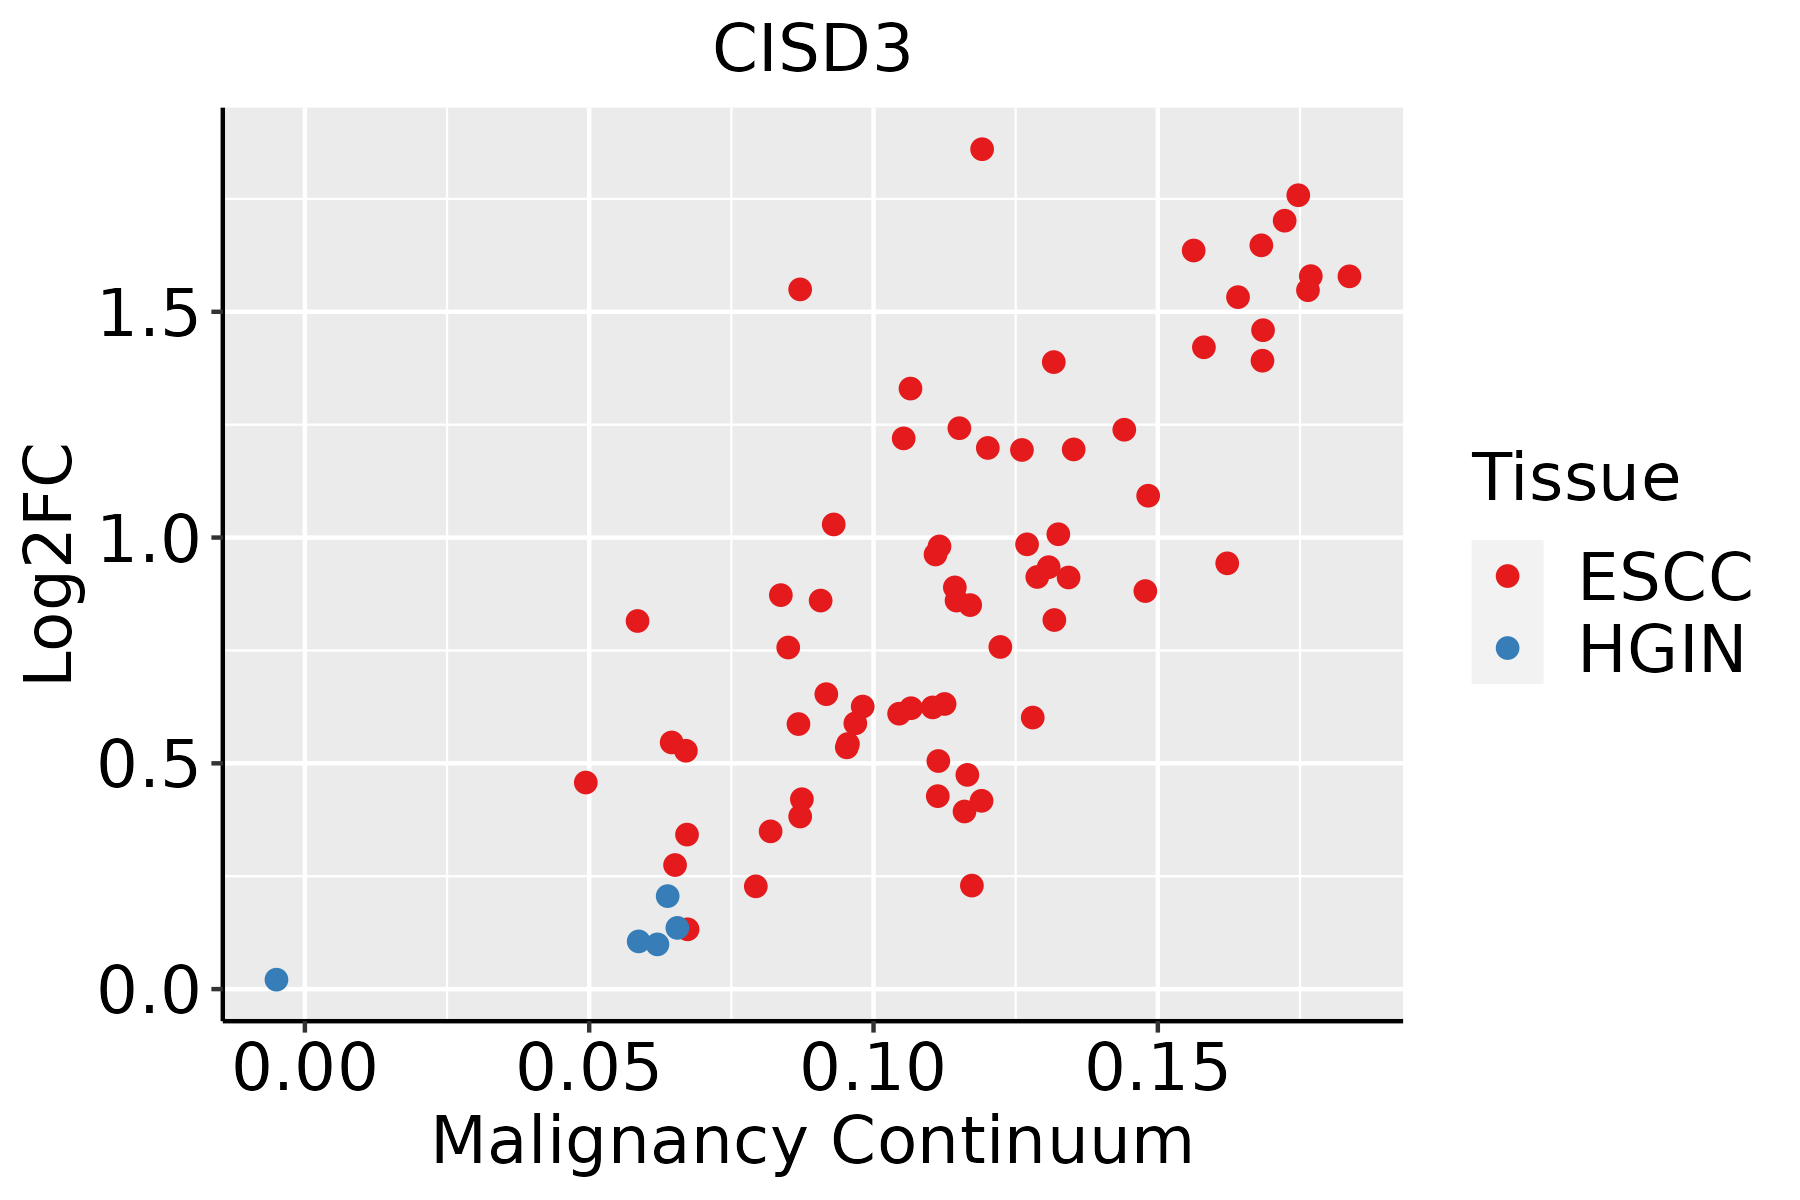 | ESCC: Esophageal squamous cell carcinoma |
| HGIN: High-grade intraepithelial neoplasias | ||
| LGIN: Low-grade intraepithelial neoplasias | ||
| GC | 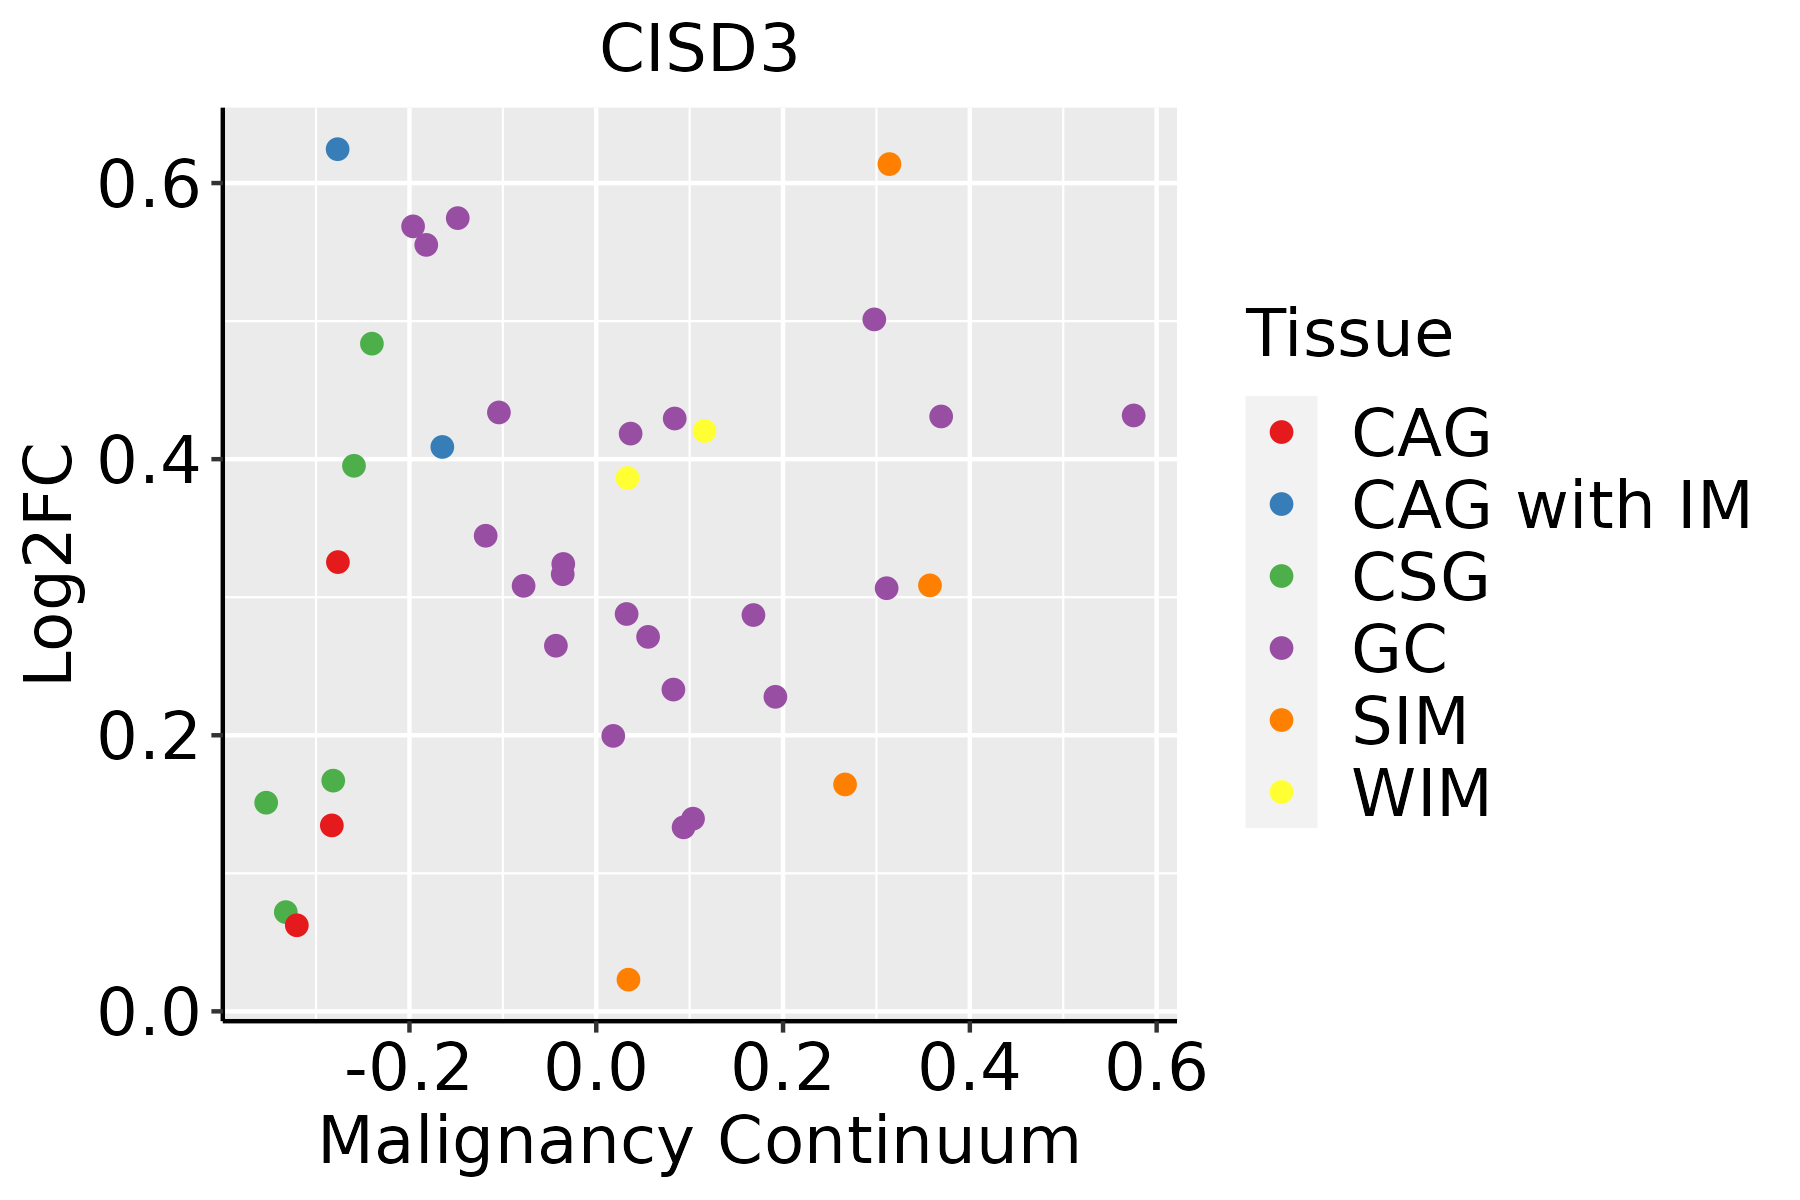 | CAG: Chronic atrophic gastritis |
| CAG with IM: Chronic atrophic gastritis with intestinal metaplasia | ||
| CSG: Chronic superficial gastritis | ||
| GC: Gastric cancer | ||
| SIM: Severe intestinal metaplasia | ||
| WIM: Wild intestinal metaplasia | ||
| Liver |  | HCC: Hepatocellular carcinoma |
| NAFLD: Non-alcoholic fatty liver disease | ||
| Oral Cavity | 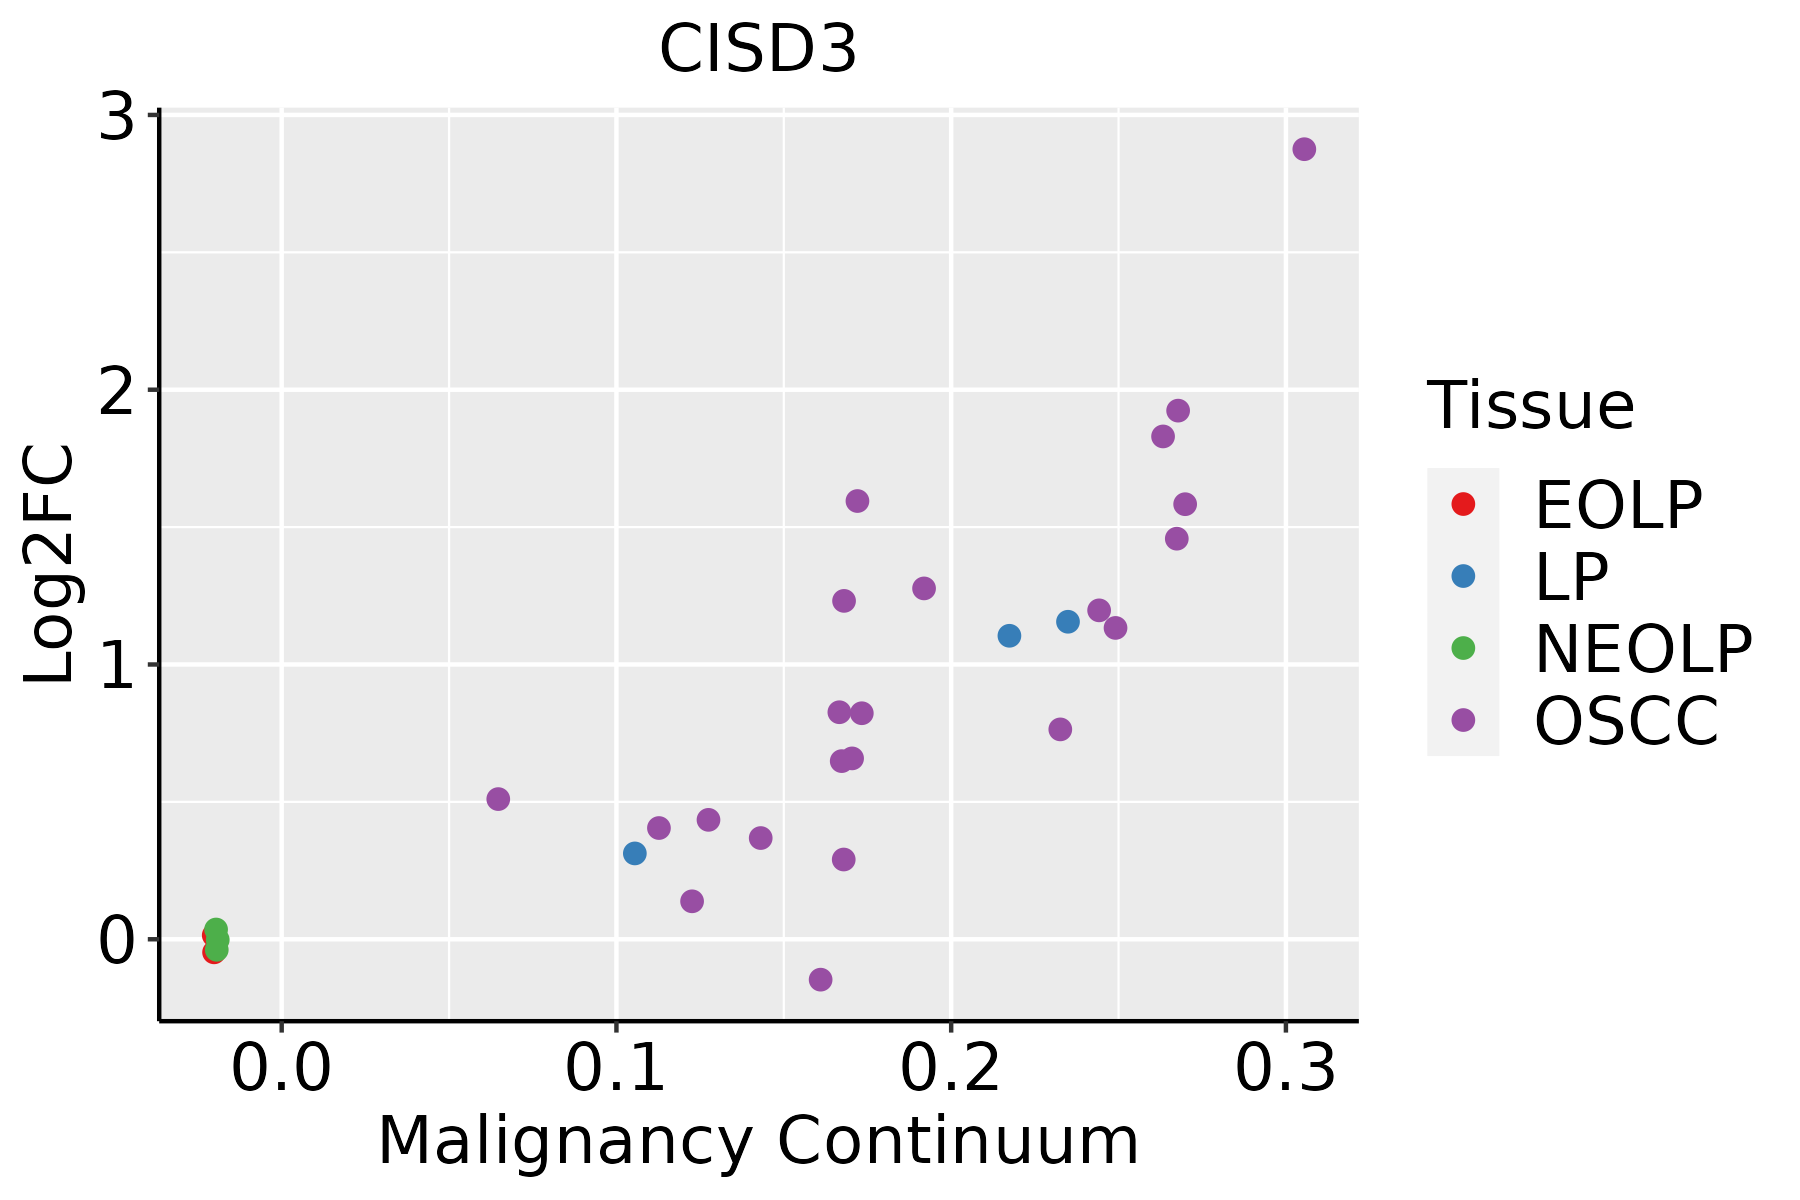 | EOLP: Erosive Oral lichen planus |
| LP: leukoplakia | ||
| NEOLP: Non-erosive oral lichen planus | ||
| OSCC: Oral squamous cell carcinoma | ||
| Prostate | 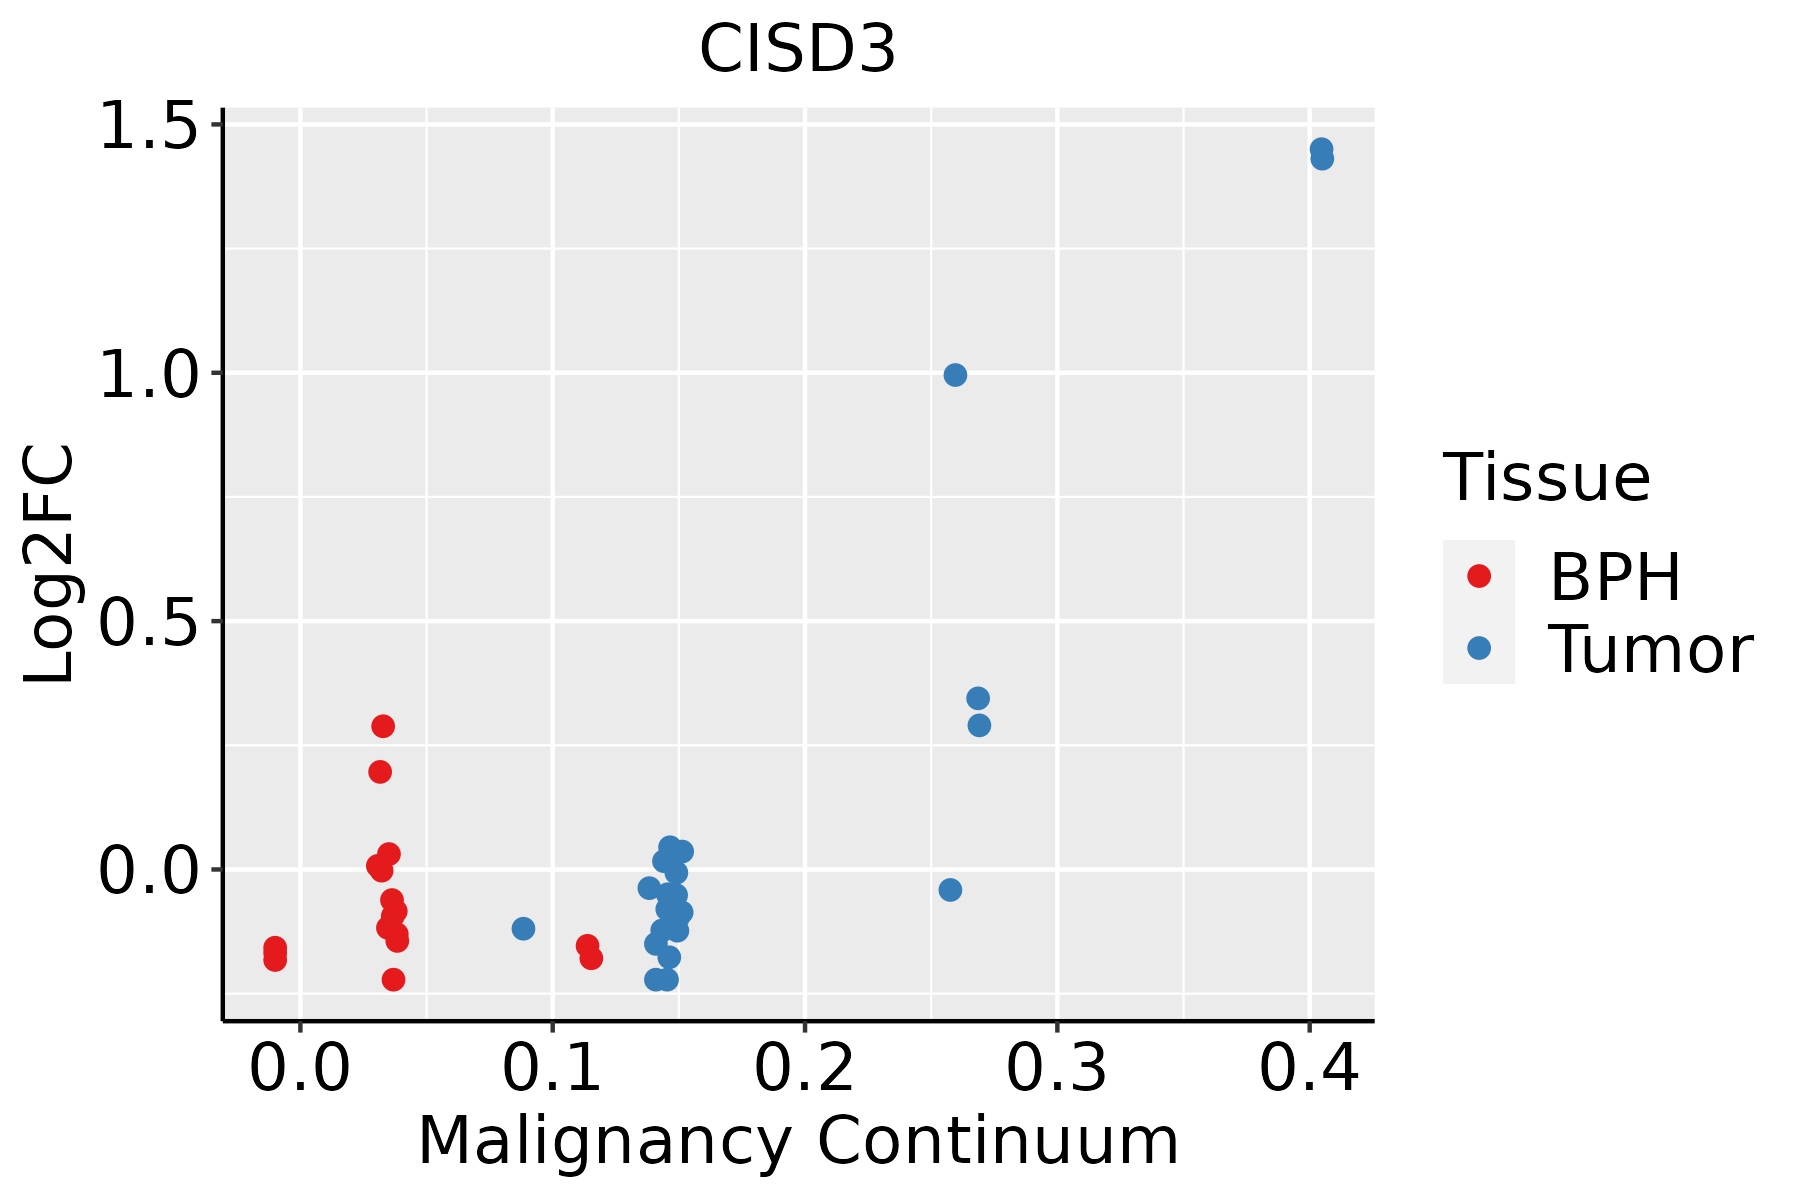 | BPH: Benign Prostatic Hyperplasia |
| Skin | 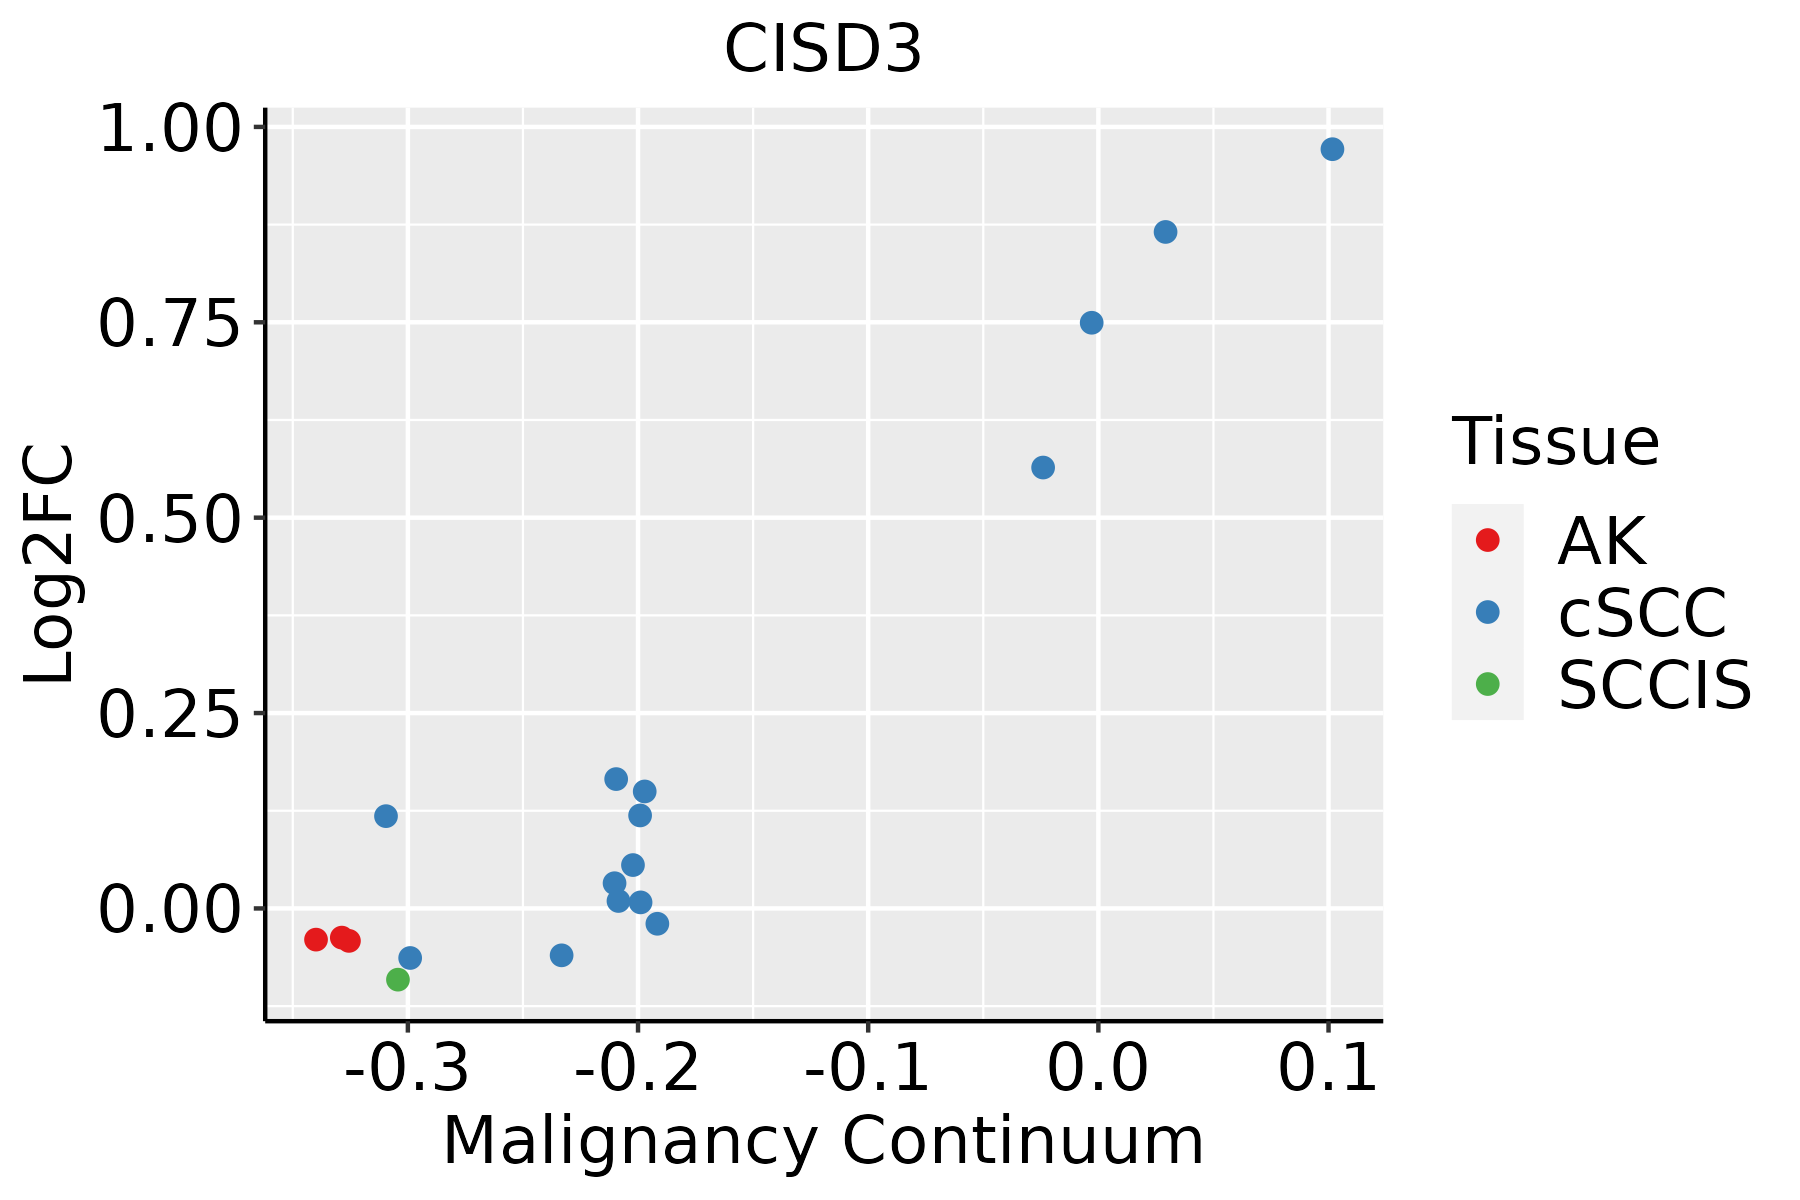 | AK: Actinic keratosis |
| cSCC: Cutaneous squamous cell carcinoma | ||
| SCCIS:squamous cell carcinoma in situ | ||
| Thyroid |  | ATC: Anaplastic thyroid cancer |
| HT: Hashimoto's thyroiditis | ||
| PTC: Papillary thyroid cancer |
| ∗log2FC in expression of this searched gene in stem-like cells from each diseased tissue sample relative to stem-like cells in normal samples in each tissue plotted against the malignancy continuum. Samples are colored based on if they are from different disease stage. |
Top |
Malignant transformation related pathway analysis |
| Find out the enriched GO biological processes and KEGG pathways involved in transition from healthy to precancer to cancer |
| Tissue | Disease Stage | Enriched GO biological Processes |
| Colorectum | AD |  |
| Colorectum | SER |  |
| Colorectum | MSS |  |
| Colorectum | MSI-H |  |
| Colorectum | FAP |  |
| ∗Top 15 enriched GO BP terms are showed in the bar plot of each disease state in each tissue. Each row represents a significant GO biological process which is colored according to the -log10(p.adjust). |
| Page: 1 2 3 4 5 6 7 8 9 |
| GO ID | Tissue | Disease Stage | Description | Gene Ratio | Bg Ratio | pvalue | p.adjust | Count |
| GO:00516047 | Breast | Precancer | protein maturation | 28/1080 | 294/18723 | 6.45e-03 | 4.50e-02 | 28 |
| GO:005160413 | Breast | IDC | protein maturation | 35/1434 | 294/18723 | 6.18e-03 | 4.40e-02 | 35 |
| GO:005160422 | Breast | DCIS | protein maturation | 34/1390 | 294/18723 | 6.72e-03 | 4.66e-02 | 34 |
| GO:0051604 | Colorectum | AD | protein maturation | 85/3918 | 294/18723 | 6.73e-04 | 6.91e-03 | 85 |
| GO:00516041 | Colorectum | SER | protein maturation | 73/2897 | 294/18723 | 1.82e-05 | 5.38e-04 | 73 |
| GO:00516042 | Colorectum | MSS | protein maturation | 75/3467 | 294/18723 | 1.70e-03 | 1.53e-02 | 75 |
| GO:005160418 | Esophagus | ESCC | protein maturation | 189/8552 | 294/18723 | 7.64e-11 | 2.39e-09 | 189 |
| GO:009742811 | Esophagus | ESCC | protein maturation by iron-sulfur cluster transfer | 14/8552 | 16/18723 | 6.78e-04 | 3.56e-03 | 14 |
| GO:00516046 | Liver | Cirrhotic | protein maturation | 121/4634 | 294/18723 | 3.54e-10 | 1.68e-08 | 121 |
| GO:005160412 | Liver | HCC | protein maturation | 171/7958 | 294/18723 | 3.80e-08 | 8.30e-07 | 171 |
| GO:005160410 | Oral cavity | OSCC | protein maturation | 170/7305 | 294/18723 | 3.97e-11 | 1.28e-09 | 170 |
| GO:0097428 | Oral cavity | OSCC | protein maturation by iron-sulfur cluster transfer | 11/7305 | 16/18723 | 1.56e-02 | 4.99e-02 | 11 |
| GO:005160416 | Oral cavity | LP | protein maturation | 122/4623 | 294/18723 | 1.37e-10 | 7.72e-09 | 122 |
| GO:00974281 | Oral cavity | LP | protein maturation by iron-sulfur cluster transfer | 9/4623 | 16/18723 | 6.82e-03 | 3.94e-02 | 9 |
| GO:00516049 | Prostate | BPH | protein maturation | 80/3107 | 294/18723 | 2.64e-06 | 4.23e-05 | 80 |
| GO:005160415 | Prostate | Tumor | protein maturation | 81/3246 | 294/18723 | 7.58e-06 | 1.13e-04 | 81 |
| GO:005160419 | Skin | cSCC | protein maturation | 117/4864 | 294/18723 | 1.27e-07 | 2.93e-06 | 117 |
| GO:00974283 | Skin | cSCC | protein maturation by iron-sulfur cluster transfer | 9/4864 | 16/18723 | 9.73e-03 | 4.31e-02 | 9 |
| GO:00516045 | Stomach | GC | protein maturation | 34/1159 | 294/18723 | 3.35e-04 | 5.33e-03 | 34 |
| GO:005160411 | Stomach | CAG with IM | protein maturation | 31/1050 | 294/18723 | 5.57e-04 | 8.22e-03 | 31 |
| Page: 1 2 |
| Pathway ID | Tissue | Disease Stage | Description | Gene Ratio | Bg Ratio | pvalue | p.adjust | qvalue | Count |
| Page: 1 |
Top |
Cell-cell communication analysis |
| Identification of potential cell-cell interactions between two cell types and their ligand-receptor pairs for different disease states |
| Ligand | Receptor | LRpair | Pathway | Tissue | Disease Stage |
| Page: 1 |
Top |
Single-cell gene regulatory network inference analysis |
| Find out the significant the regulons (TFs) and the target genes of each regulon across cell types for different disease states |
| TF | Cell Type | Tissue | Disease Stage | Target Gene | RSS | Regulon Activity |
| ∗The dot plots of a searched regulon are shown for all cell subpopulations in each disease state of each tissue based on the regulon specific score inferred using pySCENIC and by calculating the average expression. |
| Page: 1 |
Top |
Somatic mutation of malignant transformation related genes |
| Annotation of somatic variants for genes involved in malignant transformation |
| Hugo Symbol | Variant Class | Variant Classification | dbSNP RS | HGVSc | HGVSp | HGVSp Short | SWISSPROT | BIOTYPE | SIFT | PolyPhen | Tumor Sample Barcode | Tissue | Histology | Sex | Age | Stage | Therapy Types | Drugs | Outcome |
| CISD3 | SNV | Missense_Mutation | novel | c.80N>T | p.Trp27Leu | p.W27L | P0C7P0 | protein_coding | deleterious(0.04) | probably_damaging(0.986) | TCGA-A2-A25A-01 | Breast | breast invasive carcinoma | Female | <65 | I/II | Unspecific | Cytoxan | SD |
| CISD3 | SNV | Missense_Mutation | rs755126040 | c.128N>C | p.Leu43Pro | p.L43P | P0C7P0 | protein_coding | tolerated(0.29) | benign(0.291) | TCGA-AC-A5EH-01 | Breast | breast invasive carcinoma | Female | >=65 | I/II | Unknown | Unknown | SD |
| CISD3 | SNV | Missense_Mutation | novel | c.118N>C | p.Val40Leu | p.V40L | P0C7P0 | protein_coding | tolerated(0.09) | benign(0.042) | TCGA-C8-A1HM-01 | Breast | breast invasive carcinoma | Female | >=65 | I/II | Chemotherapy | doxorubicin | CR |
| CISD3 | SNV | Missense_Mutation | novel | c.200N>C | p.Lys67Thr | p.K67T | P0C7P0 | protein_coding | tolerated(0.11) | possibly_damaging(0.883) | TCGA-B5-A11E-01 | Endometrium | uterine corpus endometrioid carcinoma | Female | <65 | I/II | Unknown | Unknown | SD |
| CISD3 | SNV | Missense_Mutation | novel | c.332N>T | p.Gly111Val | p.G111V | P0C7P0 | protein_coding | deleterious(0) | probably_damaging(1) | TCGA-EY-A215-01 | Endometrium | uterine corpus endometrioid carcinoma | Female | <65 | I/II | Unknown | Unknown | SD |
| CISD3 | insertion | Frame_Shift_Ins | novel | c.186_187dupTG | p.Gly63ValfsTer83 | p.G63Vfs*83 | P0C7P0 | protein_coding | TCGA-AJ-A3BG-01 | Endometrium | uterine corpus endometrioid carcinoma | Female | >=65 | I/II | Chemotherapy | carboplatin | PD | ||
| CISD3 | SNV | Missense_Mutation | novel | c.143A>C | p.Lys48Thr | p.K48T | P0C7P0 | protein_coding | deleterious(0) | possibly_damaging(0.598) | TCGA-RC-A7SB-01 | Liver | liver hepatocellular carcinoma | Male | <65 | I/II | Unknown | Unknown | SD |
| Page: 1 |
Top |
Related drugs of malignant transformation related genes |
| Identification of chemicals and drugs interact with genes involved in malignant transfromation |
| (DGIdb 4.0) |
| Entrez ID | Symbol | Category | Interaction Types | Drug Claim Name | Drug Name | PMIDs |
| Page: 1 |

Copyright 2023-Present -The University of Texas Health Science Center at Houston |