
|
|||||
|
 | |
| |
| |
| |
| |
| |
|
Gene: CISD2 |
Gene summary for CISD2 |
| Gene information | Species | Human | Gene symbol | CISD2 | Gene ID | 493856 |
| Gene name | CDGSH iron sulfur domain 2 | |
| Gene Alias | ERIS | |
| Cytomap | 4q24 | |
| Gene Type | protein-coding | GO ID | GO:0000422 | UniProtAcc | Q8N5K1 |
Top |
Malignant transformation analysis |
| Identification of the aberrant gene expression in precancerous and cancerous lesions by comparing the gene expression of stem-like cells in diseased tissues with normal stem cells |
| Entrez ID | Symbol | Replicates | Species | Organ | Tissue | Adj P-value | Log2FC | Malignancy |
| 493856 | CISD2 | HTA11_1938_2000001011 | Human | Colorectum | AD | 5.08e-03 | 3.15e-01 | -0.0811 |
| 493856 | CISD2 | HTA11_347_2000001011 | Human | Colorectum | AD | 9.59e-03 | 2.02e-01 | -0.1954 |
| 493856 | CISD2 | HTA11_1391_2000001011 | Human | Colorectum | AD | 2.48e-02 | 2.61e-01 | -0.059 |
| 493856 | CISD2 | HTA11_866_3004761011 | Human | Colorectum | AD | 5.49e-04 | 2.48e-01 | 0.096 |
| 493856 | CISD2 | HTA11_99999970781_79442 | Human | Colorectum | MSS | 2.23e-13 | 4.70e-01 | 0.294 |
| 493856 | CISD2 | HTA11_99999971662_82457 | Human | Colorectum | MSS | 2.20e-07 | 3.17e-01 | 0.3859 |
| 493856 | CISD2 | LZE4T | Human | Esophagus | ESCC | 3.39e-23 | 6.66e-01 | 0.0811 |
| 493856 | CISD2 | LZE7T | Human | Esophagus | ESCC | 3.18e-12 | 6.68e-01 | 0.0667 |
| 493856 | CISD2 | LZE8T | Human | Esophagus | ESCC | 1.64e-07 | 2.44e-01 | 0.067 |
| 493856 | CISD2 | LZE20T | Human | Esophagus | ESCC | 2.05e-09 | 2.47e-01 | 0.0662 |
| 493856 | CISD2 | LZE22T | Human | Esophagus | ESCC | 5.31e-04 | 5.68e-01 | 0.068 |
| 493856 | CISD2 | LZE24T | Human | Esophagus | ESCC | 5.05e-27 | 6.52e-01 | 0.0596 |
| 493856 | CISD2 | LZE6T | Human | Esophagus | ESCC | 5.09e-18 | 9.41e-01 | 0.0845 |
| 493856 | CISD2 | P1T-E | Human | Esophagus | ESCC | 5.52e-05 | 3.05e-01 | 0.0875 |
| 493856 | CISD2 | P2T-E | Human | Esophagus | ESCC | 3.24e-41 | 9.16e-01 | 0.1177 |
| 493856 | CISD2 | P4T-E | Human | Esophagus | ESCC | 6.14e-65 | 1.43e+00 | 0.1323 |
| 493856 | CISD2 | P5T-E | Human | Esophagus | ESCC | 4.48e-22 | 5.55e-01 | 0.1327 |
| 493856 | CISD2 | P8T-E | Human | Esophagus | ESCC | 1.35e-23 | 4.53e-01 | 0.0889 |
| 493856 | CISD2 | P9T-E | Human | Esophagus | ESCC | 1.97e-37 | 8.40e-01 | 0.1131 |
| 493856 | CISD2 | P10T-E | Human | Esophagus | ESCC | 6.23e-30 | 6.82e-01 | 0.116 |
| Page: 1 2 3 4 5 6 7 |
| Tissue | Expression Dynamics | Abbreviation |
| Colorectum (GSE201348) |  | FAP: Familial adenomatous polyposis |
| CRC: Colorectal cancer | ||
| Colorectum (HTA11) | 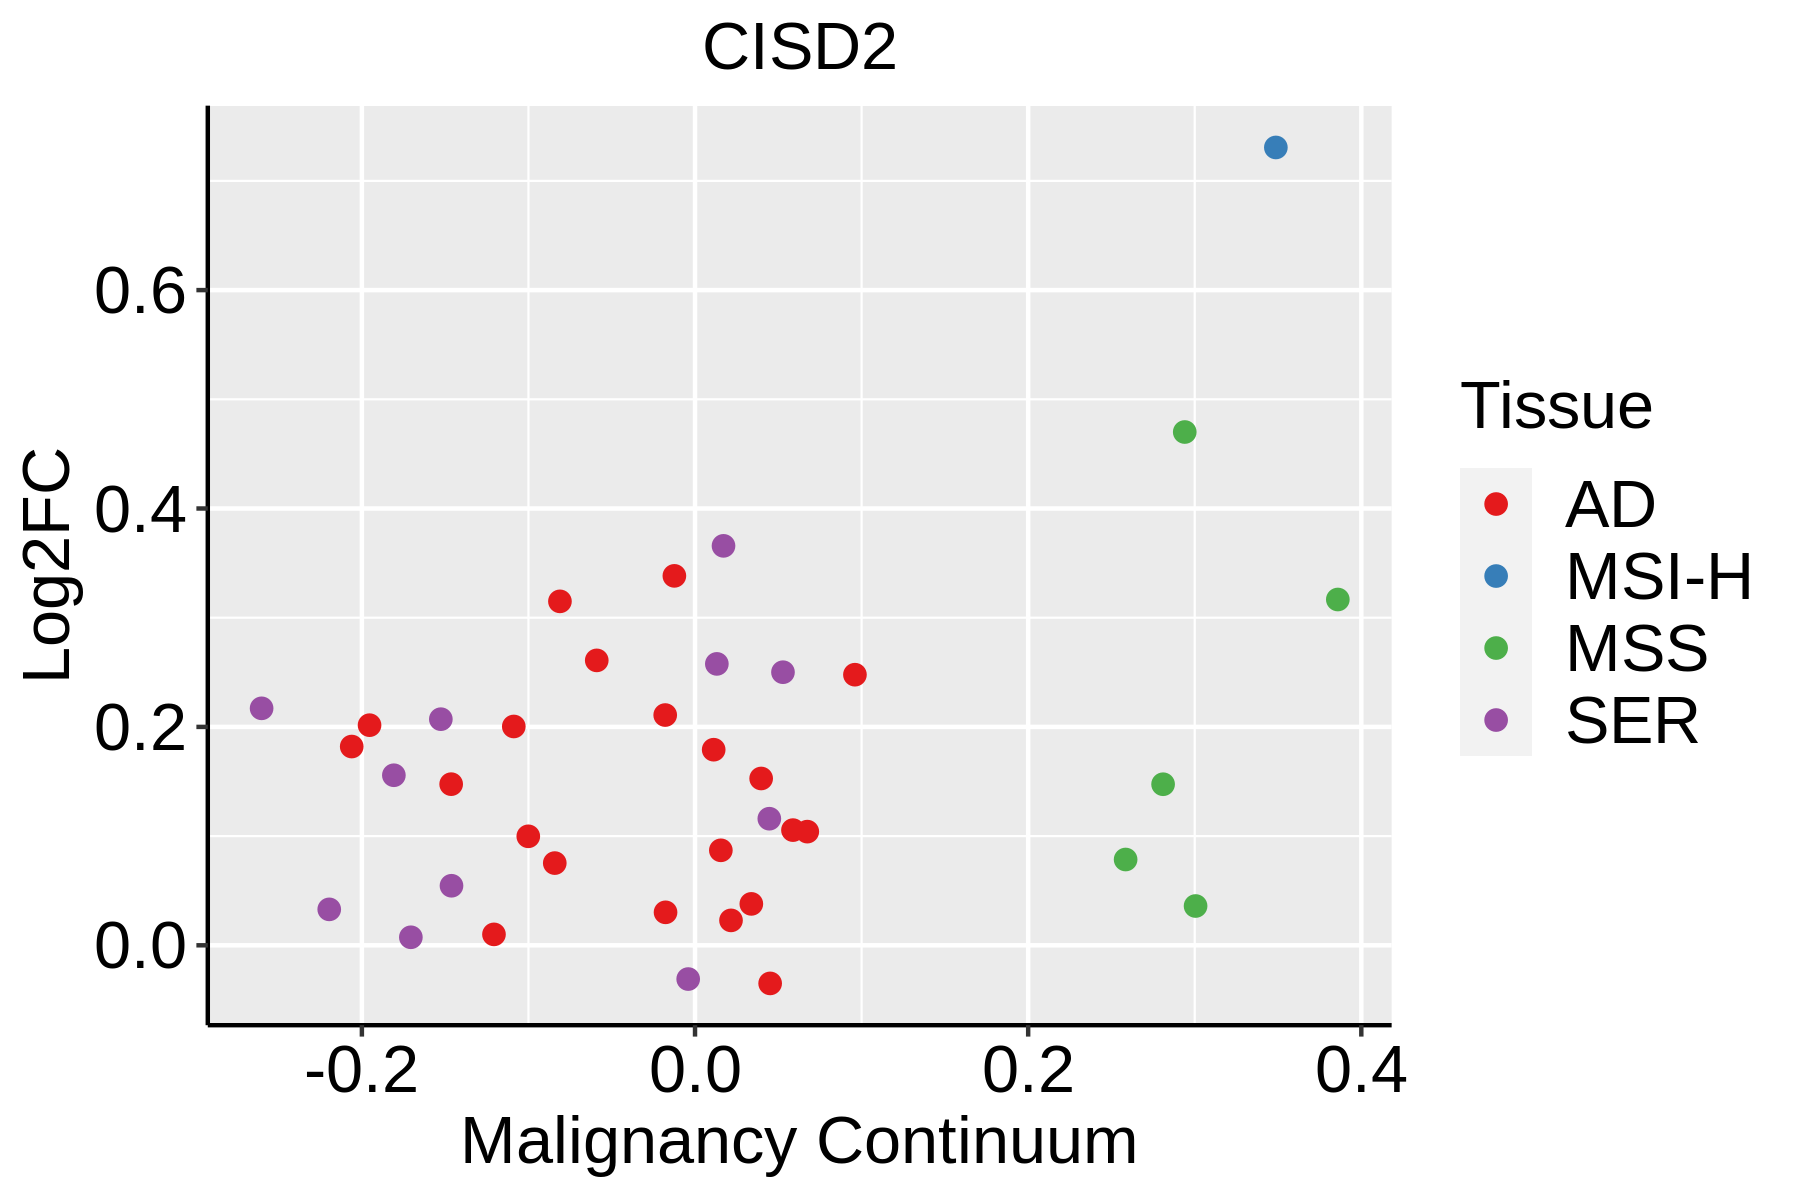 | AD: Adenomas |
| SER: Sessile serrated lesions | ||
| MSI-H: Microsatellite-high colorectal cancer | ||
| MSS: Microsatellite stable colorectal cancer | ||
| Esophagus | 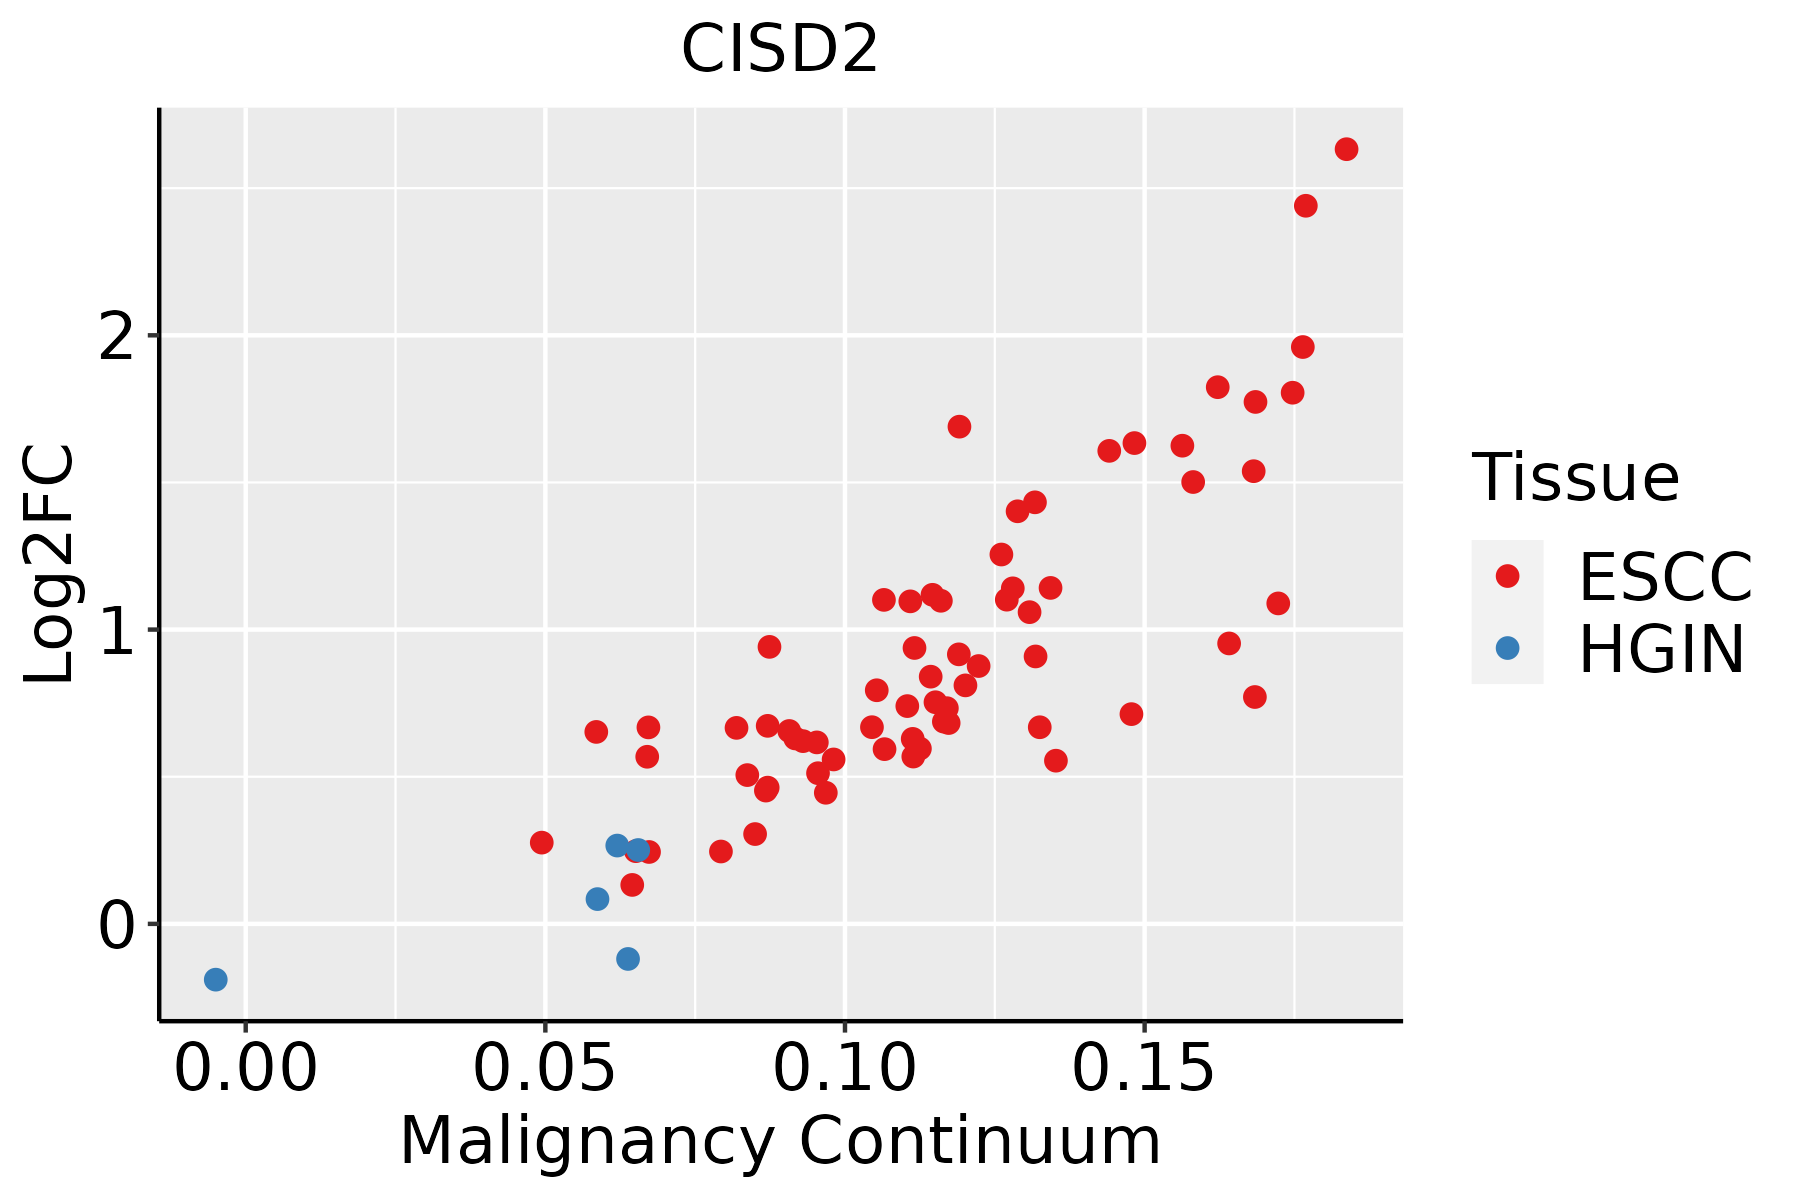 | ESCC: Esophageal squamous cell carcinoma |
| HGIN: High-grade intraepithelial neoplasias | ||
| LGIN: Low-grade intraepithelial neoplasias | ||
| Liver | 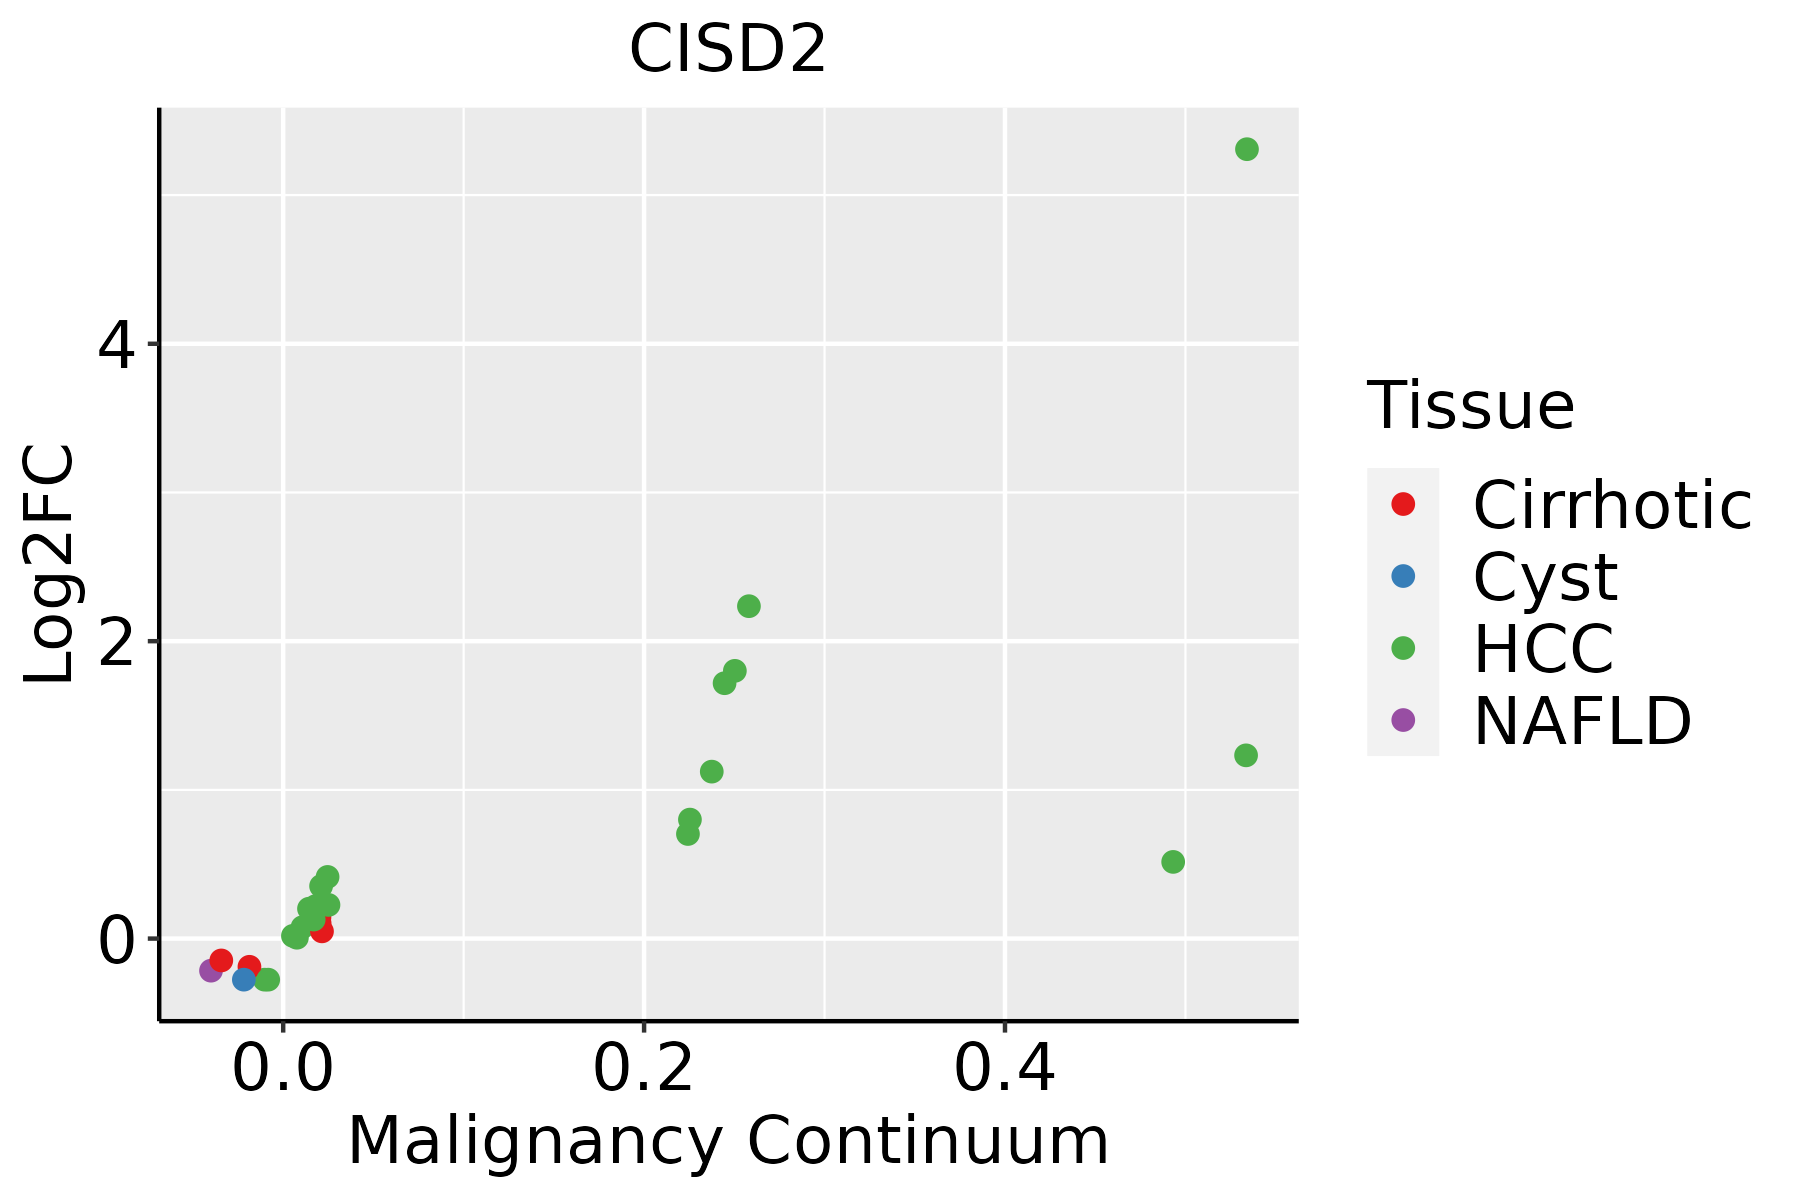 | HCC: Hepatocellular carcinoma |
| NAFLD: Non-alcoholic fatty liver disease | ||
| Oral Cavity | 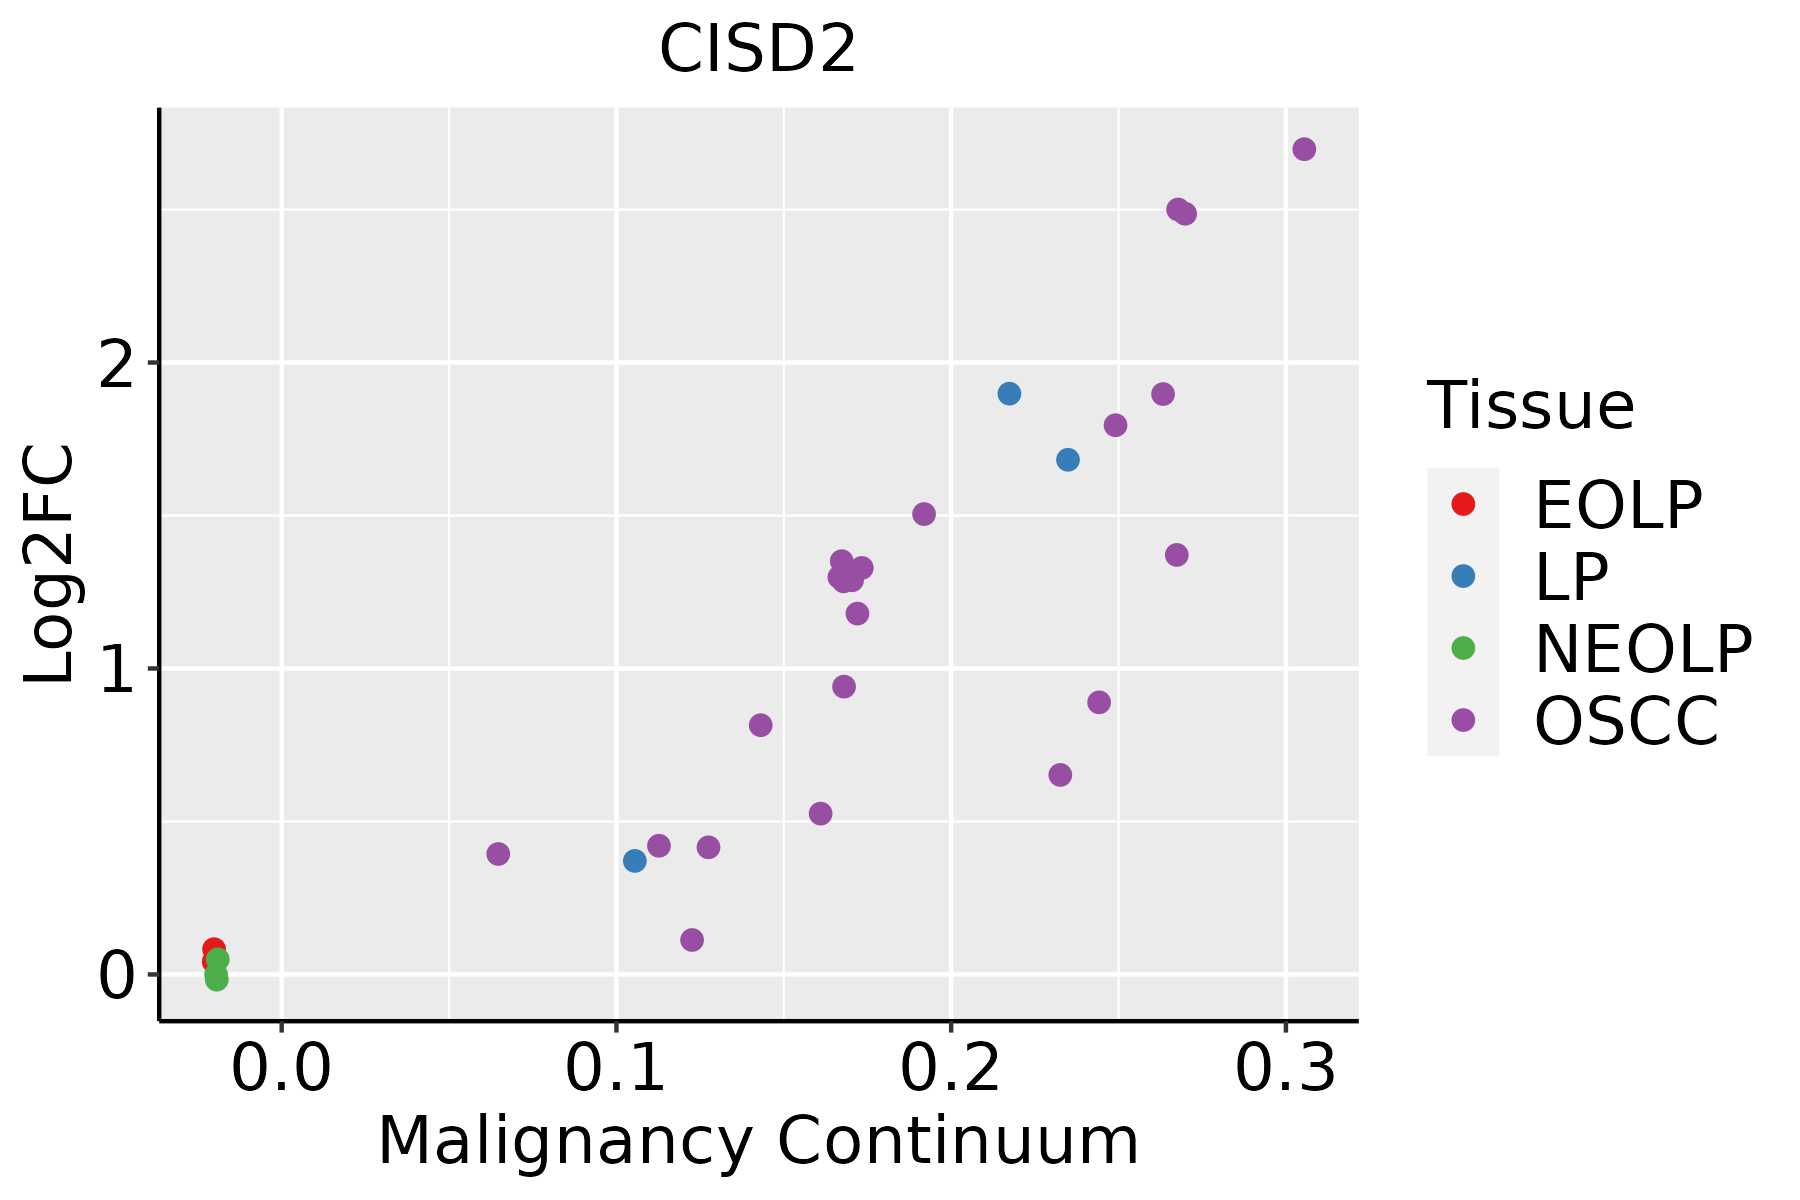 | EOLP: Erosive Oral lichen planus |
| LP: leukoplakia | ||
| NEOLP: Non-erosive oral lichen planus | ||
| OSCC: Oral squamous cell carcinoma | ||
| Skin | 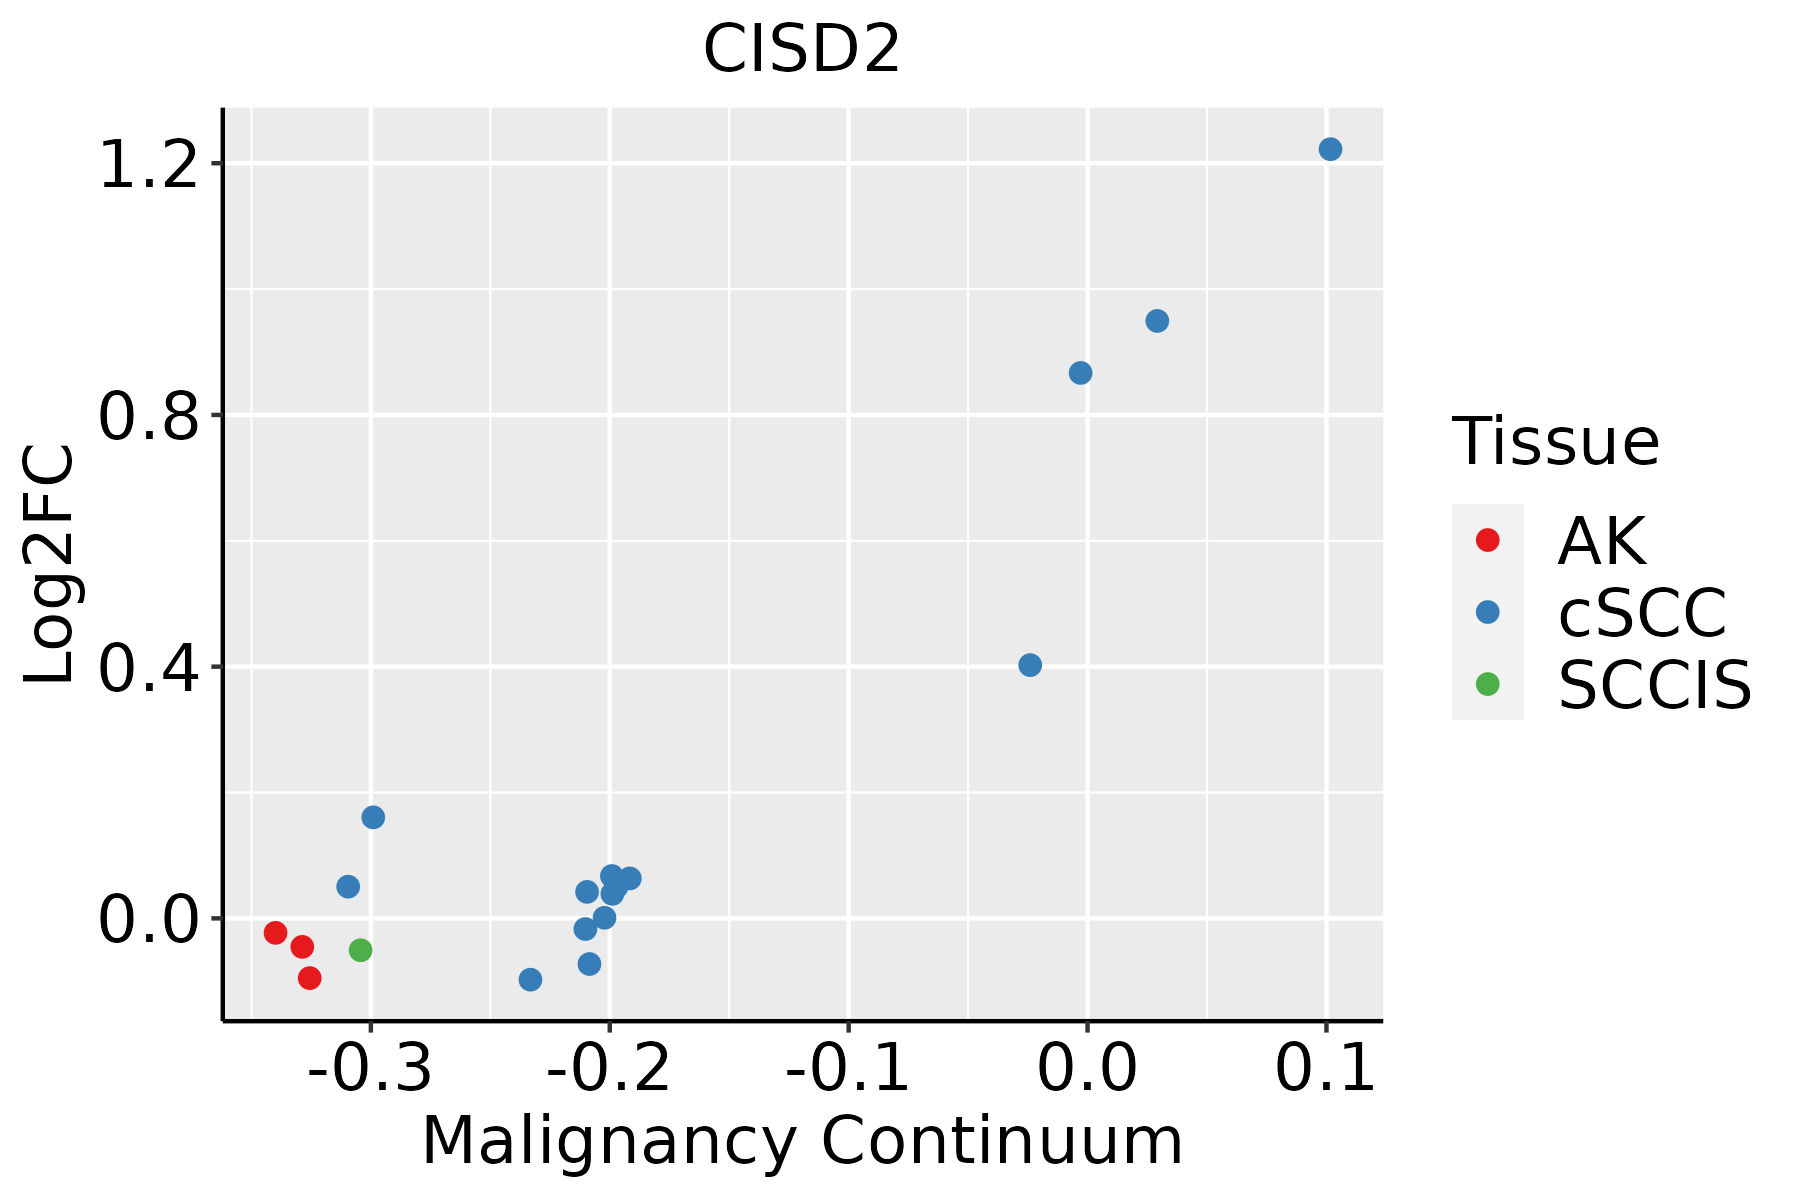 | AK: Actinic keratosis |
| cSCC: Cutaneous squamous cell carcinoma | ||
| SCCIS:squamous cell carcinoma in situ | ||
| Thyroid | 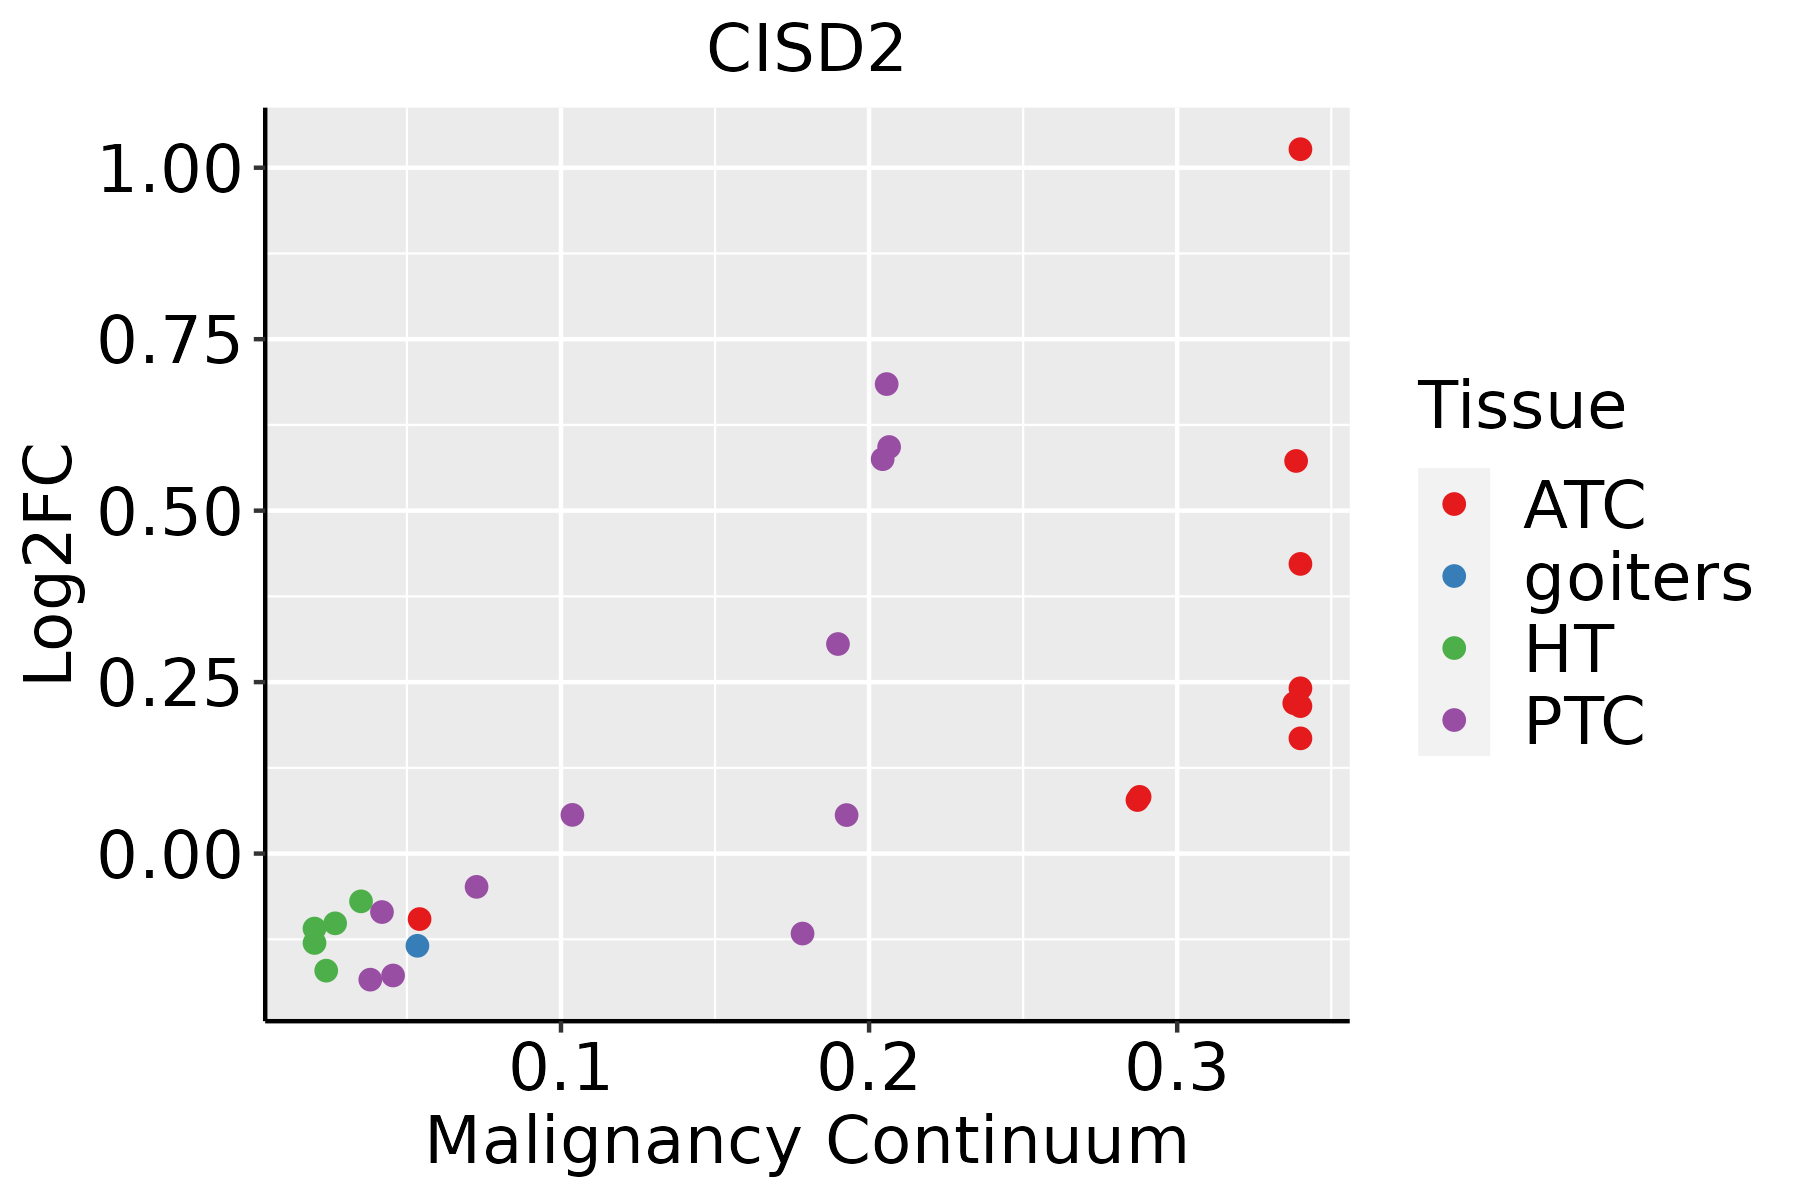 | ATC: Anaplastic thyroid cancer |
| HT: Hashimoto's thyroiditis | ||
| PTC: Papillary thyroid cancer |
| ∗log2FC in expression of this searched gene in stem-like cells from each diseased tissue sample relative to stem-like cells in normal samples in each tissue plotted against the malignancy continuum. Samples are colored based on if they are from different disease stage. |
Top |
Malignant transformation related pathway analysis |
| Find out the enriched GO biological processes and KEGG pathways involved in transition from healthy to precancer to cancer |
| Tissue | Disease Stage | Enriched GO biological Processes |
| Colorectum | AD |  |
| Colorectum | SER |  |
| Colorectum | MSS |  |
| Colorectum | MSI-H |  |
| Colorectum | FAP |  |
| ∗Top 15 enriched GO BP terms are showed in the bar plot of each disease state in each tissue. Each row represents a significant GO biological process which is colored according to the -log10(p.adjust). |
| Page: 1 2 3 4 5 6 7 8 9 |
| GO ID | Tissue | Disease Stage | Description | Gene Ratio | Bg Ratio | pvalue | p.adjust | Count |
| GO:0022411 | Colorectum | AD | cellular component disassembly | 147/3918 | 443/18723 | 8.53e-10 | 6.76e-08 | 147 |
| GO:0010506 | Colorectum | AD | regulation of autophagy | 111/3918 | 317/18723 | 3.57e-09 | 2.35e-07 | 111 |
| GO:1903008 | Colorectum | AD | organelle disassembly | 46/3918 | 114/18723 | 1.81e-06 | 5.48e-05 | 46 |
| GO:0000422 | Colorectum | AD | autophagy of mitochondrion | 35/3918 | 81/18723 | 4.94e-06 | 1.29e-04 | 35 |
| GO:0061726 | Colorectum | AD | mitochondrion disassembly | 35/3918 | 81/18723 | 4.94e-06 | 1.29e-04 | 35 |
| GO:0007568 | Colorectum | AD | aging | 98/3918 | 339/18723 | 2.77e-04 | 3.39e-03 | 98 |
| GO:00224112 | Colorectum | MSS | cellular component disassembly | 130/3467 | 443/18723 | 1.44e-08 | 8.46e-07 | 130 |
| GO:00105062 | Colorectum | MSS | regulation of autophagy | 95/3467 | 317/18723 | 4.36e-07 | 1.71e-05 | 95 |
| GO:00004222 | Colorectum | MSS | autophagy of mitochondrion | 33/3467 | 81/18723 | 2.70e-06 | 8.13e-05 | 33 |
| GO:00617262 | Colorectum | MSS | mitochondrion disassembly | 33/3467 | 81/18723 | 2.70e-06 | 8.13e-05 | 33 |
| GO:19030082 | Colorectum | MSS | organelle disassembly | 42/3467 | 114/18723 | 2.98e-06 | 8.91e-05 | 42 |
| GO:00075681 | Colorectum | MSS | aging | 90/3467 | 339/18723 | 1.51e-04 | 2.19e-03 | 90 |
| GO:0022411111 | Esophagus | ESCC | cellular component disassembly | 305/8552 | 443/18723 | 1.94e-23 | 4.57e-21 | 305 |
| GO:001050617 | Esophagus | ESCC | regulation of autophagy | 220/8552 | 317/18723 | 6.72e-18 | 6.36e-16 | 220 |
| GO:190300816 | Esophagus | ESCC | organelle disassembly | 89/8552 | 114/18723 | 1.36e-12 | 5.80e-11 | 89 |
| GO:000042217 | Esophagus | ESCC | autophagy of mitochondrion | 63/8552 | 81/18723 | 3.41e-09 | 7.24e-08 | 63 |
| GO:006172617 | Esophagus | ESCC | mitochondrion disassembly | 63/8552 | 81/18723 | 3.41e-09 | 7.24e-08 | 63 |
| GO:000756820 | Esophagus | ESCC | aging | 201/8552 | 339/18723 | 2.64e-07 | 3.94e-06 | 201 |
| GO:00224117 | Liver | Cirrhotic | cellular component disassembly | 182/4634 | 443/18723 | 1.59e-14 | 1.54e-12 | 182 |
| GO:001050611 | Liver | Cirrhotic | regulation of autophagy | 132/4634 | 317/18723 | 2.17e-11 | 1.33e-09 | 132 |
| Page: 1 2 3 |
| Pathway ID | Tissue | Disease Stage | Description | Gene Ratio | Bg Ratio | pvalue | p.adjust | qvalue | Count |
| Page: 1 |
Top |
Cell-cell communication analysis |
| Identification of potential cell-cell interactions between two cell types and their ligand-receptor pairs for different disease states |
| Ligand | Receptor | LRpair | Pathway | Tissue | Disease Stage |
| Page: 1 |
Top |
Single-cell gene regulatory network inference analysis |
| Find out the significant the regulons (TFs) and the target genes of each regulon across cell types for different disease states |
| TF | Cell Type | Tissue | Disease Stage | Target Gene | RSS | Regulon Activity |
| ∗The dot plots of a searched regulon are shown for all cell subpopulations in each disease state of each tissue based on the regulon specific score inferred using pySCENIC and by calculating the average expression. |
| Page: 1 |
Top |
Somatic mutation of malignant transformation related genes |
| Annotation of somatic variants for genes involved in malignant transformation |
| Hugo Symbol | Variant Class | Variant Classification | dbSNP RS | HGVSc | HGVSp | HGVSp Short | SWISSPROT | BIOTYPE | SIFT | PolyPhen | Tumor Sample Barcode | Tissue | Histology | Sex | Age | Stage | Therapy Types | Drugs | Outcome |
| CISD2 | SNV | Missense_Mutation | c.101C>T | p.Thr34Ile | p.T34I | Q8N5K1 | protein_coding | tolerated(0.08) | benign(0.117) | TCGA-A6-5665-01 | Colorectum | colon adenocarcinoma | Female | >=65 | I/II | Unknown | Unknown | PD | |
| CISD2 | SNV | Missense_Mutation | novel | c.110N>G | p.Glu37Gly | p.E37G | Q8N5K1 | protein_coding | deleterious(0) | probably_damaging(0.995) | TCGA-AZ-4315-01 | Colorectum | colon adenocarcinoma | Male | <65 | I/II | Unknown | Unknown | SD |
| CISD2 | SNV | Missense_Mutation | c.317N>T | p.Thr106Met | p.T106M | Q8N5K1 | protein_coding | deleterious(0.03) | probably_damaging(0.996) | TCGA-AX-A05Z-01 | Endometrium | uterine corpus endometrioid carcinoma | Female | <65 | III/IV | Chemotherapy | adriamycin | SD | |
| CISD2 | SNV | Missense_Mutation | rs753403300 | c.118N>T | p.Arg40Trp | p.R40W | Q8N5K1 | protein_coding | deleterious(0.01) | benign(0.005) | TCGA-B5-A0JY-01 | Endometrium | uterine corpus endometrioid carcinoma | Female | <65 | III/IV | Chemotherapy | doxorubicin | SD |
| CISD2 | SNV | Missense_Mutation | rs753403300 | c.118C>T | p.Arg40Trp | p.R40W | Q8N5K1 | protein_coding | deleterious(0.01) | benign(0.005) | TCGA-B5-A0K2-01 | Endometrium | uterine corpus endometrioid carcinoma | Female | <65 | III/IV | Hormone Therapy | megace | SD |
| CISD2 | SNV | Missense_Mutation | novel | c.70C>T | p.Pro24Ser | p.P24S | Q8N5K1 | protein_coding | deleterious(0.02) | probably_damaging(0.992) | TCGA-B5-A3FC-01 | Endometrium | uterine corpus endometrioid carcinoma | Female | <65 | I/II | Unknown | Unknown | SD |
| CISD2 | SNV | Missense_Mutation | c.326N>T | p.Ala109Val | p.A109V | Q8N5K1 | protein_coding | tolerated(0.72) | benign(0) | TCGA-D1-A103-01 | Endometrium | uterine corpus endometrioid carcinoma | Female | >=65 | I/II | Unknown | Unknown | SD | |
| CISD2 | SNV | Missense_Mutation | novel | c.169C>A | p.Arg57Ser | p.R57S | Q8N5K1 | protein_coding | deleterious(0.04) | benign(0.118) | TCGA-E6-A1LX-01 | Endometrium | uterine corpus endometrioid carcinoma | Female | <65 | I/II | Unknown | Unknown | SD |
| CISD2 | SNV | Missense_Mutation | novel | c.181C>T | p.Pro61Ser | p.P61S | Q8N5K1 | protein_coding | tolerated(0.06) | benign(0.007) | TCGA-NK-A5CT-01 | Lung | lung squamous cell carcinoma | Male | >=65 | I/II | Unknown | Unknown | PD |
| Page: 1 |
Top |
Related drugs of malignant transformation related genes |
| Identification of chemicals and drugs interact with genes involved in malignant transfromation |
| (DGIdb 4.0) |
| Entrez ID | Symbol | Category | Interaction Types | Drug Claim Name | Drug Name | PMIDs |
| Page: 1 |

Copyright 2023-Present -The University of Texas Health Science Center at Houston |