| Tissue | Expression Dynamics | Abbreviation |
| Esophagus | 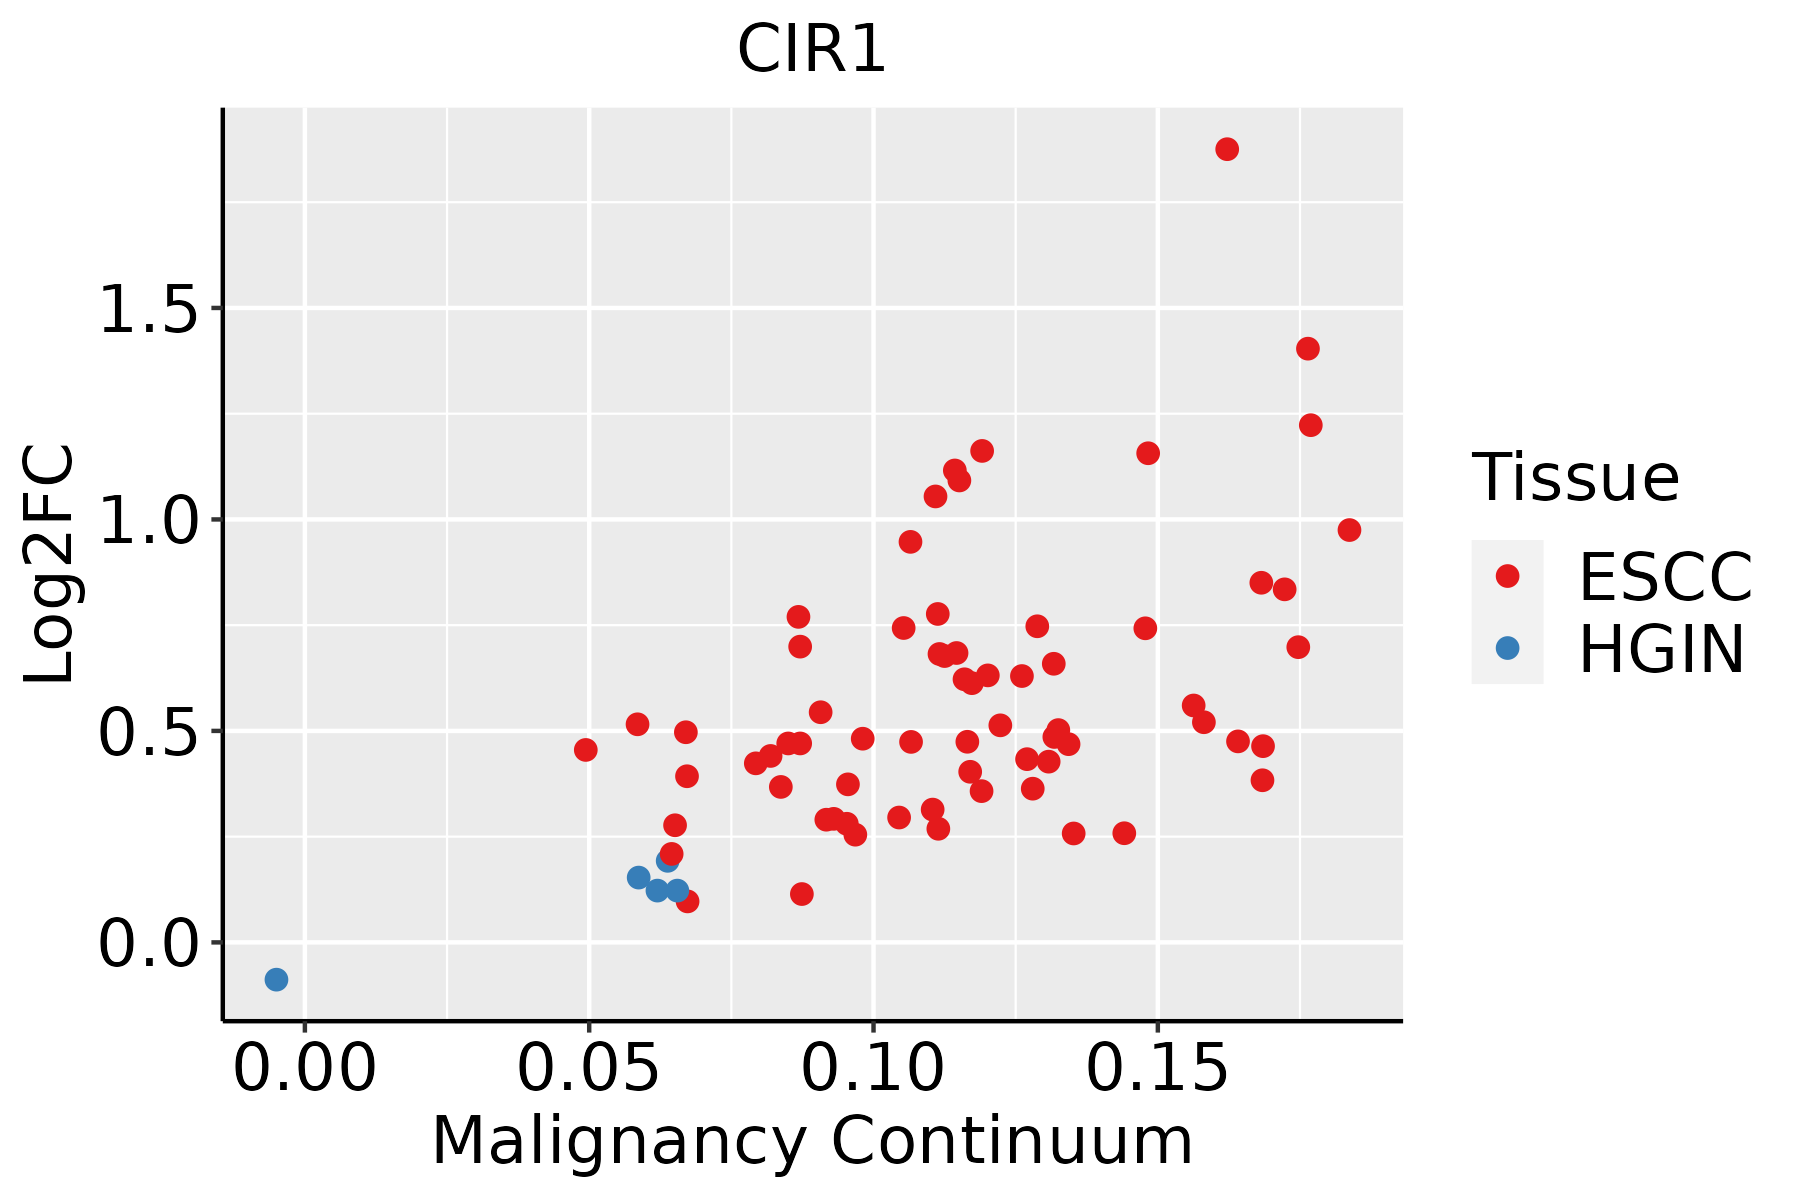 | ESCC: Esophageal squamous cell carcinoma |
| HGIN: High-grade intraepithelial neoplasias |
| LGIN: Low-grade intraepithelial neoplasias |
| Liver |  | HCC: Hepatocellular carcinoma |
| NAFLD: Non-alcoholic fatty liver disease |
| Oral Cavity |  | EOLP: Erosive Oral lichen planus |
| LP: leukoplakia |
| NEOLP: Non-erosive oral lichen planus |
| OSCC: Oral squamous cell carcinoma |
| Prostate | 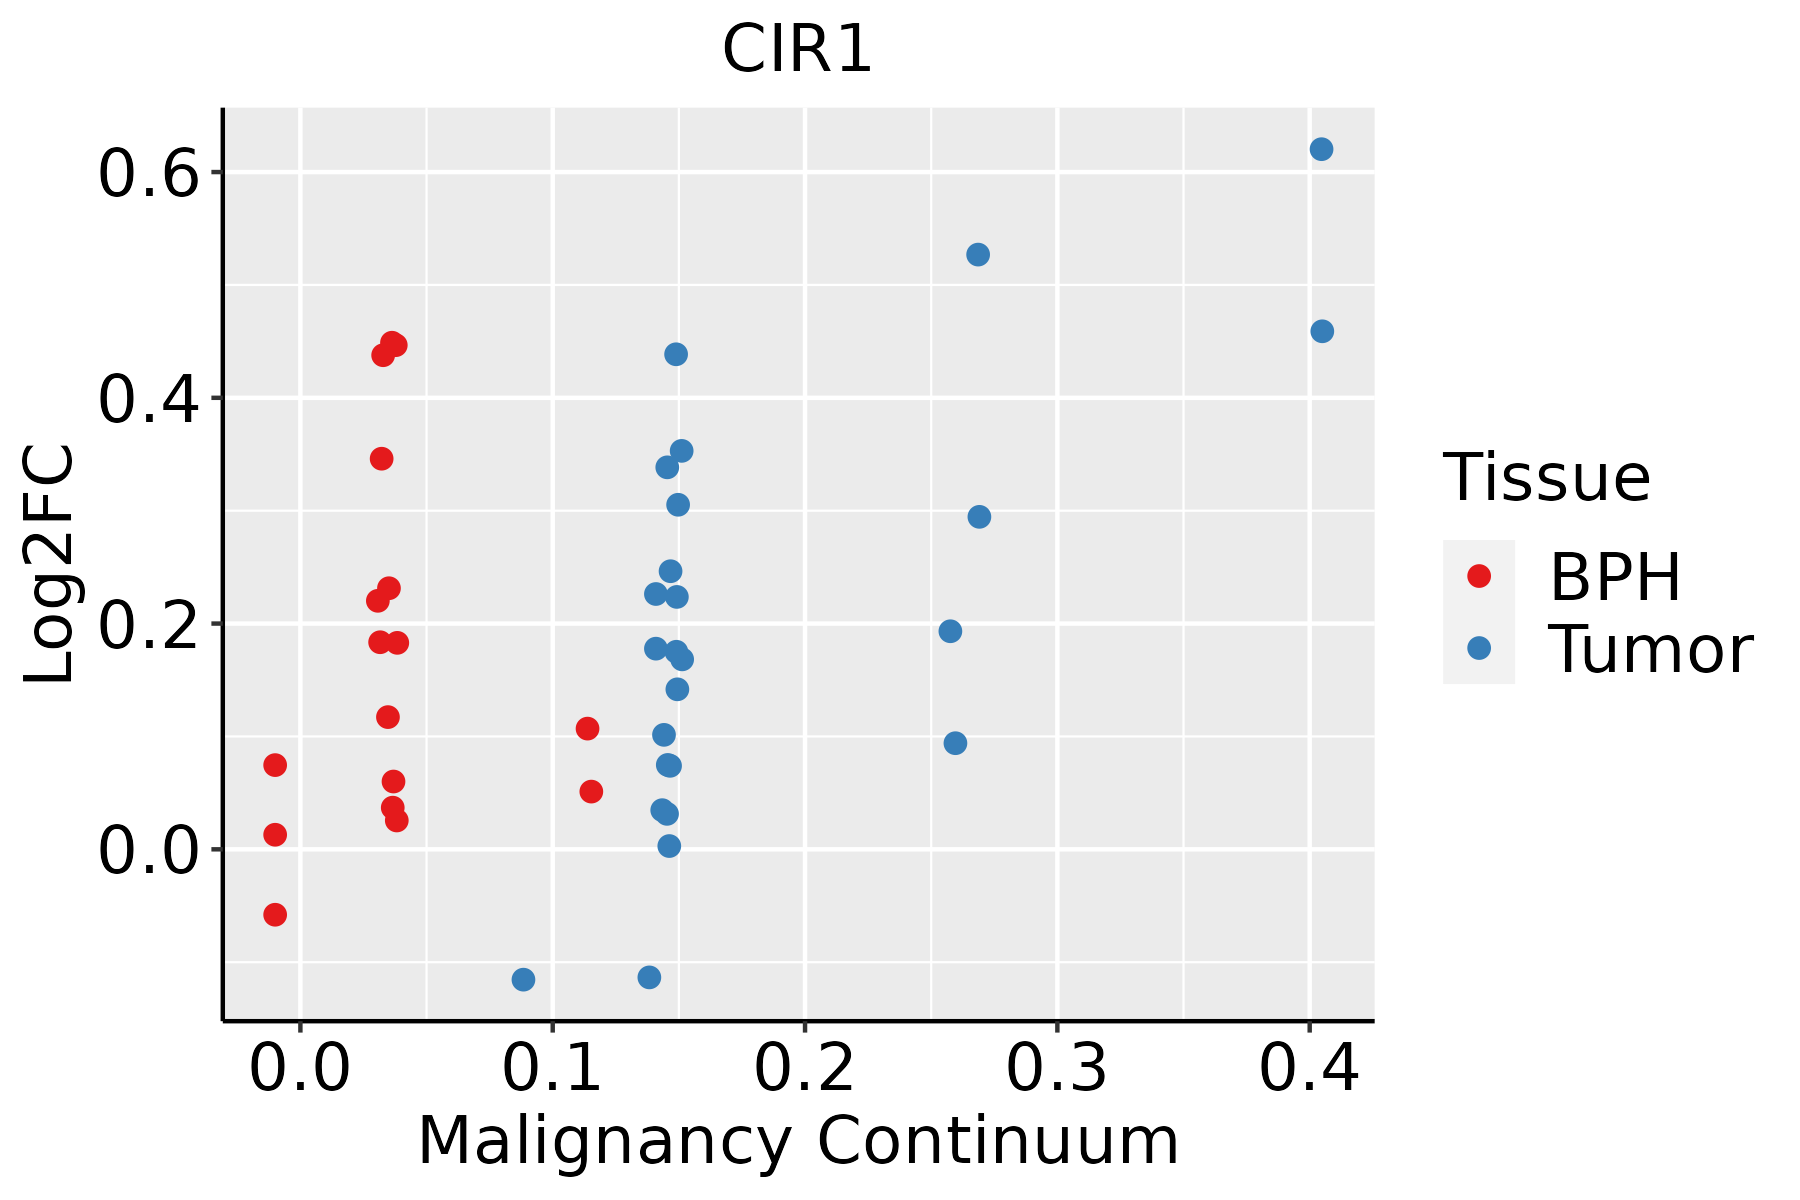 | BPH: Benign Prostatic Hyperplasia |
| Skin | 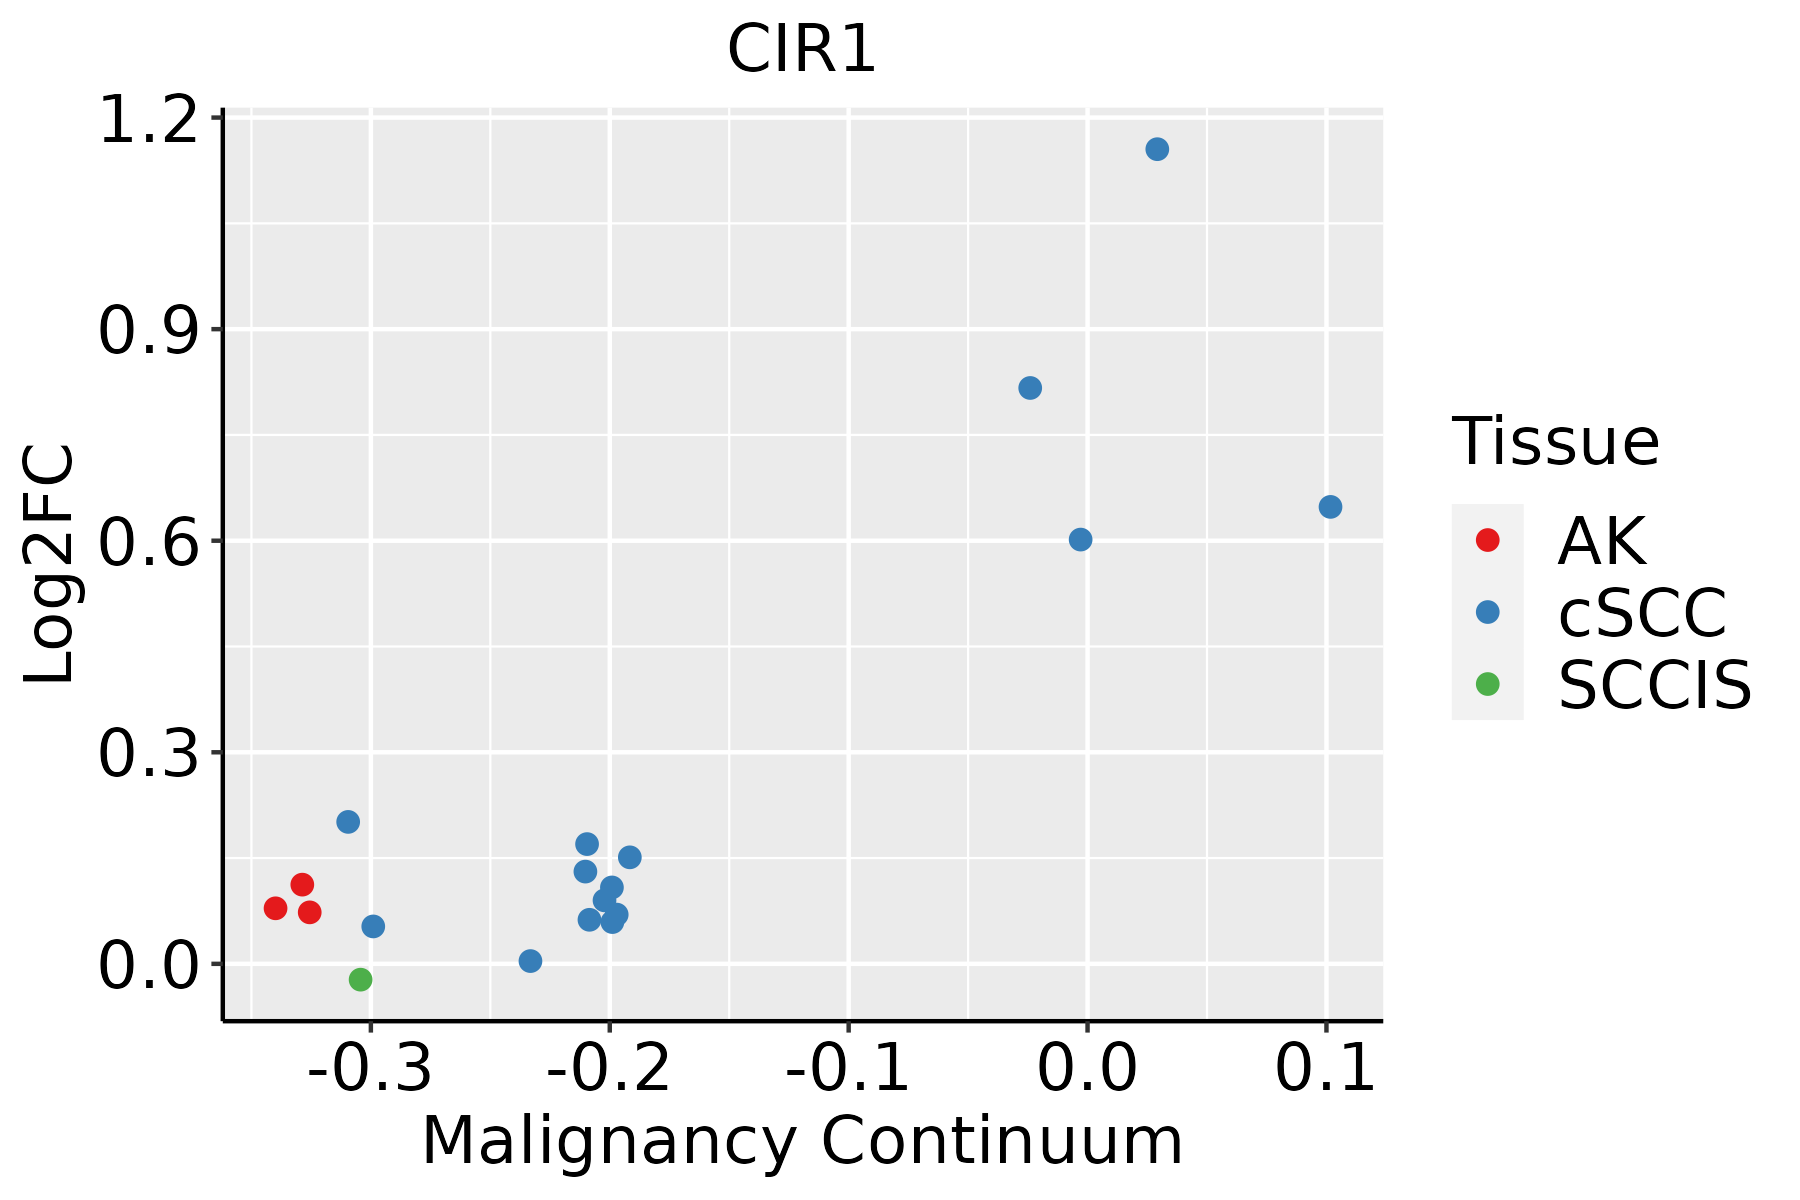 | AK: Actinic keratosis |
| cSCC: Cutaneous squamous cell carcinoma |
| SCCIS:squamous cell carcinoma in situ |
| Thyroid |  | ATC: Anaplastic thyroid cancer |
| HT: Hashimoto's thyroiditis |
| PTC: Papillary thyroid cancer |
| GO ID | Tissue | Disease Stage | Description | Gene Ratio | Bg Ratio | pvalue | p.adjust | Count |
| GO:000838026 | Esophagus | HGIN | RNA splicing | 160/2587 | 434/18723 | 3.74e-34 | 1.12e-30 | 160 |
| GO:000170118 | Esophagus | HGIN | in utero embryonic development | 77/2587 | 367/18723 | 9.56e-05 | 2.05e-03 | 77 |
| GO:0008380111 | Esophagus | ESCC | RNA splicing | 336/8552 | 434/18723 | 1.74e-42 | 3.67e-39 | 336 |
| GO:000170119 | Esophagus | ESCC | in utero embryonic development | 243/8552 | 367/18723 | 1.00e-15 | 6.86e-14 | 243 |
| GO:000838012 | Liver | Cirrhotic | RNA splicing | 229/4634 | 434/18723 | 9.13e-37 | 2.86e-33 | 229 |
| GO:00017015 | Liver | Cirrhotic | in utero embryonic development | 134/4634 | 367/18723 | 2.78e-07 | 6.86e-06 | 134 |
| GO:000838022 | Liver | HCC | RNA splicing | 313/7958 | 434/18723 | 1.36e-36 | 1.73e-33 | 313 |
| GO:000170111 | Liver | HCC | in utero embryonic development | 204/7958 | 367/18723 | 2.44e-07 | 4.30e-06 | 204 |
| GO:000838020 | Oral cavity | OSCC | RNA splicing | 308/7305 | 434/18723 | 2.43e-42 | 7.70e-39 | 308 |
| GO:000170116 | Oral cavity | OSCC | in utero embryonic development | 207/7305 | 367/18723 | 7.92e-12 | 2.95e-10 | 207 |
| GO:0008380110 | Oral cavity | LP | RNA splicing | 237/4623 | 434/18723 | 1.82e-41 | 3.79e-38 | 237 |
| GO:000170117 | Oral cavity | LP | in utero embryonic development | 142/4623 | 367/18723 | 1.48e-09 | 6.75e-08 | 142 |
| GO:000838018 | Prostate | BPH | RNA splicing | 147/3107 | 434/18723 | 5.17e-19 | 2.29e-16 | 147 |
| GO:000170110 | Prostate | BPH | in utero embryonic development | 104/3107 | 367/18723 | 9.17e-09 | 3.10e-07 | 104 |
| GO:000838019 | Prostate | Tumor | RNA splicing | 153/3246 | 434/18723 | 9.15e-20 | 5.79e-17 | 153 |
| GO:000170115 | Prostate | Tumor | in utero embryonic development | 106/3246 | 367/18723 | 2.37e-08 | 8.09e-07 | 106 |
| GO:0008380112 | Skin | cSCC | RNA splicing | 263/4864 | 434/18723 | 2.45e-53 | 5.13e-50 | 263 |
| GO:000170124 | Skin | cSCC | in utero embryonic development | 150/4864 | 367/18723 | 2.47e-10 | 1.04e-08 | 150 |
| GO:0008380113 | Thyroid | PTC | RNA splicing | 273/5968 | 434/18723 | 4.44e-41 | 1.40e-37 | 273 |
| GO:0001701111 | Thyroid | PTC | in utero embryonic development | 175/5968 | 367/18723 | 1.40e-10 | 4.73e-09 | 175 |
| Pathway ID | Tissue | Disease Stage | Description | Gene Ratio | Bg Ratio | pvalue | p.adjust | qvalue | Count |
| hsa0516930 | Esophagus | HGIN | Epstein-Barr virus infection | 55/1383 | 202/8465 | 5.13e-05 | 6.19e-04 | 4.92e-04 | 55 |
| hsa05169114 | Esophagus | HGIN | Epstein-Barr virus infection | 55/1383 | 202/8465 | 5.13e-05 | 6.19e-04 | 4.92e-04 | 55 |
| hsa05169210 | Esophagus | ESCC | Epstein-Barr virus infection | 151/4205 | 202/8465 | 1.55e-13 | 3.45e-12 | 1.77e-12 | 151 |
| hsa043306 | Esophagus | ESCC | Notch signaling pathway | 42/4205 | 62/8465 | 2.97e-03 | 7.97e-03 | 4.08e-03 | 42 |
| hsa0516937 | Esophagus | ESCC | Epstein-Barr virus infection | 151/4205 | 202/8465 | 1.55e-13 | 3.45e-12 | 1.77e-12 | 151 |
| hsa0433013 | Esophagus | ESCC | Notch signaling pathway | 42/4205 | 62/8465 | 2.97e-03 | 7.97e-03 | 4.08e-03 | 42 |
| hsa0516914 | Liver | Cirrhotic | Epstein-Barr virus infection | 80/2530 | 202/8465 | 1.80e-03 | 8.33e-03 | 5.13e-03 | 80 |
| hsa0516915 | Liver | Cirrhotic | Epstein-Barr virus infection | 80/2530 | 202/8465 | 1.80e-03 | 8.33e-03 | 5.13e-03 | 80 |
| hsa0516921 | Liver | HCC | Epstein-Barr virus infection | 128/4020 | 202/8465 | 3.17e-06 | 2.79e-05 | 1.55e-05 | 128 |
| hsa0516931 | Liver | HCC | Epstein-Barr virus infection | 128/4020 | 202/8465 | 3.17e-06 | 2.79e-05 | 1.55e-05 | 128 |
| hsa0516928 | Oral cavity | OSCC | Epstein-Barr virus infection | 144/3704 | 202/8465 | 1.08e-15 | 3.60e-14 | 1.83e-14 | 144 |
| hsa043305 | Oral cavity | OSCC | Notch signaling pathway | 44/3704 | 62/8465 | 1.26e-05 | 5.55e-05 | 2.83e-05 | 44 |
| hsa05169113 | Oral cavity | OSCC | Epstein-Barr virus infection | 144/3704 | 202/8465 | 1.08e-15 | 3.60e-14 | 1.83e-14 | 144 |
| hsa0433012 | Oral cavity | OSCC | Notch signaling pathway | 44/3704 | 62/8465 | 1.26e-05 | 5.55e-05 | 2.83e-05 | 44 |
| hsa0516929 | Oral cavity | LP | Epstein-Barr virus infection | 106/2418 | 202/8465 | 4.30e-13 | 9.54e-12 | 6.15e-12 | 106 |
| hsa0516936 | Oral cavity | LP | Epstein-Barr virus infection | 106/2418 | 202/8465 | 4.30e-13 | 9.54e-12 | 6.15e-12 | 106 |
| hsa0516926 | Prostate | BPH | Epstein-Barr virus infection | 70/1718 | 202/8465 | 1.06e-06 | 9.74e-06 | 6.03e-06 | 70 |
| hsa043304 | Prostate | BPH | Notch signaling pathway | 21/1718 | 62/8465 | 8.53e-03 | 2.68e-02 | 1.66e-02 | 21 |
| hsa05169112 | Prostate | BPH | Epstein-Barr virus infection | 70/1718 | 202/8465 | 1.06e-06 | 9.74e-06 | 6.03e-06 | 70 |
| hsa0433011 | Prostate | BPH | Notch signaling pathway | 21/1718 | 62/8465 | 8.53e-03 | 2.68e-02 | 1.66e-02 | 21 |
| Hugo Symbol | Variant Class | Variant Classification | dbSNP RS | HGVSc | HGVSp | HGVSp Short | SWISSPROT | BIOTYPE | SIFT | PolyPhen | Tumor Sample Barcode | Tissue | Histology | Sex | Age | Stage | Therapy Types | Drugs | Outcome |
| CIR1 | SNV | Missense_Mutation | | c.698N>G | p.Lys233Arg | p.K233R | Q86X95 | protein_coding | tolerated(0.1) | possibly_damaging(0.763) | TCGA-A8-A08Z-01 | Breast | breast invasive carcinoma | Female | >=65 | III/IV | Unknown | Unknown | SD |
| CIR1 | SNV | Missense_Mutation | novel | c.1114N>A | p.Glu372Lys | p.E372K | Q86X95 | protein_coding | deleterious_low_confidence(0.02) | benign(0.081) | TCGA-A8-A0A7-01 | Breast | breast invasive carcinoma | Female | <65 | I/II | Unknown | Unknown | SD |
| CIR1 | SNV | Missense_Mutation | novel | c.1237G>A | p.Glu413Lys | p.E413K | Q86X95 | protein_coding | tolerated_low_confidence(0.09) | benign(0.006) | TCGA-BH-A42V-01 | Breast | breast invasive carcinoma | Female | <65 | I/II | Unknown | Unknown | SD |
| CIR1 | SNV | Missense_Mutation | rs200291230 | c.631N>A | p.Glu211Lys | p.E211K | Q86X95 | protein_coding | tolerated(0.09) | probably_damaging(0.994) | TCGA-D8-A27L-01 | Breast | breast invasive carcinoma | Female | <65 | III/IV | Chemotherapy | adriamycin+cuclophosphamide | SD |
| CIR1 | SNV | Missense_Mutation | rs531011902 | c.1162C>T | p.Arg388Trp | p.R388W | Q86X95 | protein_coding | deleterious_low_confidence(0.03) | possibly_damaging(0.734) | TCGA-2W-A8YY-01 | Cervix | cervical & endocervical cancer | Female | <65 | I/II | Chemotherapy | cisplatin | CR |
| CIR1 | SNV | Missense_Mutation | novel | c.925N>A | p.Glu309Lys | p.E309K | Q86X95 | protein_coding | tolerated_low_confidence(0.06) | benign(0.154) | TCGA-EA-A3Y4-01 | Cervix | cervical & endocervical cancer | Female | <65 | I/II | Unknown | Unknown | SD |
| CIR1 | SNV | Missense_Mutation | novel | c.831T>A | p.Ser277Arg | p.S277R | Q86X95 | protein_coding | deleterious_low_confidence(0.03) | probably_damaging(0.996) | TCGA-VS-A9UC-01 | Cervix | cervical & endocervical cancer | Female | <65 | I/II | Chemotherapy | cisplatin | SD |
| CIR1 | SNV | Missense_Mutation | rs762930010 | c.1216N>T | p.Arg406Trp | p.R406W | Q86X95 | protein_coding | tolerated_low_confidence(0.25) | benign(0) | TCGA-AA-3870-01 | Colorectum | colon adenocarcinoma | Female | >=65 | III/IV | Chemotherapy | folinic | CR |
| CIR1 | SNV | Missense_Mutation | rs768225837 | c.464C>T | p.Ser155Leu | p.S155L | Q86X95 | protein_coding | deleterious(0) | possibly_damaging(0.9) | TCGA-AA-3984-01 | Colorectum | colon adenocarcinoma | Female | <65 | I/II | Unknown | Unknown | SD |
| CIR1 | SNV | Missense_Mutation | novel | c.1280N>C | p.Asp427Ala | p.D427A | Q86X95 | protein_coding | deleterious_low_confidence(0.01) | benign(0.039) | TCGA-AZ-4315-01 | Colorectum | colon adenocarcinoma | Male | <65 | I/II | Unknown | Unknown | SD |


