
|
|||||
|
 | |
| |
| |
| |
| |
| |
|
Gene: CINP |
Gene summary for CINP |
| Gene information | Species | Human | Gene symbol | CINP | Gene ID | 51550 |
| Gene name | cyclin dependent kinase 2 interacting protein | |
| Gene Alias | CINP | |
| Cytomap | 14q32.31 | |
| Gene Type | protein-coding | GO ID | GO:0006139 | UniProtAcc | Q9BW66 |
Top |
Malignant transformation analysis |
| Identification of the aberrant gene expression in precancerous and cancerous lesions by comparing the gene expression of stem-like cells in diseased tissues with normal stem cells |
| Entrez ID | Symbol | Replicates | Species | Organ | Tissue | Adj P-value | Log2FC | Malignancy |
| 51550 | CINP | LZE4T | Human | Esophagus | ESCC | 3.46e-14 | 3.79e-01 | 0.0811 |
| 51550 | CINP | LZE5T | Human | Esophagus | ESCC | 1.82e-02 | 3.19e-01 | 0.0514 |
| 51550 | CINP | LZE7T | Human | Esophagus | ESCC | 6.79e-06 | 1.79e-01 | 0.0667 |
| 51550 | CINP | LZE8T | Human | Esophagus | ESCC | 4.47e-07 | 2.36e-01 | 0.067 |
| 51550 | CINP | LZE20T | Human | Esophagus | ESCC | 9.51e-10 | 3.29e-01 | 0.0662 |
| 51550 | CINP | LZE22T | Human | Esophagus | ESCC | 3.16e-03 | 1.52e-01 | 0.068 |
| 51550 | CINP | LZE24T | Human | Esophagus | ESCC | 1.85e-16 | 1.95e-01 | 0.0596 |
| 51550 | CINP | LZE21T | Human | Esophagus | ESCC | 8.72e-04 | 1.36e-01 | 0.0655 |
| 51550 | CINP | LZE6T | Human | Esophagus | ESCC | 7.27e-08 | 2.84e-01 | 0.0845 |
| 51550 | CINP | P2T-E | Human | Esophagus | ESCC | 2.41e-16 | 2.72e-01 | 0.1177 |
| 51550 | CINP | P4T-E | Human | Esophagus | ESCC | 1.09e-30 | 7.63e-01 | 0.1323 |
| 51550 | CINP | P5T-E | Human | Esophagus | ESCC | 3.45e-48 | 8.18e-01 | 0.1327 |
| 51550 | CINP | P8T-E | Human | Esophagus | ESCC | 1.59e-15 | 3.23e-01 | 0.0889 |
| 51550 | CINP | P9T-E | Human | Esophagus | ESCC | 8.66e-13 | 2.86e-01 | 0.1131 |
| 51550 | CINP | P10T-E | Human | Esophagus | ESCC | 2.84e-48 | 7.78e-01 | 0.116 |
| 51550 | CINP | P11T-E | Human | Esophagus | ESCC | 5.13e-09 | 4.80e-01 | 0.1426 |
| 51550 | CINP | P12T-E | Human | Esophagus | ESCC | 1.08e-40 | 6.50e-01 | 0.1122 |
| 51550 | CINP | P15T-E | Human | Esophagus | ESCC | 1.37e-36 | 8.44e-01 | 0.1149 |
| 51550 | CINP | P16T-E | Human | Esophagus | ESCC | 1.72e-15 | 3.47e-01 | 0.1153 |
| 51550 | CINP | P17T-E | Human | Esophagus | ESCC | 9.53e-14 | 5.87e-01 | 0.1278 |
| Page: 1 2 3 4 5 |
| Tissue | Expression Dynamics | Abbreviation |
| Esophagus | 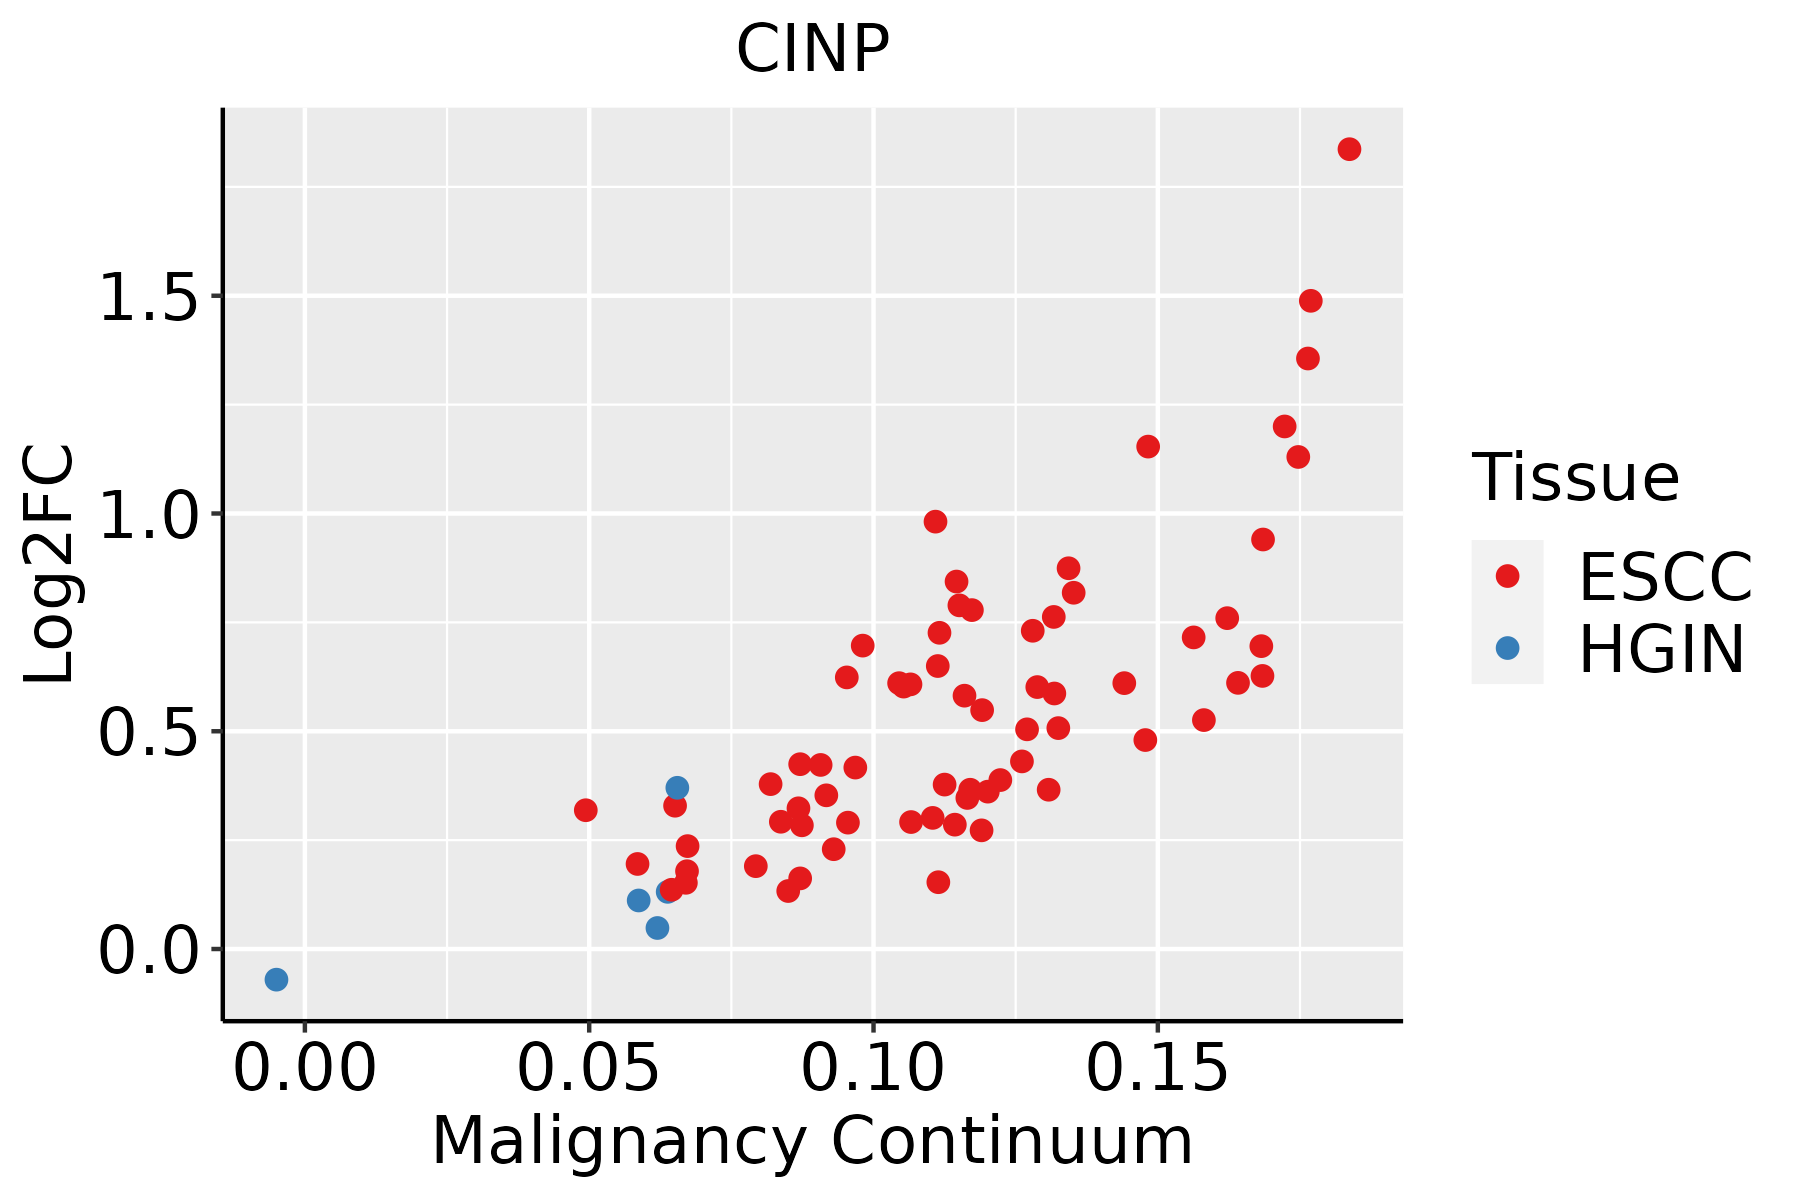 | ESCC: Esophageal squamous cell carcinoma |
| HGIN: High-grade intraepithelial neoplasias | ||
| LGIN: Low-grade intraepithelial neoplasias | ||
| Liver | 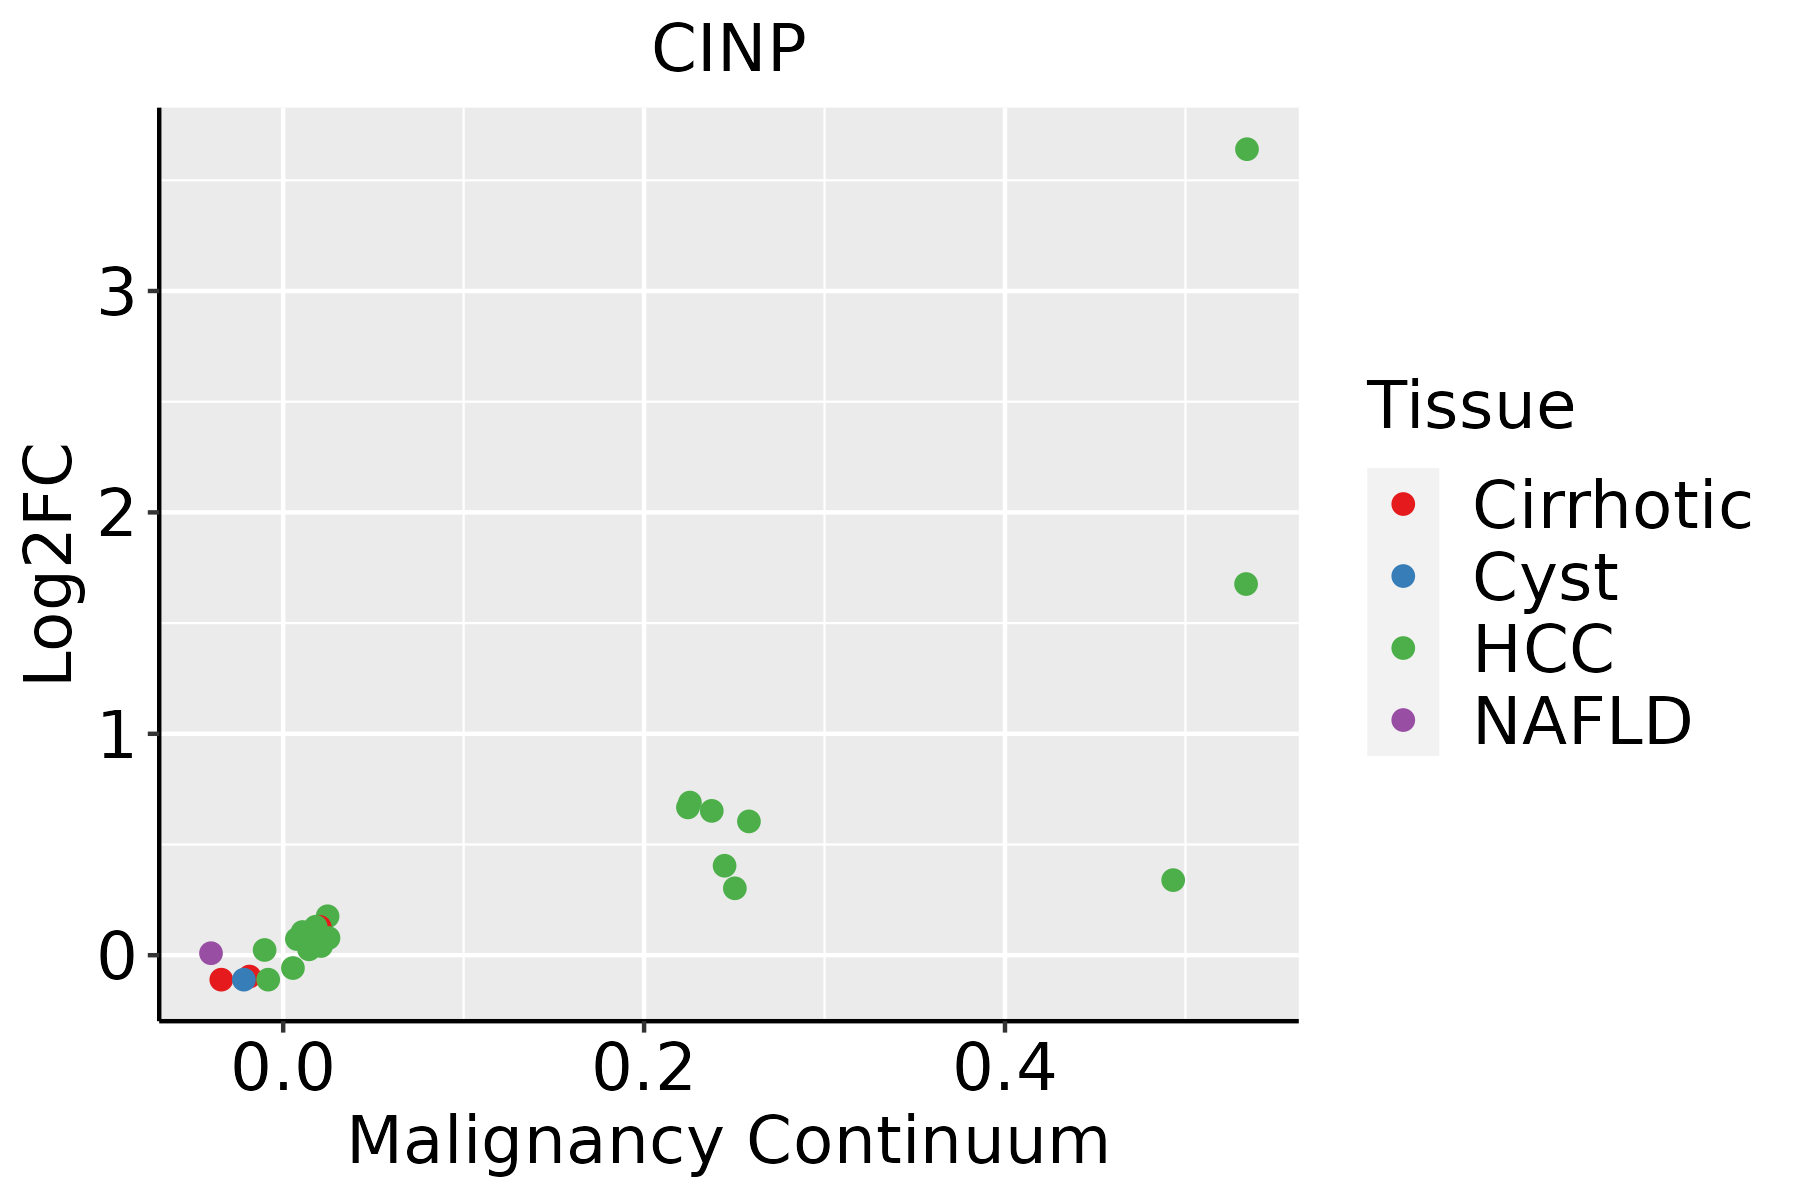 | HCC: Hepatocellular carcinoma |
| NAFLD: Non-alcoholic fatty liver disease | ||
| Oral Cavity | 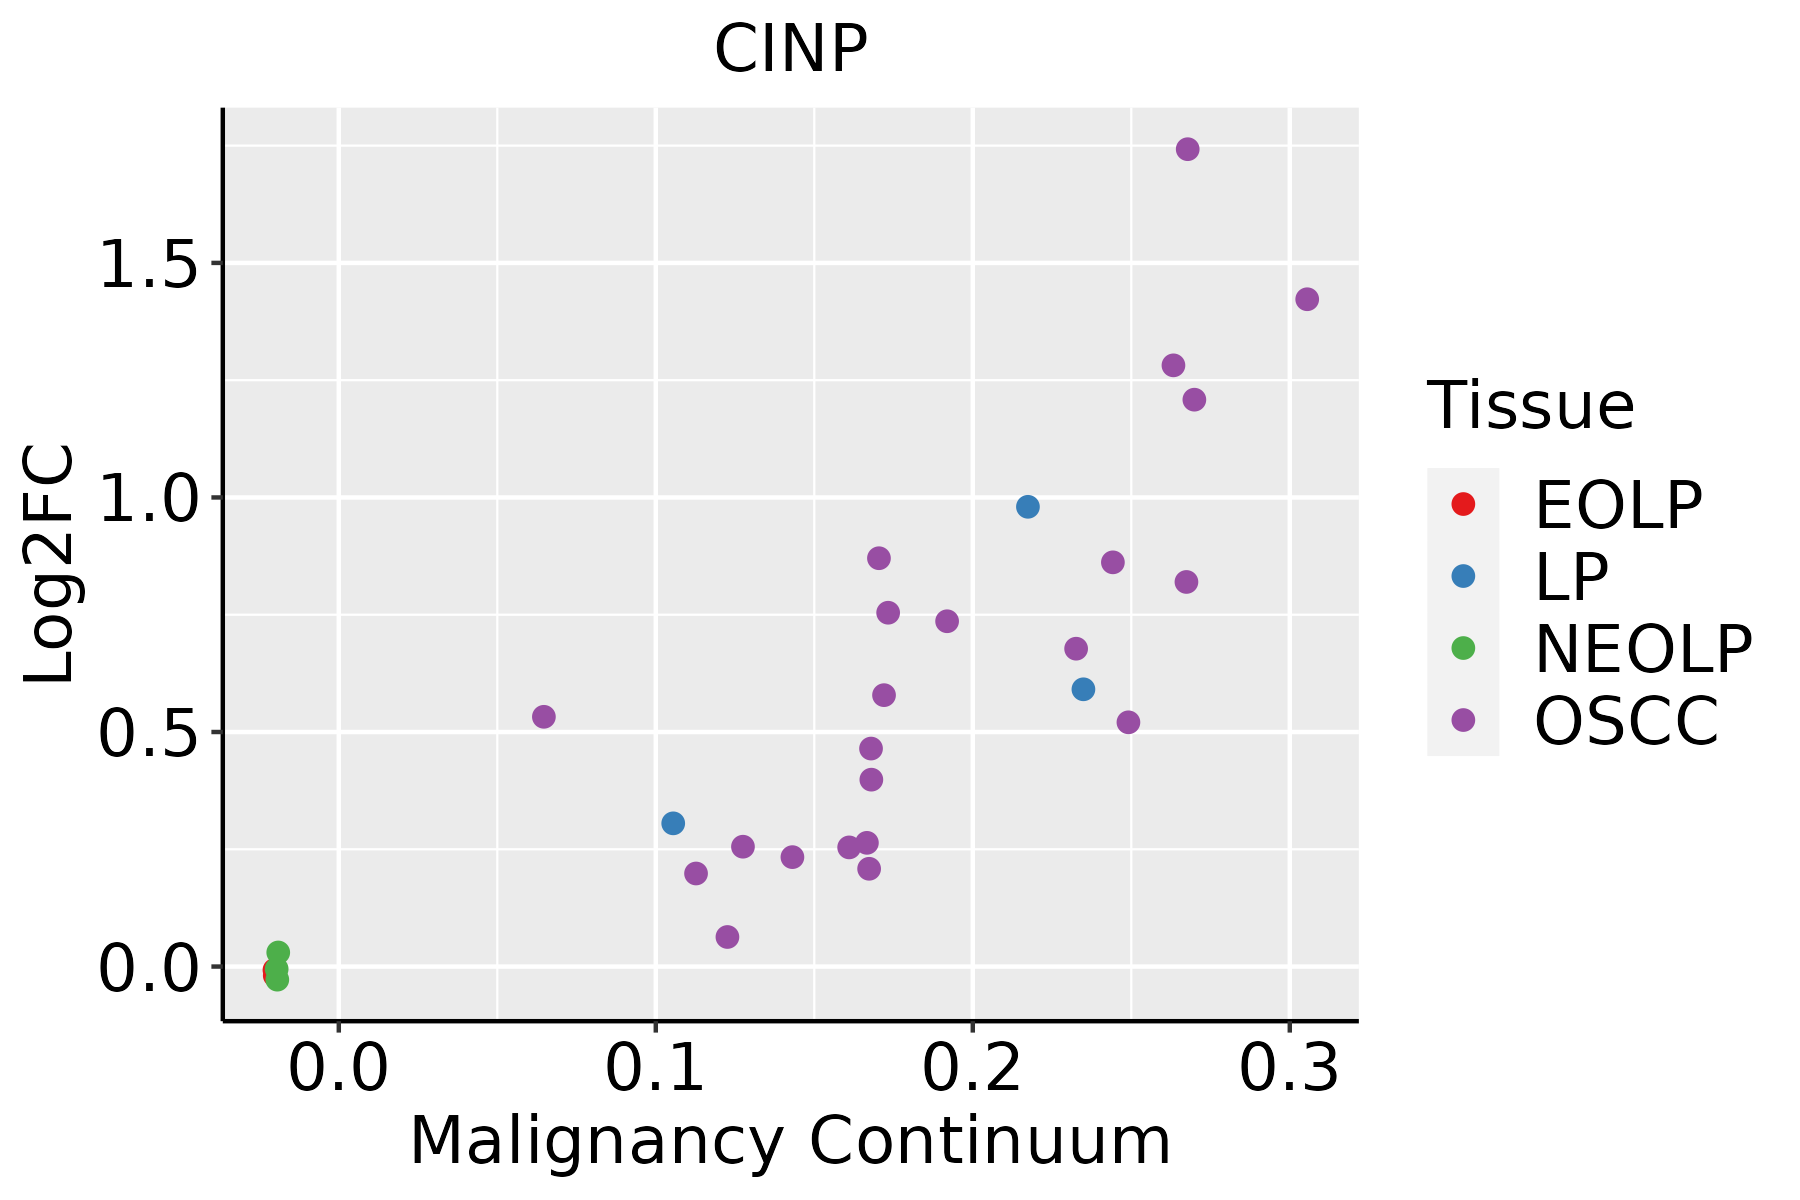 | EOLP: Erosive Oral lichen planus |
| LP: leukoplakia | ||
| NEOLP: Non-erosive oral lichen planus | ||
| OSCC: Oral squamous cell carcinoma | ||
| Skin | 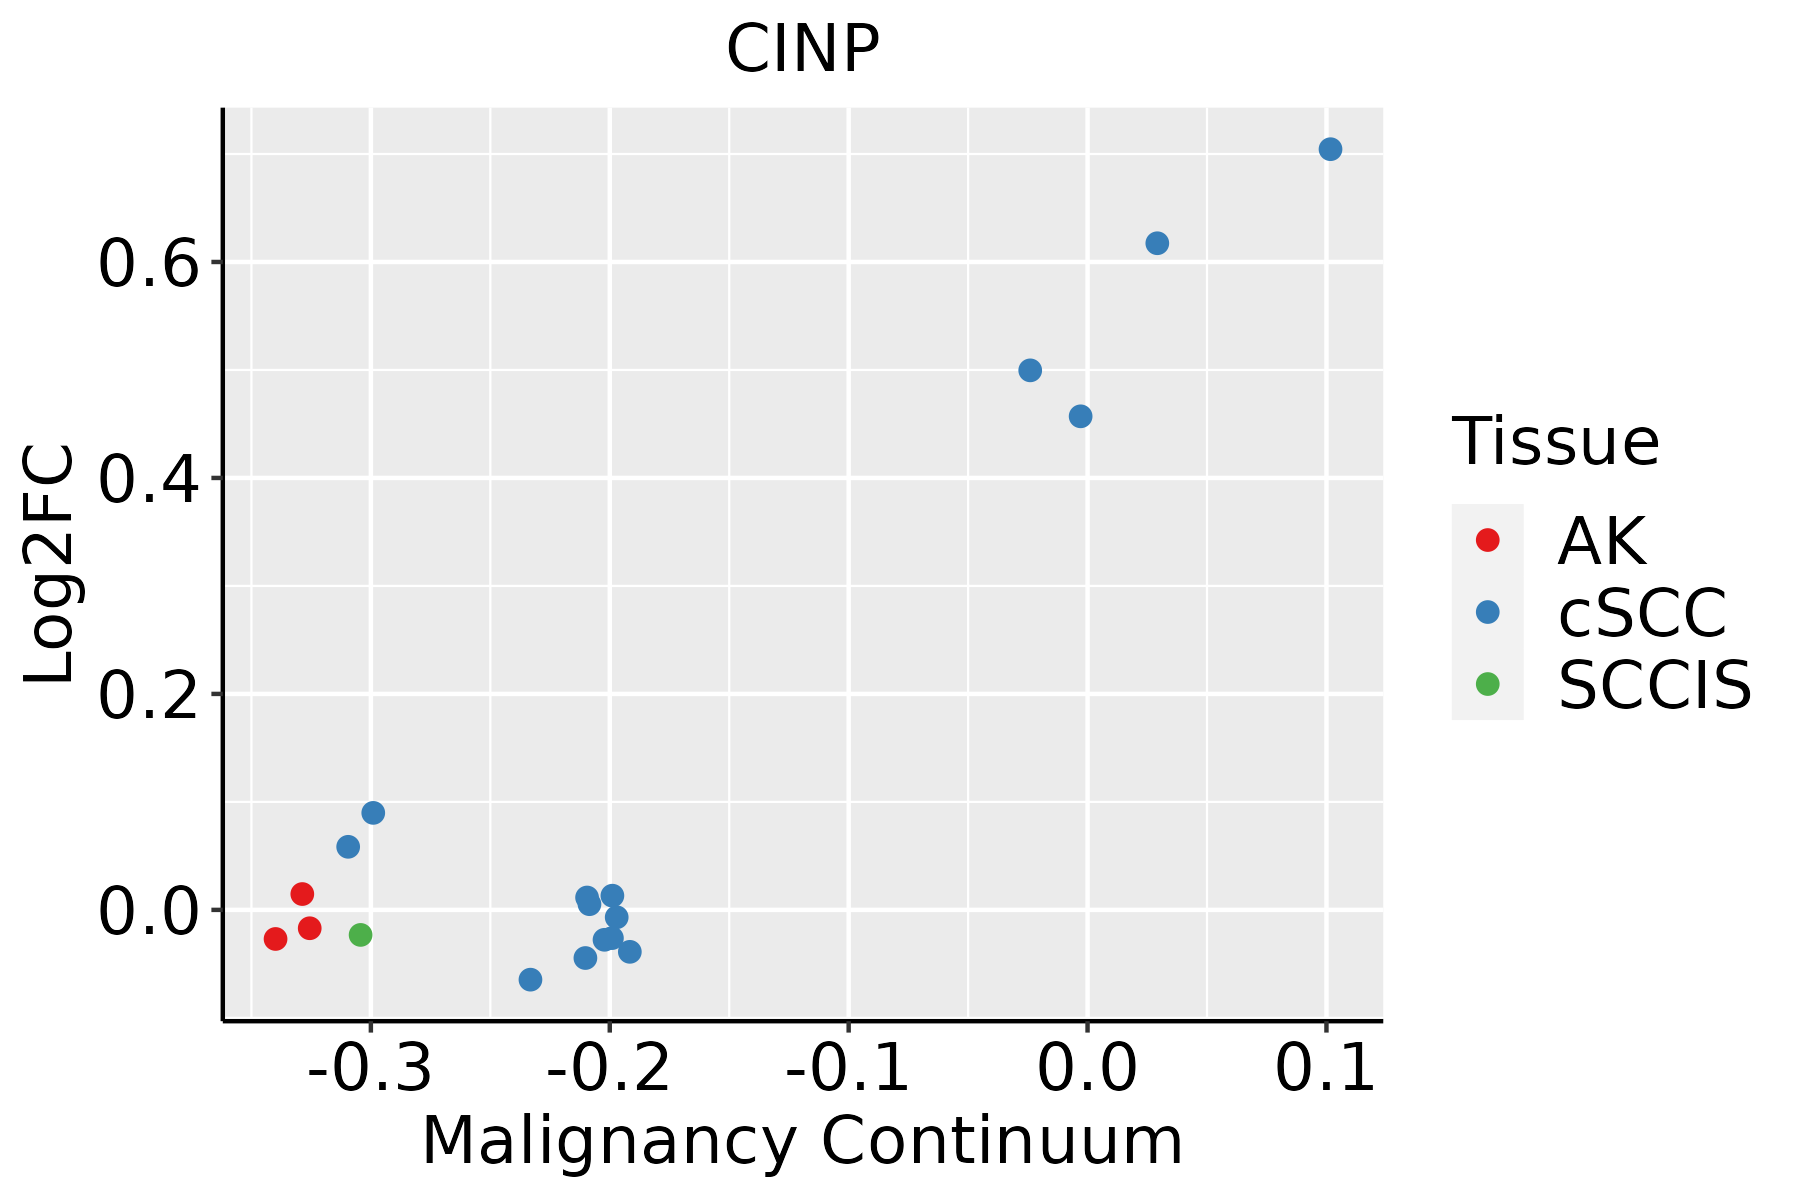 | AK: Actinic keratosis |
| cSCC: Cutaneous squamous cell carcinoma | ||
| SCCIS:squamous cell carcinoma in situ |
| ∗log2FC in expression of this searched gene in stem-like cells from each diseased tissue sample relative to stem-like cells in normal samples in each tissue plotted against the malignancy continuum. Samples are colored based on if they are from different disease stage. |
Top |
Malignant transformation related pathway analysis |
| Find out the enriched GO biological processes and KEGG pathways involved in transition from healthy to precancer to cancer |
| Tissue | Disease Stage | Enriched GO biological Processes |
| Colorectum | AD |  |
| Colorectum | SER |  |
| Colorectum | MSS |  |
| Colorectum | MSI-H |  |
| Colorectum | FAP |  |
| ∗Top 15 enriched GO BP terms are showed in the bar plot of each disease state in each tissue. Each row represents a significant GO biological process which is colored according to the -log10(p.adjust). |
| Page: 1 2 3 4 5 6 7 8 9 |
| GO ID | Tissue | Disease Stage | Description | Gene Ratio | Bg Ratio | pvalue | p.adjust | Count |
| GO:00062604 | Esophagus | ESCC | DNA replication | 181/8552 | 260/18723 | 3.55e-15 | 2.05e-13 | 181 |
| GO:00062601 | Liver | HCC | DNA replication | 146/7958 | 260/18723 | 5.68e-06 | 7.02e-05 | 146 |
| GO:00062603 | Oral cavity | OSCC | DNA replication | 159/7305 | 260/18723 | 3.25e-13 | 1.59e-11 | 159 |
| GO:000626011 | Oral cavity | LP | DNA replication | 97/4623 | 260/18723 | 3.67e-06 | 7.75e-05 | 97 |
| GO:000626012 | Skin | cSCC | DNA replication | 106/4864 | 260/18723 | 1.18e-07 | 2.77e-06 | 106 |
| Page: 1 |
| Pathway ID | Tissue | Disease Stage | Description | Gene Ratio | Bg Ratio | pvalue | p.adjust | qvalue | Count |
| Page: 1 |
Top |
Cell-cell communication analysis |
| Identification of potential cell-cell interactions between two cell types and their ligand-receptor pairs for different disease states |
| Ligand | Receptor | LRpair | Pathway | Tissue | Disease Stage |
| Page: 1 |
Top |
Single-cell gene regulatory network inference analysis |
| Find out the significant the regulons (TFs) and the target genes of each regulon across cell types for different disease states |
| TF | Cell Type | Tissue | Disease Stage | Target Gene | RSS | Regulon Activity |
| ∗The dot plots of a searched regulon are shown for all cell subpopulations in each disease state of each tissue based on the regulon specific score inferred using pySCENIC and by calculating the average expression. |
| Page: 1 |
Top |
Somatic mutation of malignant transformation related genes |
| Annotation of somatic variants for genes involved in malignant transformation |
| Hugo Symbol | Variant Class | Variant Classification | dbSNP RS | HGVSc | HGVSp | HGVSp Short | SWISSPROT | BIOTYPE | SIFT | PolyPhen | Tumor Sample Barcode | Tissue | Histology | Sex | Age | Stage | Therapy Types | Drugs | Outcome |
| CINP | SNV | Missense_Mutation | novel | c.50N>G | p.Ser17Cys | p.S17C | Q9BW66 | protein_coding | deleterious(0.03) | probably_damaging(0.996) | TCGA-AC-A5XS-01 | Breast | breast invasive carcinoma | Female | >=65 | I/II | Hormone Therapy | femara | SD |
| CINP | deletion | Frame_Shift_Del | novel | c.514delN | p.His172ThrfsTer9 | p.H172Tfs*9 | Q9BW66 | protein_coding | TCGA-D8-A27V-01 | Breast | breast invasive carcinoma | Female | <65 | I/II | Hormone Therapy | tamoxiphen | SD | ||
| CINP | SNV | Missense_Mutation | c.155N>T | p.Ala52Val | p.A52V | Q9BW66 | protein_coding | tolerated(0.9) | benign(0.022) | TCGA-AA-A010-01 | Colorectum | colon adenocarcinoma | Female | <65 | I/II | Chemotherapy | folinic | CR | |
| CINP | SNV | Missense_Mutation | c.288N>T | p.Gln96His | p.Q96H | Q9BW66 | protein_coding | tolerated(0.17) | benign(0.009) | TCGA-AZ-4615-01 | Colorectum | colon adenocarcinoma | Male | >=65 | III/IV | Chemotherapy | xeloda | PD | |
| CINP | SNV | Missense_Mutation | novel | c.114A>C | p.Glu38Asp | p.E38D | Q9BW66 | protein_coding | tolerated(0.26) | benign(0.121) | TCGA-A5-A1OF-01 | Endometrium | uterine corpus endometrioid carcinoma | Female | <65 | I/II | Unknown | Unknown | SD |
| CINP | SNV | Missense_Mutation | rs374421517 | c.416N>T | p.Thr139Met | p.T139M | Q9BW66 | protein_coding | tolerated(0.05) | possibly_damaging(0.823) | TCGA-AP-A059-01 | Endometrium | uterine corpus endometrioid carcinoma | Female | >=65 | I/II | Unknown | Unknown | SD |
| CINP | SNV | Missense_Mutation | rs202220609 | c.490C>T | p.Arg164Cys | p.R164C | Q9BW66 | protein_coding | deleterious(0.02) | possibly_damaging(0.736) | TCGA-AX-A0J1-01 | Endometrium | uterine corpus endometrioid carcinoma | Female | >=65 | I/II | Unknown | Unknown | SD |
| CINP | SNV | Missense_Mutation | c.64N>C | p.Lys22Gln | p.K22Q | Q9BW66 | protein_coding | deleterious(0) | possibly_damaging(0.799) | TCGA-D1-A16X-01 | Endometrium | uterine corpus endometrioid carcinoma | Female | <65 | I/II | Unknown | Unknown | SD | |
| CINP | SNV | Missense_Mutation | novel | c.65N>C | p.Lys22Thr | p.K22T | Q9BW66 | protein_coding | deleterious(0) | probably_damaging(0.974) | TCGA-DF-A2KU-01 | Endometrium | uterine corpus endometrioid carcinoma | Female | Unknown | I/II | Unknown | Unknown | SD |
| CINP | SNV | Missense_Mutation | rs562361918 | c.76N>G | p.Asn26Asp | p.N26D | Q9BW66 | protein_coding | deleterious(0.04) | probably_damaging(0.933) | TCGA-EY-A1GD-01 | Endometrium | uterine corpus endometrioid carcinoma | Female | <65 | I/II | Unknown | Unknown | SD |
| Page: 1 2 |
Top |
Related drugs of malignant transformation related genes |
| Identification of chemicals and drugs interact with genes involved in malignant transfromation |
| (DGIdb 4.0) |
| Entrez ID | Symbol | Category | Interaction Types | Drug Claim Name | Drug Name | PMIDs |
| Page: 1 |

Copyright 2023-Present -The University of Texas Health Science Center at Houston |