
|
|||||
|
 | |
| |
| |
| |
| |
| |
|
Gene: CIITA |
Gene summary for CIITA |
| Gene information | Species | Human | Gene symbol | CIITA | Gene ID | 4261 |
| Gene name | class II major histocompatibility complex transactivator | |
| Gene Alias | C2TA | |
| Cytomap | 16p13.13 | |
| Gene Type | protein-coding | GO ID | GO:0000122 | UniProtAcc | A0A0B4J1S1 |
Top |
Malignant transformation analysis |
| Identification of the aberrant gene expression in precancerous and cancerous lesions by comparing the gene expression of stem-like cells in diseased tissues with normal stem cells |
| Entrez ID | Symbol | Replicates | Species | Organ | Tissue | Adj P-value | Log2FC | Malignancy |
| 4261 | CIITA | C30 | Human | Oral cavity | OSCC | 2.68e-15 | 6.24e-01 | 0.3055 |
| 4261 | CIITA | C46 | Human | Oral cavity | OSCC | 1.57e-02 | 1.39e-01 | 0.1673 |
| 4261 | CIITA | EOLP-1 | Human | Oral cavity | EOLP | 3.20e-14 | 5.02e-01 | -0.0202 |
| 4261 | CIITA | NEOLP-3 | Human | Oral cavity | NEOLP | 8.35e-04 | 1.16e-01 | -0.0191 |
| 4261 | CIITA | SYSMH2 | Human | Oral cavity | OSCC | 4.24e-06 | 2.01e-01 | 0.2326 |
| 4261 | CIITA | SYSMH3 | Human | Oral cavity | OSCC | 4.33e-08 | 1.73e-01 | 0.2442 |
| Page: 1 |
| Tissue | Expression Dynamics | Abbreviation |
| Oral Cavity | 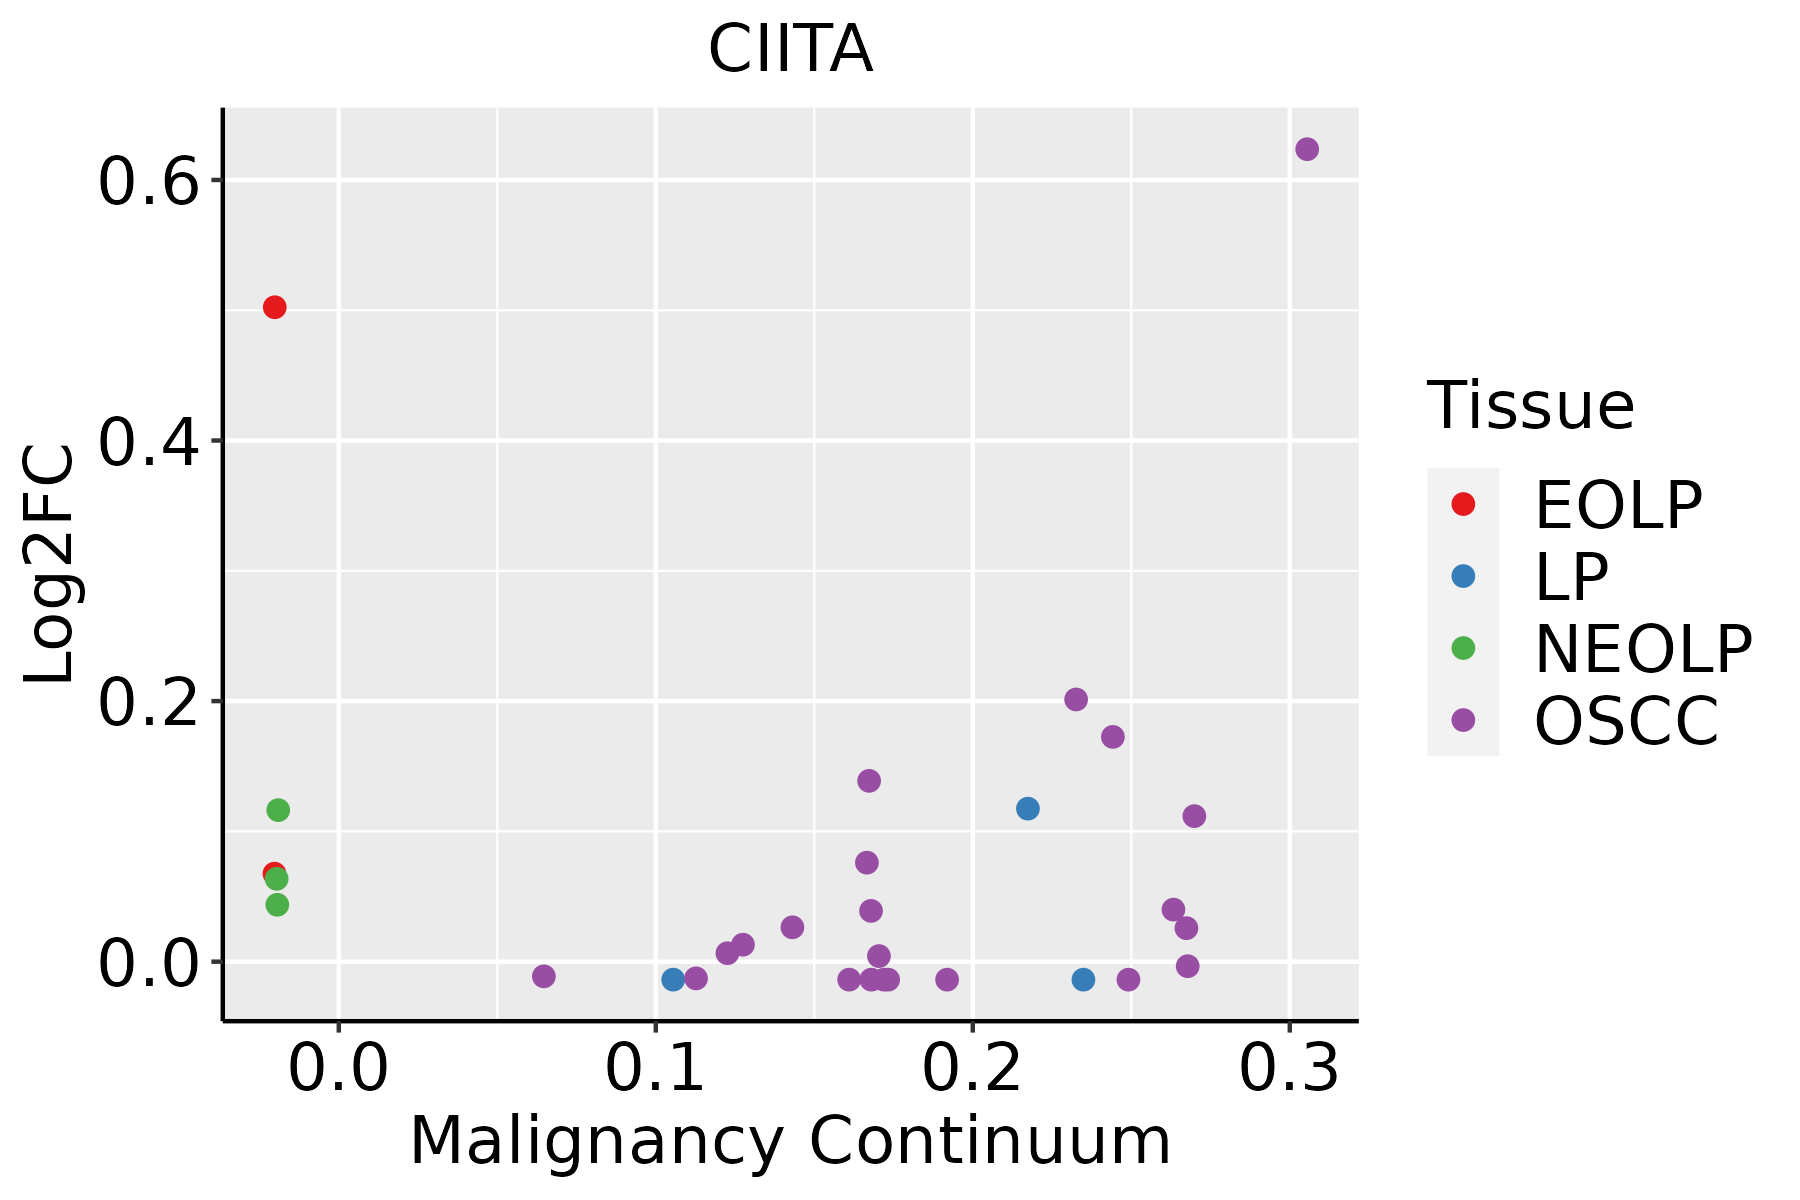 | EOLP: Erosive Oral lichen planus |
| LP: leukoplakia | ||
| NEOLP: Non-erosive oral lichen planus | ||
| OSCC: Oral squamous cell carcinoma |
| ∗log2FC in expression of this searched gene in stem-like cells from each diseased tissue sample relative to stem-like cells in normal samples in each tissue plotted against the malignancy continuum. Samples are colored based on if they are from different disease stage. |
Top |
Malignant transformation related pathway analysis |
| Find out the enriched GO biological processes and KEGG pathways involved in transition from healthy to precancer to cancer |
| Tissue | Disease Stage | Enriched GO biological Processes |
| Colorectum | AD |  |
| Colorectum | SER |  |
| Colorectum | MSS |  |
| Colorectum | MSI-H |  |
| Colorectum | FAP |  |
| ∗Top 15 enriched GO BP terms are showed in the bar plot of each disease state in each tissue. Each row represents a significant GO biological process which is colored according to the -log10(p.adjust). |
| Page: 1 2 3 4 5 6 7 8 9 |
| GO ID | Tissue | Disease Stage | Description | Gene Ratio | Bg Ratio | pvalue | p.adjust | Count |
| GO:001603220 | Oral cavity | OSCC | viral process | 274/7305 | 415/18723 | 2.42e-29 | 1.70e-26 | 274 |
| GO:001905820 | Oral cavity | OSCC | viral life cycle | 208/7305 | 317/18723 | 4.59e-22 | 1.00e-19 | 208 |
| GO:004440320 | Oral cavity | OSCC | biological process involved in symbiotic interaction | 173/7305 | 290/18723 | 6.80e-13 | 3.19e-11 | 173 |
| GO:005079220 | Oral cavity | OSCC | regulation of viral process | 109/7305 | 164/18723 | 8.95e-13 | 4.10e-11 | 109 |
| GO:190390020 | Oral cavity | OSCC | regulation of viral life cycle | 97/7305 | 148/18723 | 5.34e-11 | 1.67e-09 | 97 |
| GO:005170120 | Oral cavity | OSCC | biological process involved in interaction with host | 125/7305 | 203/18723 | 5.60e-11 | 1.74e-09 | 125 |
| GO:005212620 | Oral cavity | OSCC | movement in host environment | 106/7305 | 175/18723 | 5.84e-09 | 1.26e-07 | 106 |
| GO:004440920 | Oral cavity | OSCC | entry into host | 86/7305 | 151/18723 | 5.74e-06 | 6.37e-05 | 86 |
| GO:00343417 | Oral cavity | OSCC | response to interferon-gamma | 81/7305 | 141/18723 | 6.77e-06 | 7.43e-05 | 81 |
| GO:00485259 | Oral cavity | OSCC | negative regulation of viral process | 56/7305 | 92/18723 | 1.77e-05 | 1.72e-04 | 56 |
| GO:004671820 | Oral cavity | OSCC | viral entry into host cell | 81/7305 | 144/18723 | 1.98e-05 | 1.89e-04 | 81 |
| GO:00466773 | Oral cavity | OSCC | response to antibiotic | 32/7305 | 47/18723 | 5.11e-05 | 4.27e-04 | 32 |
| GO:004390319 | Oral cavity | OSCC | regulation of biological process involved in symbiotic interaction | 44/7305 | 72/18723 | 1.20e-04 | 8.57e-04 | 44 |
| GO:0032963 | Oral cavity | OSCC | collagen metabolic process | 54/7305 | 104/18723 | 5.00e-03 | 1.96e-02 | 54 |
| GO:005237217 | Oral cavity | OSCC | modulation by symbiont of entry into host | 28/7305 | 49/18723 | 7.63e-03 | 2.79e-02 | 28 |
| GO:001603226 | Oral cavity | EOLP | viral process | 94/2218 | 415/18723 | 2.93e-10 | 2.58e-08 | 94 |
| GO:001905826 | Oral cavity | EOLP | viral life cycle | 72/2218 | 317/18723 | 3.11e-08 | 1.24e-06 | 72 |
| GO:003434121 | Oral cavity | EOLP | response to interferon-gamma | 36/2218 | 141/18723 | 5.44e-06 | 1.08e-04 | 36 |
| GO:005079224 | Oral cavity | EOLP | regulation of viral process | 39/2218 | 164/18723 | 1.40e-05 | 2.35e-04 | 39 |
| GO:004440325 | Oral cavity | EOLP | biological process involved in symbiotic interaction | 57/2218 | 290/18723 | 7.75e-05 | 9.39e-04 | 57 |
| Page: 1 2 3 |
| Pathway ID | Tissue | Disease Stage | Description | Gene Ratio | Bg Ratio | pvalue | p.adjust | qvalue | Count |
| hsa0516418 | Oral cavity | OSCC | Influenza A | 116/3704 | 171/8465 | 1.23e-10 | 1.78e-09 | 9.08e-10 | 116 |
| hsa0514520 | Oral cavity | OSCC | Toxoplasmosis | 75/3704 | 112/8465 | 5.28e-07 | 3.16e-06 | 1.61e-06 | 75 |
| hsa051526 | Oral cavity | OSCC | Tuberculosis | 105/3704 | 180/8465 | 5.00e-05 | 2.04e-04 | 1.04e-04 | 105 |
| hsa0461229 | Oral cavity | OSCC | Antigen processing and presentation | 47/3704 | 78/8465 | 2.37e-03 | 6.35e-03 | 3.23e-03 | 47 |
| hsa0516419 | Oral cavity | OSCC | Influenza A | 116/3704 | 171/8465 | 1.23e-10 | 1.78e-09 | 9.08e-10 | 116 |
| hsa05145110 | Oral cavity | OSCC | Toxoplasmosis | 75/3704 | 112/8465 | 5.28e-07 | 3.16e-06 | 1.61e-06 | 75 |
| hsa0515211 | Oral cavity | OSCC | Tuberculosis | 105/3704 | 180/8465 | 5.00e-05 | 2.04e-04 | 1.04e-04 | 105 |
| hsa04612113 | Oral cavity | OSCC | Antigen processing and presentation | 47/3704 | 78/8465 | 2.37e-03 | 6.35e-03 | 3.23e-03 | 47 |
| hsa0516442 | Oral cavity | EOLP | Influenza A | 58/1218 | 171/8465 | 7.01e-11 | 3.23e-09 | 1.91e-09 | 58 |
| hsa0514542 | Oral cavity | EOLP | Toxoplasmosis | 41/1218 | 112/8465 | 3.50e-09 | 6.74e-08 | 3.98e-08 | 41 |
| hsa0461244 | Oral cavity | EOLP | Antigen processing and presentation | 29/1218 | 78/8465 | 4.69e-07 | 4.78e-06 | 2.82e-06 | 29 |
| hsa0515241 | Oral cavity | EOLP | Tuberculosis | 47/1218 | 180/8465 | 2.19e-05 | 1.18e-04 | 6.96e-05 | 47 |
| hsa0516452 | Oral cavity | EOLP | Influenza A | 58/1218 | 171/8465 | 7.01e-11 | 3.23e-09 | 1.91e-09 | 58 |
| hsa0514552 | Oral cavity | EOLP | Toxoplasmosis | 41/1218 | 112/8465 | 3.50e-09 | 6.74e-08 | 3.98e-08 | 41 |
| hsa0461254 | Oral cavity | EOLP | Antigen processing and presentation | 29/1218 | 78/8465 | 4.69e-07 | 4.78e-06 | 2.82e-06 | 29 |
| hsa0515251 | Oral cavity | EOLP | Tuberculosis | 47/1218 | 180/8465 | 2.19e-05 | 1.18e-04 | 6.96e-05 | 47 |
| hsa0516461 | Oral cavity | NEOLP | Influenza A | 43/1112 | 171/8465 | 1.38e-05 | 1.22e-04 | 7.68e-05 | 43 |
| hsa0461261 | Oral cavity | NEOLP | Antigen processing and presentation | 20/1112 | 78/8465 | 2.09e-03 | 9.00e-03 | 5.66e-03 | 20 |
| hsa0514561 | Oral cavity | NEOLP | Toxoplasmosis | 24/1112 | 112/8465 | 9.65e-03 | 3.30e-02 | 2.08e-02 | 24 |
| hsa0516471 | Oral cavity | NEOLP | Influenza A | 43/1112 | 171/8465 | 1.38e-05 | 1.22e-04 | 7.68e-05 | 43 |
| Page: 1 2 |
Top |
Cell-cell communication analysis |
| Identification of potential cell-cell interactions between two cell types and their ligand-receptor pairs for different disease states |
| Ligand | Receptor | LRpair | Pathway | Tissue | Disease Stage |
| Page: 1 |
Top |
Single-cell gene regulatory network inference analysis |
| Find out the significant the regulons (TFs) and the target genes of each regulon across cell types for different disease states |
| TF | Cell Type | Tissue | Disease Stage | Target Gene | RSS | Regulon Activity |
| ∗The dot plots of a searched regulon are shown for all cell subpopulations in each disease state of each tissue based on the regulon specific score inferred using pySCENIC and by calculating the average expression. |
| Page: 1 |
Top |
Somatic mutation of malignant transformation related genes |
| Annotation of somatic variants for genes involved in malignant transformation |
| Hugo Symbol | Variant Class | Variant Classification | dbSNP RS | HGVSc | HGVSp | HGVSp Short | SWISSPROT | BIOTYPE | SIFT | PolyPhen | Tumor Sample Barcode | Tissue | Histology | Sex | Age | Stage | Therapy Types | Drugs | Outcome |
| CIITA | SNV | Missense_Mutation | c.253N>T | p.Met85Leu | p.M85L | protein_coding | tolerated(0.07) | benign(0.007) | TCGA-A2-A0YF-01 | Breast | breast invasive carcinoma | Female | >=65 | I/II | Unspecific | Arimidex | SD | ||
| CIITA | SNV | Missense_Mutation | rs767378495 | c.181N>A | p.Glu61Lys | p.E61K | protein_coding | deleterious(0) | possibly_damaging(0.714) | TCGA-AC-A5XS-01 | Breast | breast invasive carcinoma | Female | >=65 | I/II | Hormone Therapy | femara | SD | |
| CIITA | SNV | Missense_Mutation | rs369744959 | c.2945N>T | p.Thr982Met | p.T982M | protein_coding | tolerated(0.09) | benign(0.01) | TCGA-C8-A1HM-01 | Breast | breast invasive carcinoma | Female | >=65 | I/II | Chemotherapy | doxorubicin | CR | |
| CIITA | SNV | Missense_Mutation | c.3244T>C | p.Tyr1082His | p.Y1082H | protein_coding | deleterious(0) | benign(0.138) | TCGA-D8-A1XK-01 | Breast | breast invasive carcinoma | Female | <65 | I/II | Chemotherapy | doxorubicine+cyclophosphamide | SD | ||
| CIITA | SNV | Missense_Mutation | c.270N>C | p.Glu90Asp | p.E90D | protein_coding | tolerated(0.22) | possibly_damaging(0.69) | TCGA-D8-A27G-01 | Breast | breast invasive carcinoma | Female | >=65 | I/II | Unknown | Unknown | SD | ||
| CIITA | insertion | Frame_Shift_Ins | novel | c.3301_3302insTCCAGGGTTCAGAGATTGCAAAACCCCCATCTAGTTTCTG | p.Pro1101LeufsTer65 | p.P1101Lfs*65 | protein_coding | TCGA-BH-A0DS-01 | Breast | breast invasive carcinoma | Female | >=65 | III/IV | Chemotherapy | cyclophosphamide | SD | |||
| CIITA | SNV | Missense_Mutation | novel | c.1394G>A | p.Gly465Asp | p.G465D | protein_coding | tolerated(0.3) | benign(0.001) | TCGA-2W-A8YY-01 | Cervix | cervical & endocervical cancer | Female | <65 | I/II | Chemotherapy | cisplatin | CR | |
| CIITA | SNV | Missense_Mutation | rs548646642 | c.2182G>A | p.Glu728Lys | p.E728K | protein_coding | deleterious(0) | benign(0.314) | TCGA-2W-A8YY-01 | Cervix | cervical & endocervical cancer | Female | <65 | I/II | Chemotherapy | cisplatin | CR | |
| CIITA | SNV | Missense_Mutation | c.2954N>T | p.Ser985Phe | p.S985F | protein_coding | deleterious(0.02) | possibly_damaging(0.861) | TCGA-EX-A69L-01 | Cervix | cervical & endocervical cancer | Female | <65 | I/II | Unknown | Unknown | SD | ||
| CIITA | SNV | Missense_Mutation | novel | c.2935C>T | p.Arg979Trp | p.R979W | protein_coding | deleterious(0) | possibly_damaging(0.655) | TCGA-5M-AAT6-01 | Colorectum | colon adenocarcinoma | Female | <65 | III/IV | Unknown | Unknown | PD |
| Page: 1 2 3 4 5 6 7 8 9 10 11 12 13 |
Top |
Related drugs of malignant transformation related genes |
| Identification of chemicals and drugs interact with genes involved in malignant transfromation |
| (DGIdb 4.0) |
| Entrez ID | Symbol | Category | Interaction Types | Drug Claim Name | Drug Name | PMIDs |
| Page: 1 |

Copyright 2023-Present -The University of Texas Health Science Center at Houston |