
|
|||||
|
 | |
| |
| |
| |
| |
| |
|
Gene: CIDEC |
Gene summary for CIDEC |
| Gene information | Species | Human | Gene symbol | CIDEC | Gene ID | 63924 |
| Gene name | cell death inducing DFFA like effector c | |
| Gene Alias | CIDE-3 | |
| Cytomap | 3p25.3 | |
| Gene Type | protein-coding | GO ID | GO:0006915 | UniProtAcc | Q96AQ7 |
Top |
Malignant transformation analysis |
| Identification of the aberrant gene expression in precancerous and cancerous lesions by comparing the gene expression of stem-like cells in diseased tissues with normal stem cells |
| Entrez ID | Symbol | Replicates | Species | Organ | Tissue | Adj P-value | Log2FC | Malignancy |
| 63924 | CIDEC | HCC2 | Human | Liver | HCC | 6.20e-03 | 2.12e+00 | 0.5341 |
| 63924 | CIDEC | S027 | Human | Liver | HCC | 4.46e-04 | 2.99e-01 | 0.2446 |
| 63924 | CIDEC | S028 | Human | Liver | HCC | 1.83e-12 | 6.18e-01 | 0.2503 |
| 63924 | CIDEC | S029 | Human | Liver | HCC | 3.10e-20 | 9.93e-01 | 0.2581 |
| 63924 | CIDEC | Pat01-B | Human | Stomach | GC | 3.52e-35 | 6.15e-01 | 0.5754 |
| 63924 | CIDEC | Pat02-B | Human | Stomach | GC | 9.13e-06 | 1.70e-01 | 0.0368 |
| 63924 | CIDEC | Pat03-B | Human | Stomach | GC | 3.41e-19 | 4.35e-01 | 0.3693 |
| 63924 | CIDEC | Pat12-B | Human | Stomach | GC | 4.88e-02 | 1.37e-01 | 0.0325 |
| 63924 | CIDEC | Pat17-B | Human | Stomach | GC | 1.22e-15 | 4.29e-01 | 0.3109 |
| 63924 | CIDEC | SIM_4 | Human | Stomach | SIM | 2.98e-02 | 2.06e-01 | 0.2664 |
| Page: 1 |
| Tissue | Expression Dynamics | Abbreviation |
| GC | 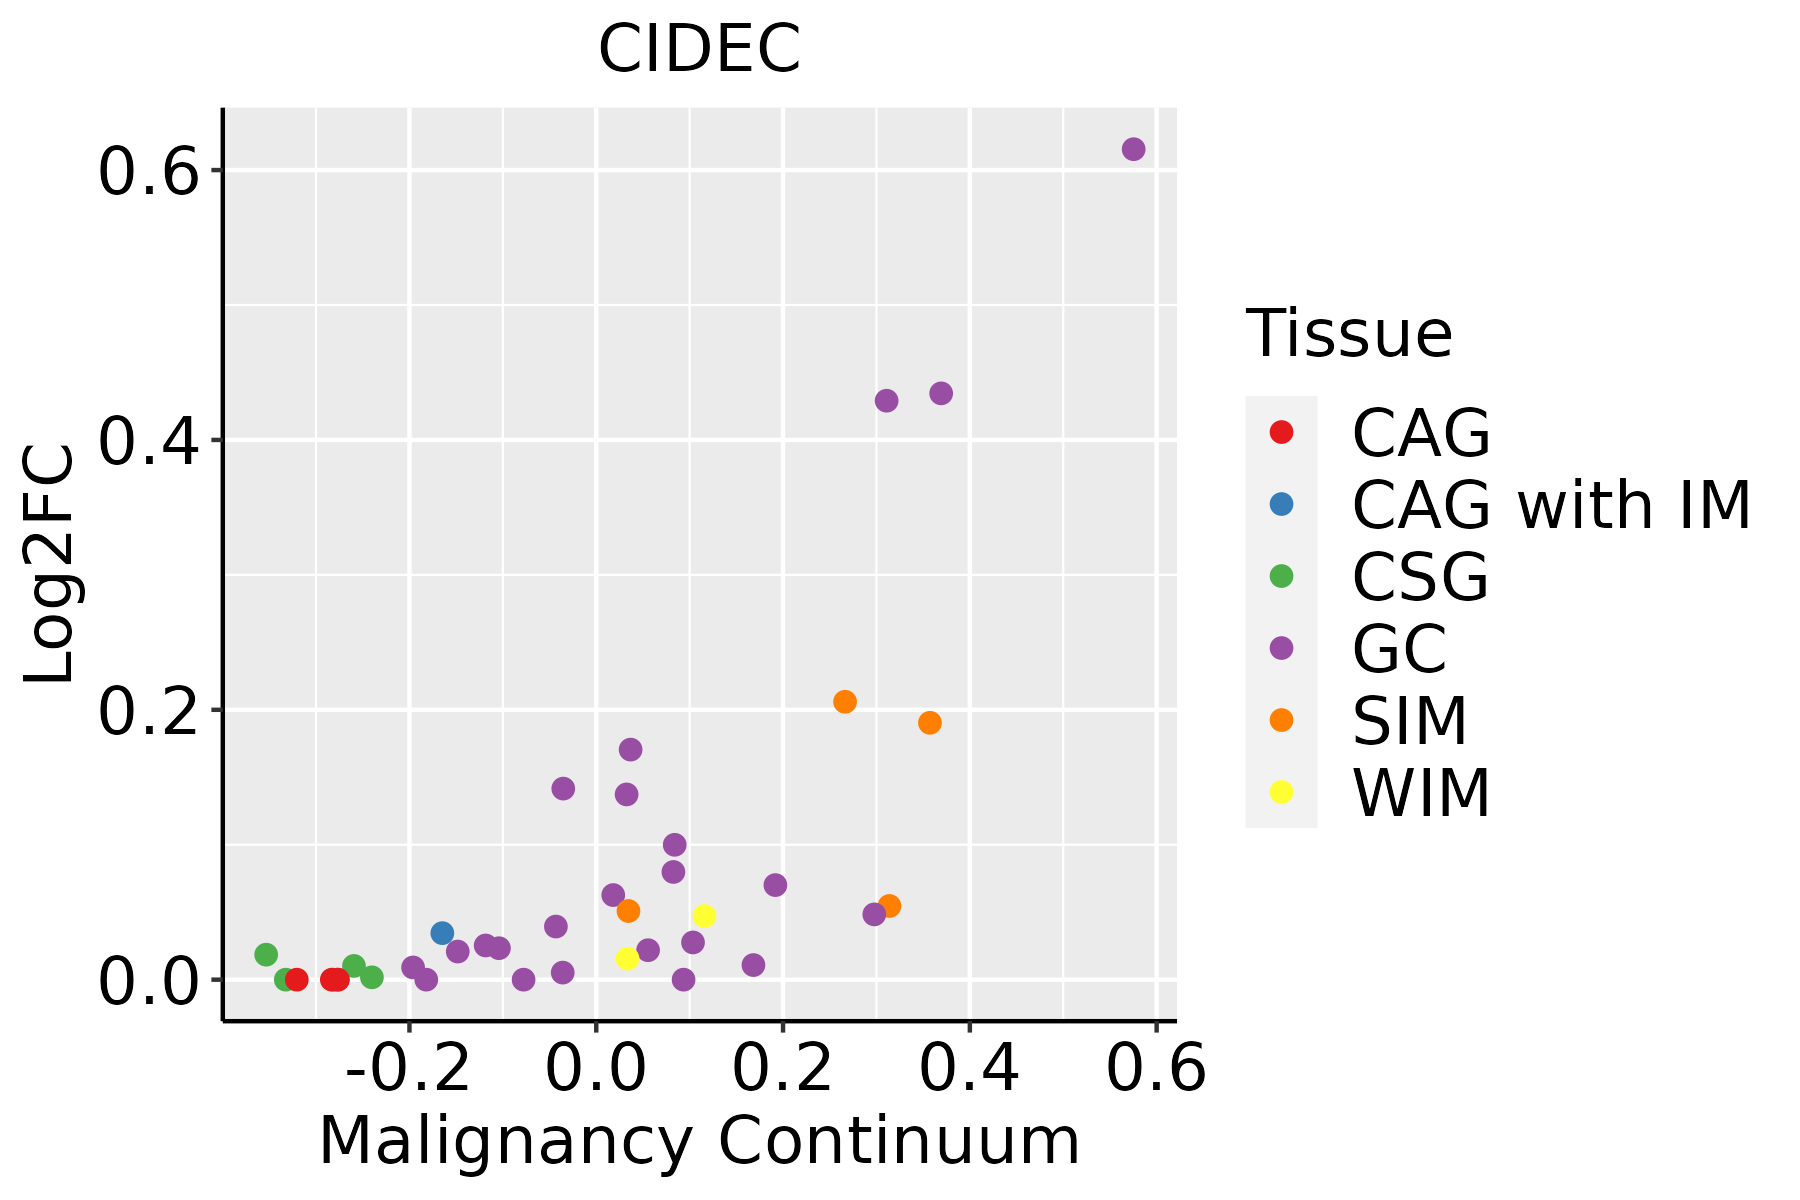 | CAG: Chronic atrophic gastritis |
| CAG with IM: Chronic atrophic gastritis with intestinal metaplasia | ||
| CSG: Chronic superficial gastritis | ||
| GC: Gastric cancer | ||
| SIM: Severe intestinal metaplasia | ||
| WIM: Wild intestinal metaplasia | ||
| Liver |  | HCC: Hepatocellular carcinoma |
| NAFLD: Non-alcoholic fatty liver disease |
| ∗log2FC in expression of this searched gene in stem-like cells from each diseased tissue sample relative to stem-like cells in normal samples in each tissue plotted against the malignancy continuum. Samples are colored based on if they are from different disease stage. |
Top |
Malignant transformation related pathway analysis |
| Find out the enriched GO biological processes and KEGG pathways involved in transition from healthy to precancer to cancer |
| Tissue | Disease Stage | Enriched GO biological Processes |
| Colorectum | AD |  |
| Colorectum | SER |  |
| Colorectum | MSS |  |
| Colorectum | MSI-H |  |
| Colorectum | FAP |  |
| ∗Top 15 enriched GO BP terms are showed in the bar plot of each disease state in each tissue. Each row represents a significant GO biological process which is colored according to the -log10(p.adjust). |
| Page: 1 2 3 4 5 6 7 8 9 |
| GO ID | Tissue | Disease Stage | Description | Gene Ratio | Bg Ratio | pvalue | p.adjust | Count |
| GO:0097194 | Liver | HCC | execution phase of apoptosis | 48/7958 | 85/18723 | 6.47e-03 | 2.63e-02 | 48 |
| Page: 1 |
| Pathway ID | Tissue | Disease Stage | Description | Gene Ratio | Bg Ratio | pvalue | p.adjust | qvalue | Count |
| Page: 1 |
Top |
Cell-cell communication analysis |
| Identification of potential cell-cell interactions between two cell types and their ligand-receptor pairs for different disease states |
| Ligand | Receptor | LRpair | Pathway | Tissue | Disease Stage |
| Page: 1 |
Top |
Single-cell gene regulatory network inference analysis |
| Find out the significant the regulons (TFs) and the target genes of each regulon across cell types for different disease states |
| TF | Cell Type | Tissue | Disease Stage | Target Gene | RSS | Regulon Activity |
| ∗The dot plots of a searched regulon are shown for all cell subpopulations in each disease state of each tissue based on the regulon specific score inferred using pySCENIC and by calculating the average expression. |
| Page: 1 |
Top |
Somatic mutation of malignant transformation related genes |
| Annotation of somatic variants for genes involved in malignant transformation |
| Hugo Symbol | Variant Class | Variant Classification | dbSNP RS | HGVSc | HGVSp | HGVSp Short | SWISSPROT | BIOTYPE | SIFT | PolyPhen | Tumor Sample Barcode | Tissue | Histology | Sex | Age | Stage | Therapy Types | Drugs | Outcome |
| CIDEC | SNV | Missense_Mutation | novel | c.443C>T | p.Ala148Val | p.A148V | protein_coding | tolerated(0.25) | benign(0.012) | TCGA-2W-A8YY-01 | Cervix | cervical & endocervical cancer | Female | <65 | I/II | Chemotherapy | cisplatin | CR | |
| CIDEC | SNV | Missense_Mutation | rs750395115 | c.298G>A | p.Glu100Lys | p.E100K | protein_coding | deleterious(0.01) | benign(0.422) | TCGA-EK-A2RK-01 | Cervix | cervical & endocervical cancer | Female | >=65 | I/II | Unknown | Unknown | SD | |
| CIDEC | SNV | Missense_Mutation | novel | c.659N>T | p.Cys220Phe | p.C220F | protein_coding | tolerated(0.08) | possibly_damaging(0.681) | TCGA-AA-3982-01 | Colorectum | colon adenocarcinoma | Male | >=65 | III/IV | Unknown | Unknown | SD | |
| CIDEC | SNV | Missense_Mutation | c.350N>G | p.Asp117Gly | p.D117G | protein_coding | tolerated(0.24) | benign(0.005) | TCGA-AM-5821-01 | Colorectum | colon adenocarcinoma | Female | >=65 | I/II | Unknown | Unknown | SD | ||
| CIDEC | SNV | Missense_Mutation | novel | c.107N>A | p.Arg36His | p.R36H | protein_coding | tolerated(0.54) | benign(0.282) | TCGA-A5-A0G1-01 | Endometrium | uterine corpus endometrioid carcinoma | Female | >=65 | I/II | Unknown | Unknown | SD | |
| CIDEC | SNV | Missense_Mutation | novel | c.673N>T | p.Leu225Phe | p.L225F | protein_coding | tolerated(0.06) | benign(0.299) | TCGA-A5-A0G2-01 | Endometrium | uterine corpus endometrioid carcinoma | Female | <65 | III/IV | Unknown | Unknown | SD | |
| CIDEC | SNV | Missense_Mutation | rs368830294 | c.527N>T | p.Ala176Val | p.A176V | protein_coding | deleterious(0.01) | benign(0.401) | TCGA-A5-A0G2-01 | Endometrium | uterine corpus endometrioid carcinoma | Female | <65 | III/IV | Unknown | Unknown | SD | |
| CIDEC | SNV | Missense_Mutation | rs774200069 | c.679N>A | p.Asp227Asn | p.D227N | protein_coding | deleterious(0.03) | benign(0.141) | TCGA-A5-A1OF-01 | Endometrium | uterine corpus endometrioid carcinoma | Female | <65 | I/II | Unknown | Unknown | SD | |
| CIDEC | SNV | Missense_Mutation | rs764297186 | c.49G>A | p.Ala17Thr | p.A17T | protein_coding | deleterious(0) | probably_damaging(0.999) | TCGA-AX-A2HC-01 | Endometrium | uterine corpus endometrioid carcinoma | Female | <65 | III/IV | Chemotherapy | paclitaxel | PD | |
| CIDEC | SNV | Missense_Mutation | rs774200069 | c.679G>A | p.Asp227Asn | p.D227N | protein_coding | deleterious(0.03) | benign(0.141) | TCGA-AX-A2HD-01 | Endometrium | uterine corpus endometrioid carcinoma | Female | >=65 | III/IV | Unknown | Unknown | SD |
| Page: 1 2 3 |
Top |
Related drugs of malignant transformation related genes |
| Identification of chemicals and drugs interact with genes involved in malignant transfromation |
| (DGIdb 4.0) |
| Entrez ID | Symbol | Category | Interaction Types | Drug Claim Name | Drug Name | PMIDs |
| Page: 1 |

Copyright 2023-Present -The University of Texas Health Science Center at Houston |