
|
|||||
|
 | |
| |
| |
| |
| |
| |
|
Gene: CIC |
Gene summary for CIC |
| Gene information | Species | Human | Gene symbol | CIC | Gene ID | 23152 |
| Gene name | capicua transcriptional repressor | |
| Gene Alias | MRD45 | |
| Cytomap | 19q13.2 | |
| Gene Type | protein-coding | GO ID | GO:0003008 | UniProtAcc | Q96RK0 |
Top |
Malignant transformation analysis |
| Identification of the aberrant gene expression in precancerous and cancerous lesions by comparing the gene expression of stem-like cells in diseased tissues with normal stem cells |
| Entrez ID | Symbol | Replicates | Species | Organ | Tissue | Adj P-value | Log2FC | Malignancy |
| 23152 | CIC | LZE8T | Human | Esophagus | ESCC | 7.56e-05 | 4.99e-02 | 0.067 |
| 23152 | CIC | LZE24T | Human | Esophagus | ESCC | 6.72e-11 | 1.52e-01 | 0.0596 |
| 23152 | CIC | LZE6T | Human | Esophagus | ESCC | 2.69e-02 | 4.85e-02 | 0.0845 |
| 23152 | CIC | P1T-E | Human | Esophagus | ESCC | 2.45e-07 | 3.24e-01 | 0.0875 |
| 23152 | CIC | P2T-E | Human | Esophagus | ESCC | 4.14e-16 | 1.71e-01 | 0.1177 |
| 23152 | CIC | P4T-E | Human | Esophagus | ESCC | 1.61e-06 | 2.37e-02 | 0.1323 |
| 23152 | CIC | P5T-E | Human | Esophagus | ESCC | 4.79e-11 | -1.28e-02 | 0.1327 |
| 23152 | CIC | P8T-E | Human | Esophagus | ESCC | 2.06e-29 | 5.12e-01 | 0.0889 |
| 23152 | CIC | P9T-E | Human | Esophagus | ESCC | 4.31e-06 | -4.08e-03 | 0.1131 |
| 23152 | CIC | P10T-E | Human | Esophagus | ESCC | 2.53e-24 | 4.51e-01 | 0.116 |
| 23152 | CIC | P11T-E | Human | Esophagus | ESCC | 2.25e-03 | 1.41e-01 | 0.1426 |
| 23152 | CIC | P12T-E | Human | Esophagus | ESCC | 1.09e-10 | 7.74e-02 | 0.1122 |
| 23152 | CIC | P15T-E | Human | Esophagus | ESCC | 4.45e-08 | 1.50e-01 | 0.1149 |
| 23152 | CIC | P16T-E | Human | Esophagus | ESCC | 6.79e-06 | -4.64e-02 | 0.1153 |
| 23152 | CIC | P17T-E | Human | Esophagus | ESCC | 1.11e-11 | 2.04e-01 | 0.1278 |
| 23152 | CIC | P19T-E | Human | Esophagus | ESCC | 4.92e-03 | 1.75e-01 | 0.1662 |
| 23152 | CIC | P20T-E | Human | Esophagus | ESCC | 1.63e-12 | 5.05e-02 | 0.1124 |
| 23152 | CIC | P21T-E | Human | Esophagus | ESCC | 8.14e-11 | -8.30e-03 | 0.1617 |
| 23152 | CIC | P22T-E | Human | Esophagus | ESCC | 4.54e-18 | 5.02e-02 | 0.1236 |
| 23152 | CIC | P23T-E | Human | Esophagus | ESCC | 9.04e-17 | 1.10e-01 | 0.108 |
| Page: 1 2 3 4 5 |
| Tissue | Expression Dynamics | Abbreviation |
| Esophagus | 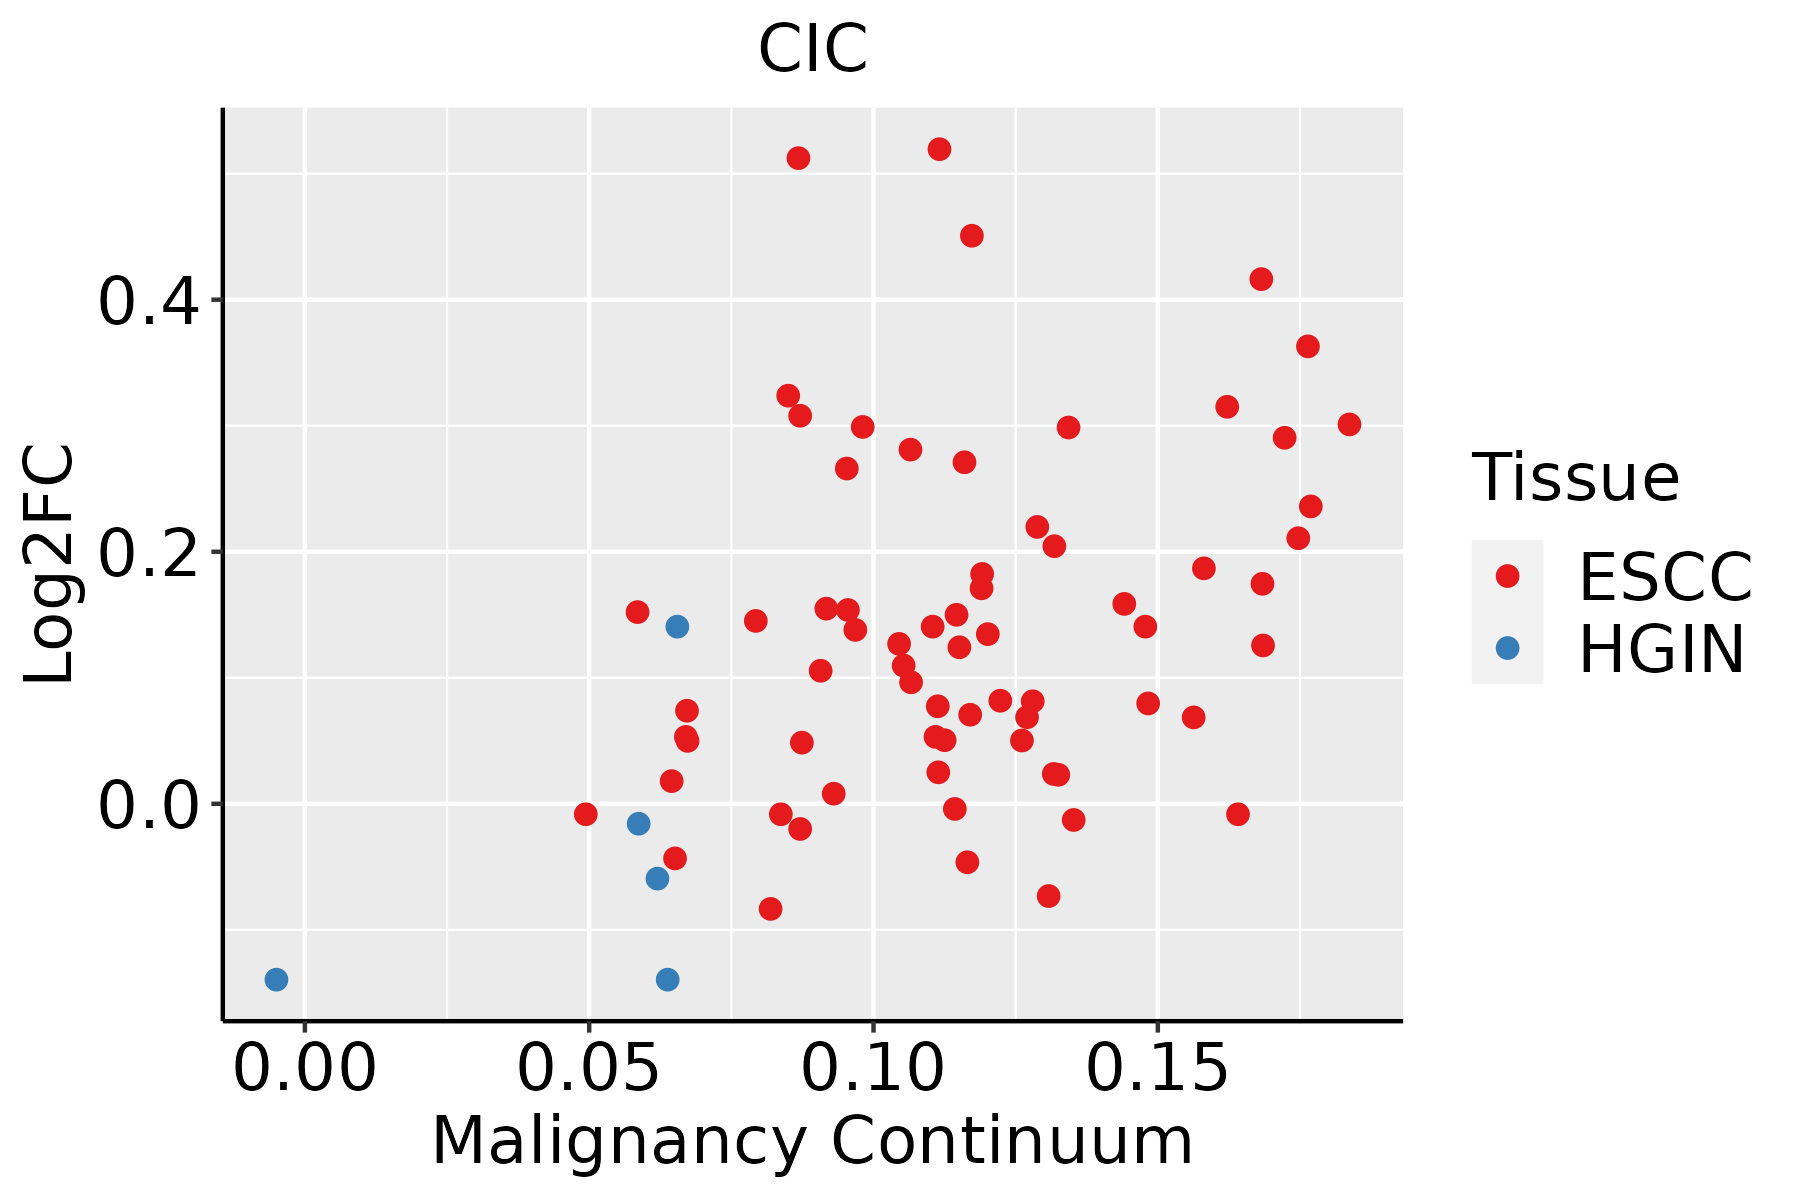 | ESCC: Esophageal squamous cell carcinoma |
| HGIN: High-grade intraepithelial neoplasias | ||
| LGIN: Low-grade intraepithelial neoplasias | ||
| Liver | 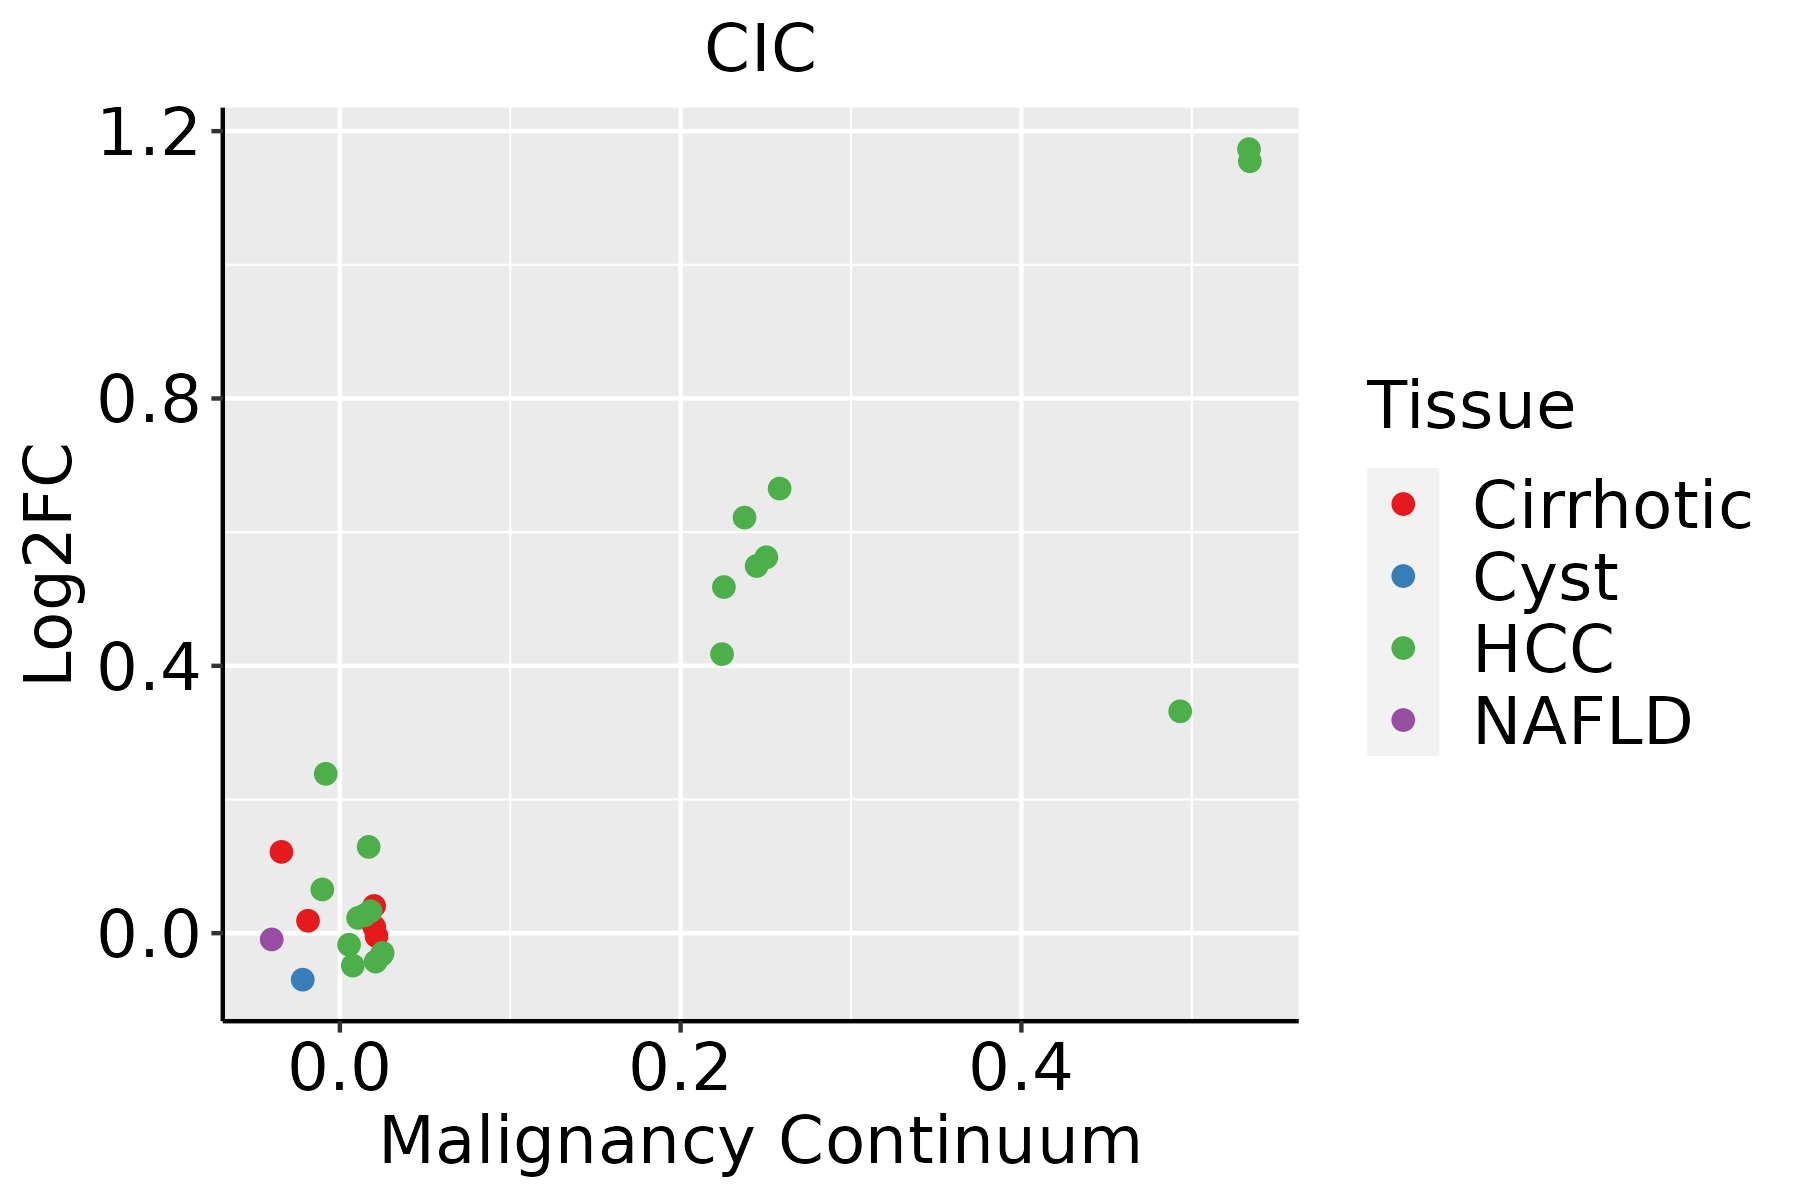 | HCC: Hepatocellular carcinoma |
| NAFLD: Non-alcoholic fatty liver disease | ||
| Oral Cavity | 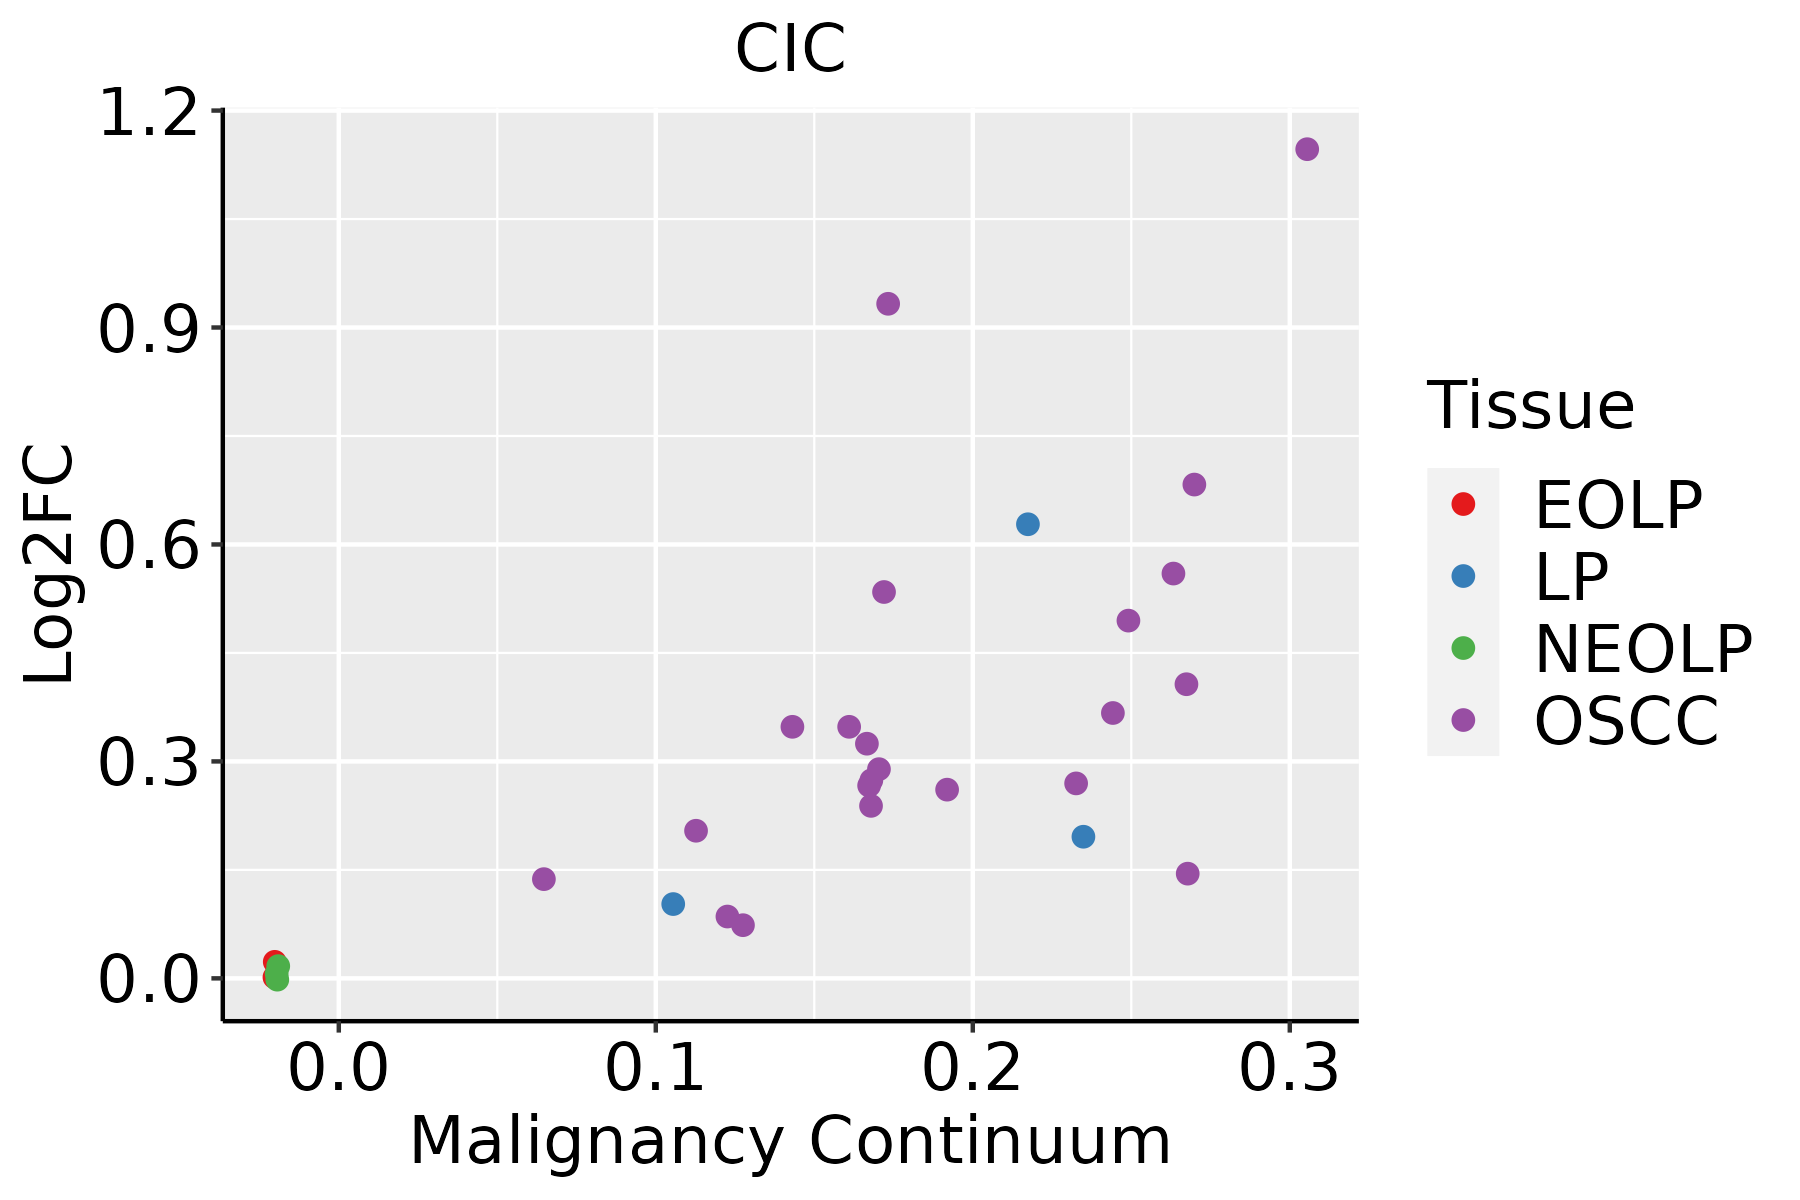 | EOLP: Erosive Oral lichen planus |
| LP: leukoplakia | ||
| NEOLP: Non-erosive oral lichen planus | ||
| OSCC: Oral squamous cell carcinoma | ||
| Thyroid |  | ATC: Anaplastic thyroid cancer |
| HT: Hashimoto's thyroiditis | ||
| PTC: Papillary thyroid cancer |
| ∗log2FC in expression of this searched gene in stem-like cells from each diseased tissue sample relative to stem-like cells in normal samples in each tissue plotted against the malignancy continuum. Samples are colored based on if they are from different disease stage. |
Top |
Malignant transformation related pathway analysis |
| Find out the enriched GO biological processes and KEGG pathways involved in transition from healthy to precancer to cancer |
| Tissue | Disease Stage | Enriched GO biological Processes |
| Colorectum | AD |  |
| Colorectum | SER |  |
| Colorectum | MSS |  |
| Colorectum | MSI-H |  |
| Colorectum | FAP |  |
| ∗Top 15 enriched GO BP terms are showed in the bar plot of each disease state in each tissue. Each row represents a significant GO biological process which is colored according to the -log10(p.adjust). |
| Page: 1 2 3 4 5 6 7 8 9 |
| GO ID | Tissue | Disease Stage | Description | Gene Ratio | Bg Ratio | pvalue | p.adjust | Count |
| Page: 1 |
| Pathway ID | Tissue | Disease Stage | Description | Gene Ratio | Bg Ratio | pvalue | p.adjust | qvalue | Count |
| hsa0501728 | Esophagus | ESCC | Spinocerebellar ataxia | 94/4205 | 143/8465 | 6.77e-05 | 2.90e-04 | 1.48e-04 | 94 |
| hsa0501736 | Esophagus | ESCC | Spinocerebellar ataxia | 94/4205 | 143/8465 | 6.77e-05 | 2.90e-04 | 1.48e-04 | 94 |
| hsa0501721 | Liver | HCC | Spinocerebellar ataxia | 92/4020 | 143/8465 | 3.20e-05 | 1.88e-04 | 1.04e-04 | 92 |
| hsa0501731 | Liver | HCC | Spinocerebellar ataxia | 92/4020 | 143/8465 | 3.20e-05 | 1.88e-04 | 1.04e-04 | 92 |
| hsa0501725 | Oral cavity | OSCC | Spinocerebellar ataxia | 86/3704 | 143/8465 | 5.21e-05 | 2.08e-04 | 1.06e-04 | 86 |
| hsa05017111 | Oral cavity | OSCC | Spinocerebellar ataxia | 86/3704 | 143/8465 | 5.21e-05 | 2.08e-04 | 1.06e-04 | 86 |
| Page: 1 |
Top |
Cell-cell communication analysis |
| Identification of potential cell-cell interactions between two cell types and their ligand-receptor pairs for different disease states |
| Ligand | Receptor | LRpair | Pathway | Tissue | Disease Stage |
| Page: 1 |
Top |
Single-cell gene regulatory network inference analysis |
| Find out the significant the regulons (TFs) and the target genes of each regulon across cell types for different disease states |
| TF | Cell Type | Tissue | Disease Stage | Target Gene | RSS | Regulon Activity |
| CIC | LYMEND | Breast | ADJ | CRABP2,GOLGA6L4,MN1, etc. | 6.10e-02 |  |
| CIC | CD8TEXINT | Cervix | N_HPV | FAM89A,TM4SF1,H2BC8, etc. | 2.98e-02 |  |
| CIC | PVA | Liver | Healthy | RCC1,NRIP1,PRPSAP1, etc. | 1.49e-02 |  |
| CIC | MEGA | Liver | Healthy | RCC1,NRIP1,PRPSAP1, etc. | 7.61e-03 | |
| CIC | MSC | Liver | NAFLD | RCC1,NRIP1,PRPSAP1, etc. | 1.75e-02 |  |
| ∗The dot plots of a searched regulon are shown for all cell subpopulations in each disease state of each tissue based on the regulon specific score inferred using pySCENIC and by calculating the average expression. |
| Page: 1 |
Top |
Somatic mutation of malignant transformation related genes |
| Annotation of somatic variants for genes involved in malignant transformation |
| Hugo Symbol | Variant Class | Variant Classification | dbSNP RS | HGVSc | HGVSp | HGVSp Short | SWISSPROT | BIOTYPE | SIFT | PolyPhen | Tumor Sample Barcode | Tissue | Histology | Sex | Age | Stage | Therapy Types | Drugs | Outcome |
| CIC | SNV | Missense_Mutation | c.3763N>C | p.Glu1255Gln | p.E1255Q | Q96RK0 | protein_coding | tolerated_low_confidence(0.1) | benign(0.378) | TCGA-AC-A23H-01 | Breast | breast invasive carcinoma | Female | >=65 | I/II | Unknown | Unknown | PD | |
| CIC | SNV | Missense_Mutation | c.4534C>T | p.Arg1512Cys | p.R1512C | Q96RK0 | protein_coding | deleterious(0) | probably_damaging(0.988) | TCGA-C8-A1HN-01 | Breast | breast invasive carcinoma | Female | <65 | I/II | Unknown | Unknown | SD | |
| CIC | SNV | Missense_Mutation | c.1744N>C | p.Ala582Pro | p.A582P | Q96RK0 | protein_coding | deleterious_low_confidence(0.02) | benign(0.043) | TCGA-D8-A147-01 | Breast | breast invasive carcinoma | Female | <65 | I/II | Chemotherapy | doxorubicine | SD | |
| CIC | SNV | Missense_Mutation | novel | c.1297N>A | p.Asp433Asn | p.D433N | Q96RK0 | protein_coding | deleterious_low_confidence(0) | probably_damaging(0.994) | TCGA-D8-A27G-01 | Breast | breast invasive carcinoma | Female | >=65 | I/II | Unknown | Unknown | SD |
| CIC | SNV | Missense_Mutation | c.643N>T | p.Arg215Trp | p.R215W | Q96RK0 | protein_coding | deleterious(0) | probably_damaging(0.999) | TCGA-2W-A8YY-01 | Cervix | cervical & endocervical cancer | Female | <65 | I/II | Chemotherapy | cisplatin | CR | |
| CIC | SNV | Missense_Mutation | novel | c.4390N>T | p.Arg1464Trp | p.R1464W | Q96RK0 | protein_coding | deleterious(0) | probably_damaging(0.988) | TCGA-2W-A8YY-01 | Cervix | cervical & endocervical cancer | Female | <65 | I/II | Chemotherapy | cisplatin | CR |
| CIC | SNV | Missense_Mutation | c.1105N>C | p.Asp369His | p.D369H | Q96RK0 | protein_coding | deleterious_low_confidence(0) | possibly_damaging(0.887) | TCGA-C5-A1MJ-01 | Cervix | cervical & endocervical cancer | Female | <65 | I/II | Unknown | Unknown | SD | |
| CIC | SNV | Missense_Mutation | novel | c.3268N>A | p.Pro1090Thr | p.P1090T | Q96RK0 | protein_coding | deleterious_low_confidence(0.02) | benign(0.142) | TCGA-C5-A1MN-01 | Cervix | cervical & endocervical cancer | Female | <65 | III/IV | Chemotherapy | cisplatin | SD |
| CIC | SNV | Missense_Mutation | rs748419463 | c.2104A>G | p.Asn702Asp | p.N702D | Q96RK0 | protein_coding | tolerated_low_confidence(0.2) | benign(0) | TCGA-C5-A3HE-01 | Cervix | cervical & endocervical cancer | Female | <65 | I/II | Unknown | Unknown | PD |
| CIC | SNV | Missense_Mutation | c.1453G>C | p.Glu485Gln | p.E485Q | Q96RK0 | protein_coding | deleterious_low_confidence(0.04) | benign(0.143) | TCGA-EK-A3GK-01 | Cervix | cervical & endocervical cancer | Female | <65 | I/II | Unknown | Unknown | SD |
| Page: 1 2 3 4 5 6 7 8 9 10 11 12 13 14 15 16 17 |
Top |
Related drugs of malignant transformation related genes |
| Identification of chemicals and drugs interact with genes involved in malignant transfromation |
| (DGIdb 4.0) |
| Entrez ID | Symbol | Category | Interaction Types | Drug Claim Name | Drug Name | PMIDs |
| 23152 | CIC | CLINICALLY ACTIONABLE, DRUG RESISTANCE | TRAMETINIB | TRAMETINIB | 28178529 | |
| 23152 | CIC | CLINICALLY ACTIONABLE, DRUG RESISTANCE | SELUMETINIB | SELUMETINIB | 28178529 | |
| 23152 | CIC | CLINICALLY ACTIONABLE, DRUG RESISTANCE | VEMURAFENIB | VEMURAFENIB | 28178529 |
| Page: 1 |

Copyright 2023-Present -The University of Texas Health Science Center at Houston |