Schematic overview of the cellular and molecular mechanisms involved in the cancer progression, including the proposed cellular and molecular mechanisms in cancer cells trajectory. AT1: alveolar type 1 cells; AT2: alveolar type 2 cells; AAH: atypical adenomatous hyperplasia; AIS: adenocarcinoma in situ; MIA: minimally invasive adenocarcinoma; IA: invasive adenocarcinoma; EMT: epithelial-mesenchymal transition

Home

Download

Statistics

Help

Contact

Center for Computational Systems Medicine
leaf

Gene summary

leaf

Malignant transformation analysis

leaf

Malignant transformation related pathway analysis

leaf

Cell-cell communication analysis

leaf

Single-cell gene regulatory network inference analysis

leaf

Somatic mutation of malignant transformation related genes

leaf

Related drugs of malignant transformation related genes

Gene: CIAO1

Gene summary for CIAO1

check button Gene summary.

Gene informationSpeciesHuman
Gene symbol

CIAO1

Gene ID

9391

Gene namecytosolic iron-sulfur assembly component 1
Gene AliasCIA1
Cytomap2q11.2
Gene Typeprotein-coding
GO ID

GO:0006139

UniProtAcc

O76071


Top

Malignant transformation analysis

check button Identification of the aberrant gene expression in precancerous and cancerous lesions by comparing the gene expression of stem-like cells in diseased tissues with normal stem cells
check button Malignant transformation involving gene list.
Entrez IDSymbolReplicatesSpeciesOrganTissueAdj P-valueLog2FCMalignancy
9391CIAO1LZE2THumanEsophagusESCC4.08e-058.64e-010.082
9391CIAO1LZE4THumanEsophagusESCC1.36e-237.16e-010.0811
9391CIAO1LZE7THumanEsophagusESCC5.04e-219.19e-010.0667
9391CIAO1LZE8THumanEsophagusESCC2.01e-063.42e-010.067
9391CIAO1LZE20THumanEsophagusESCC6.57e-072.79e-010.0662
9391CIAO1LZE22THumanEsophagusESCC1.06e-076.96e-010.068
9391CIAO1LZE24THumanEsophagusESCC3.07e-196.59e-010.0596
9391CIAO1LZE21THumanEsophagusESCC1.19e-066.08e-010.0655
9391CIAO1LZE6THumanEsophagusESCC8.15e-125.37e-010.0845
9391CIAO1P1T-EHumanEsophagusESCC3.33e-177.85e-010.0875
9391CIAO1P2T-EHumanEsophagusESCC1.62e-478.56e-010.1177
9391CIAO1P4T-EHumanEsophagusESCC6.24e-461.02e+000.1323
9391CIAO1P5T-EHumanEsophagusESCC5.58e-367.97e-010.1327
9391CIAO1P8T-EHumanEsophagusESCC1.65e-315.29e-010.0889
9391CIAO1P9T-EHumanEsophagusESCC3.96e-224.66e-010.1131
9391CIAO1P10T-EHumanEsophagusESCC4.56e-479.65e-010.116
9391CIAO1P11T-EHumanEsophagusESCC2.56e-269.98e-010.1426
9391CIAO1P12T-EHumanEsophagusESCC1.17e-501.00e+000.1122
9391CIAO1P15T-EHumanEsophagusESCC1.13e-468.63e-010.1149
9391CIAO1P16T-EHumanEsophagusESCC2.29e-387.07e-010.1153
Page: 1 2 3 4 5 6 7 

check button Transcriptomic changes along malignancy continuum.
TissueExpression DynamicsAbbreviation
EsophagusThe image shows the transcriptomic changes along malignancy continuum.log2FC in expression of this searched gene in stem-like cells from each diseased tissue sample relative to stem-like cells in normal samples in each tissue plotted against the malignancy continuum. Samples are colored based on if they are from different disease stage.
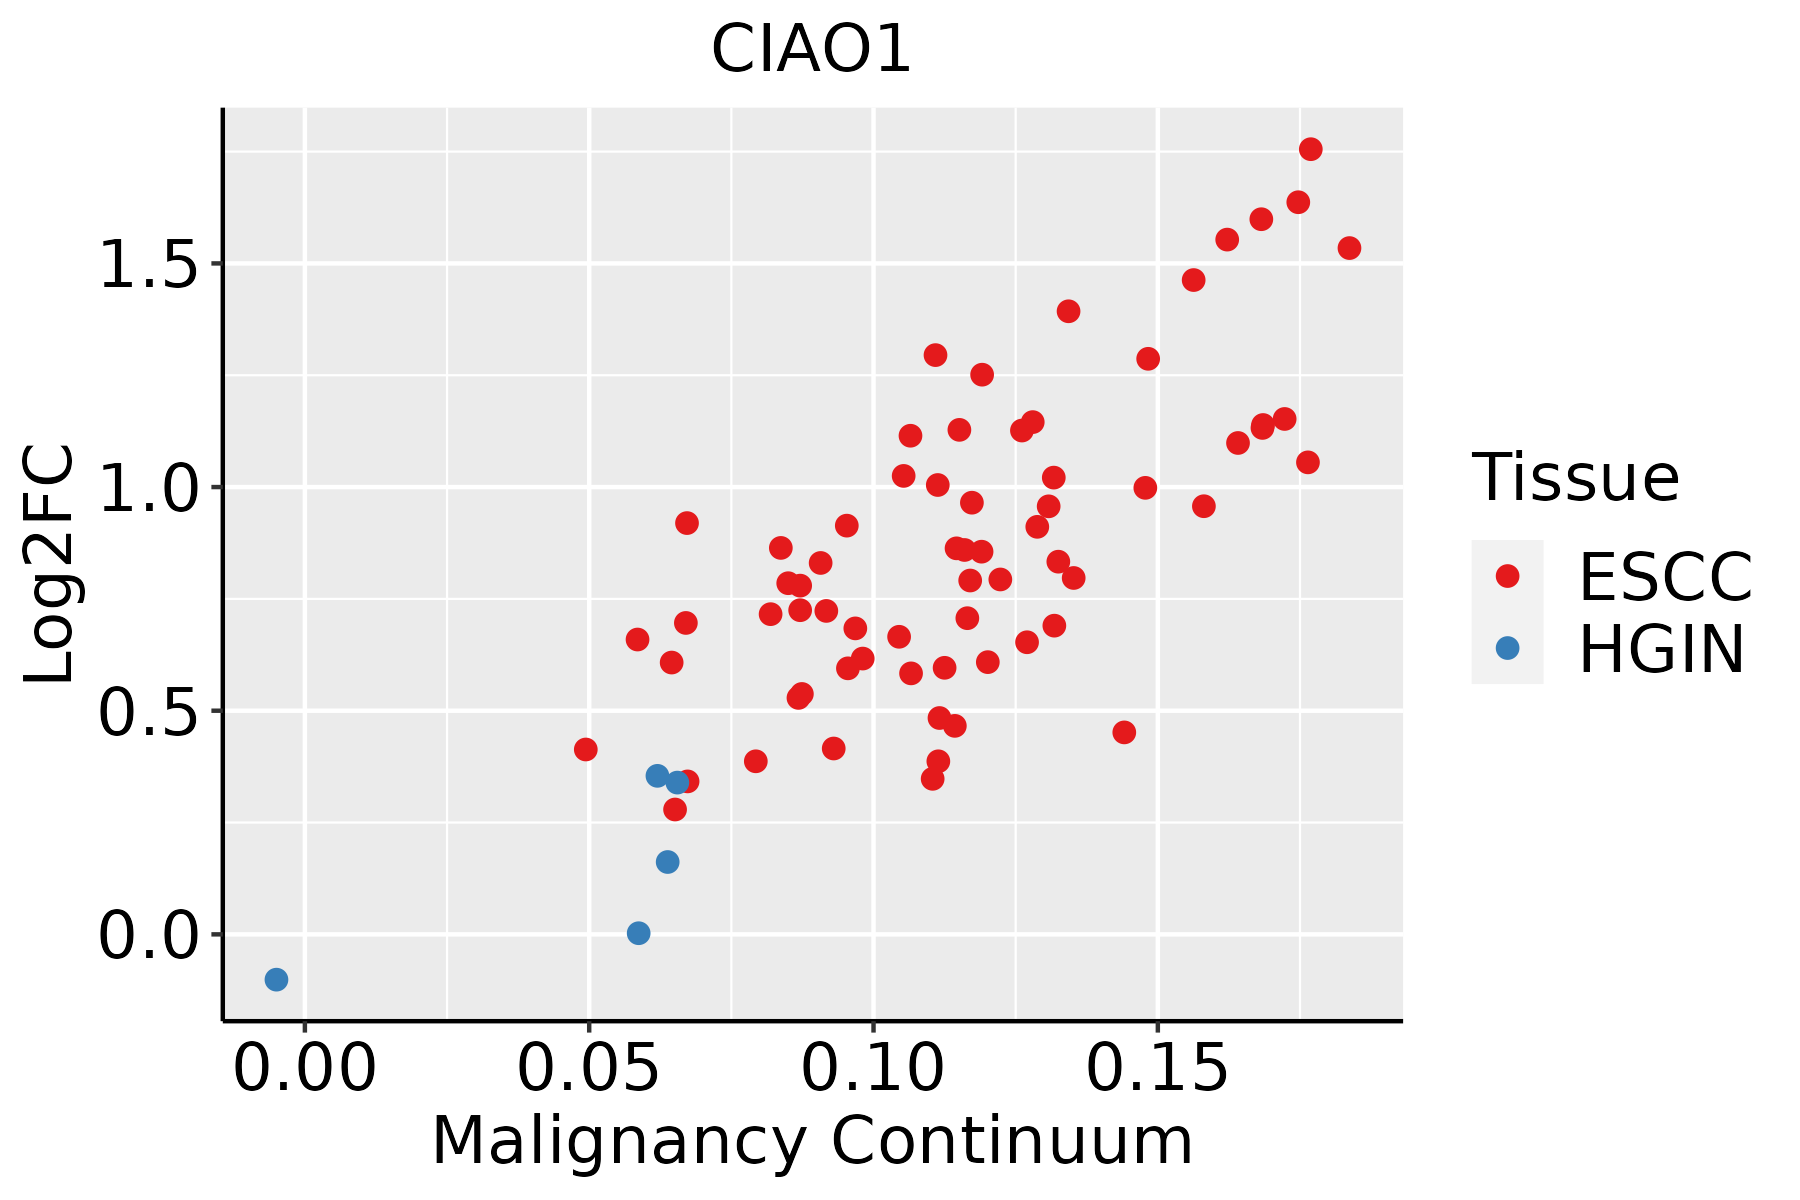
ESCC: Esophageal squamous cell carcinoma
HGIN: High-grade intraepithelial neoplasias
LGIN: Low-grade intraepithelial neoplasias
LiverThe image shows the transcriptomic changes along malignancy continuum.log2FC in expression of this searched gene in stem-like cells from each diseased tissue sample relative to stem-like cells in normal samples in each tissue plotted against the malignancy continuum. Samples are colored based on if they are from different disease stage.
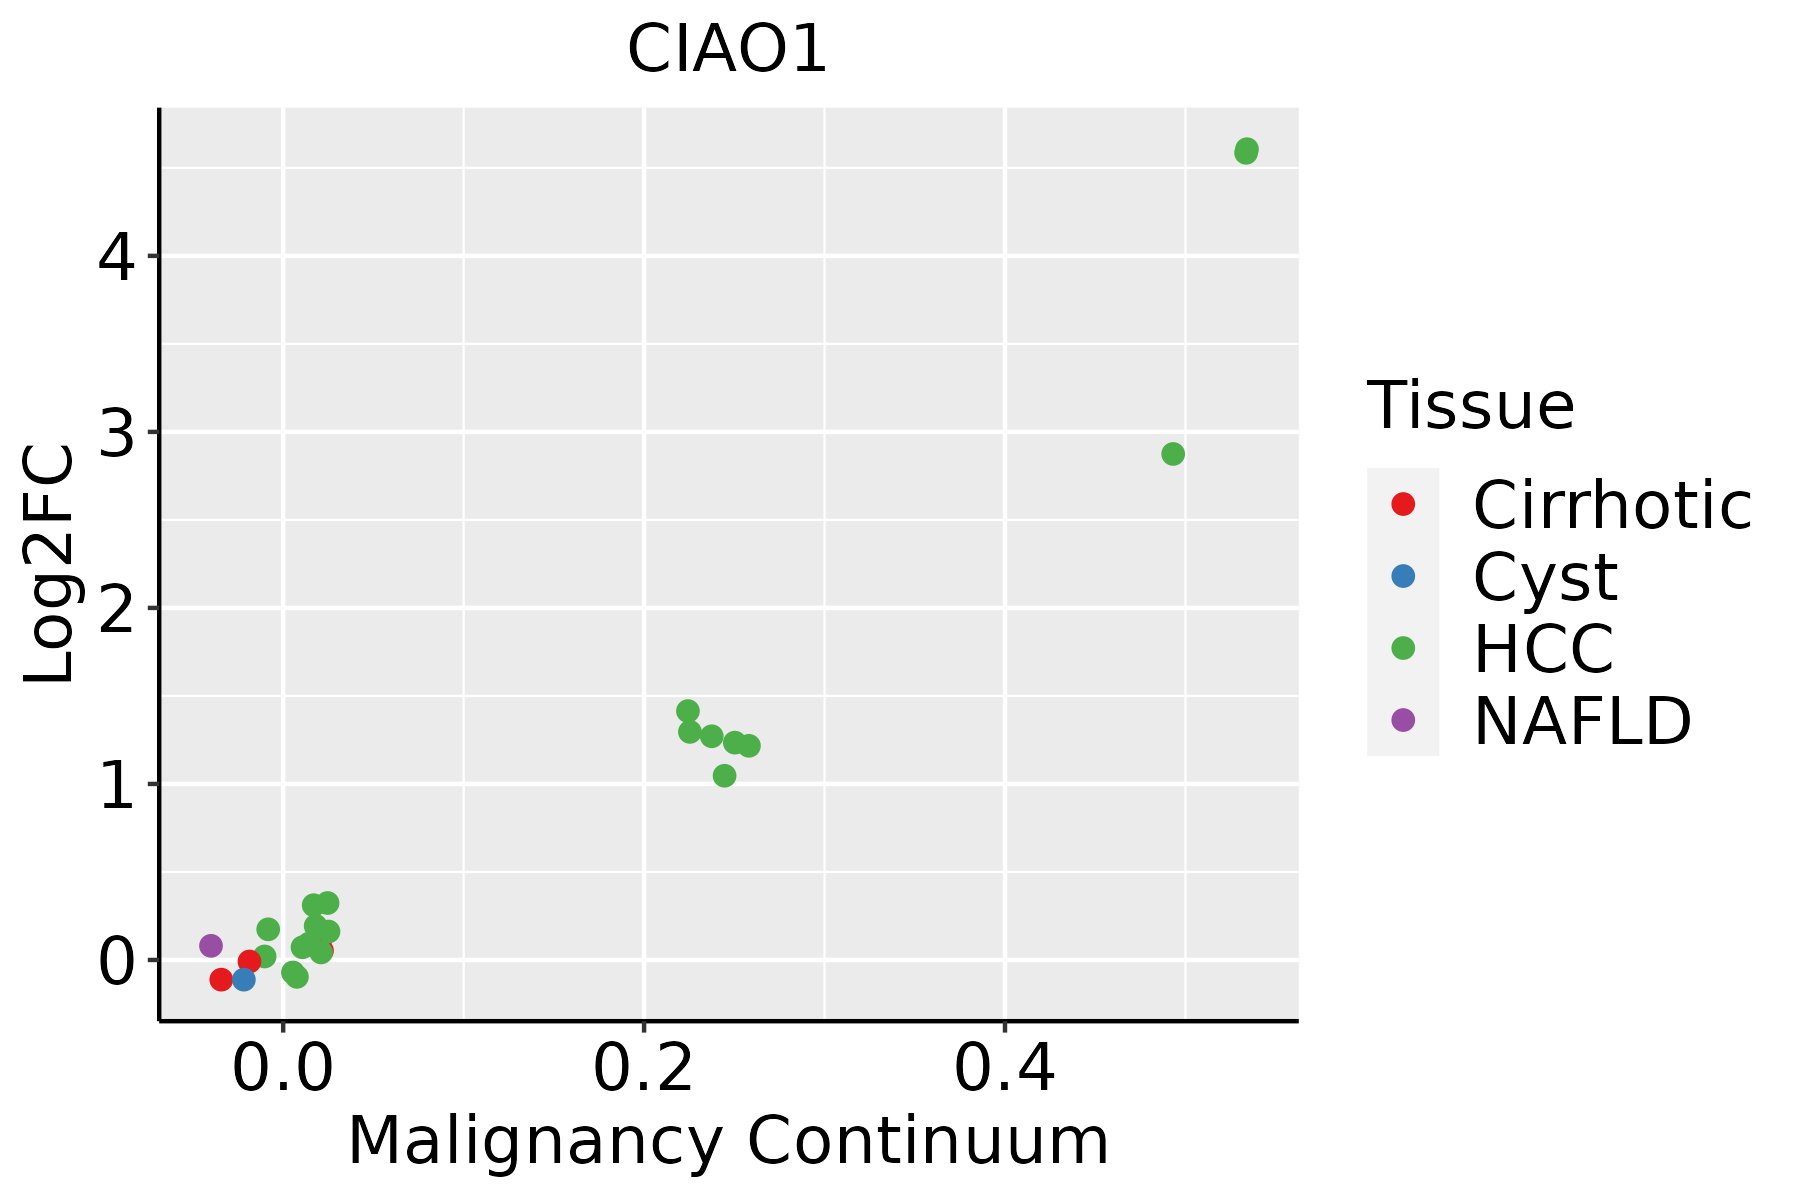
HCC: Hepatocellular carcinoma
NAFLD: Non-alcoholic fatty liver disease
Oral CavityThe image shows the transcriptomic changes along malignancy continuum.log2FC in expression of this searched gene in stem-like cells from each diseased tissue sample relative to stem-like cells in normal samples in each tissue plotted against the malignancy continuum. Samples are colored based on if they are from different disease stage.
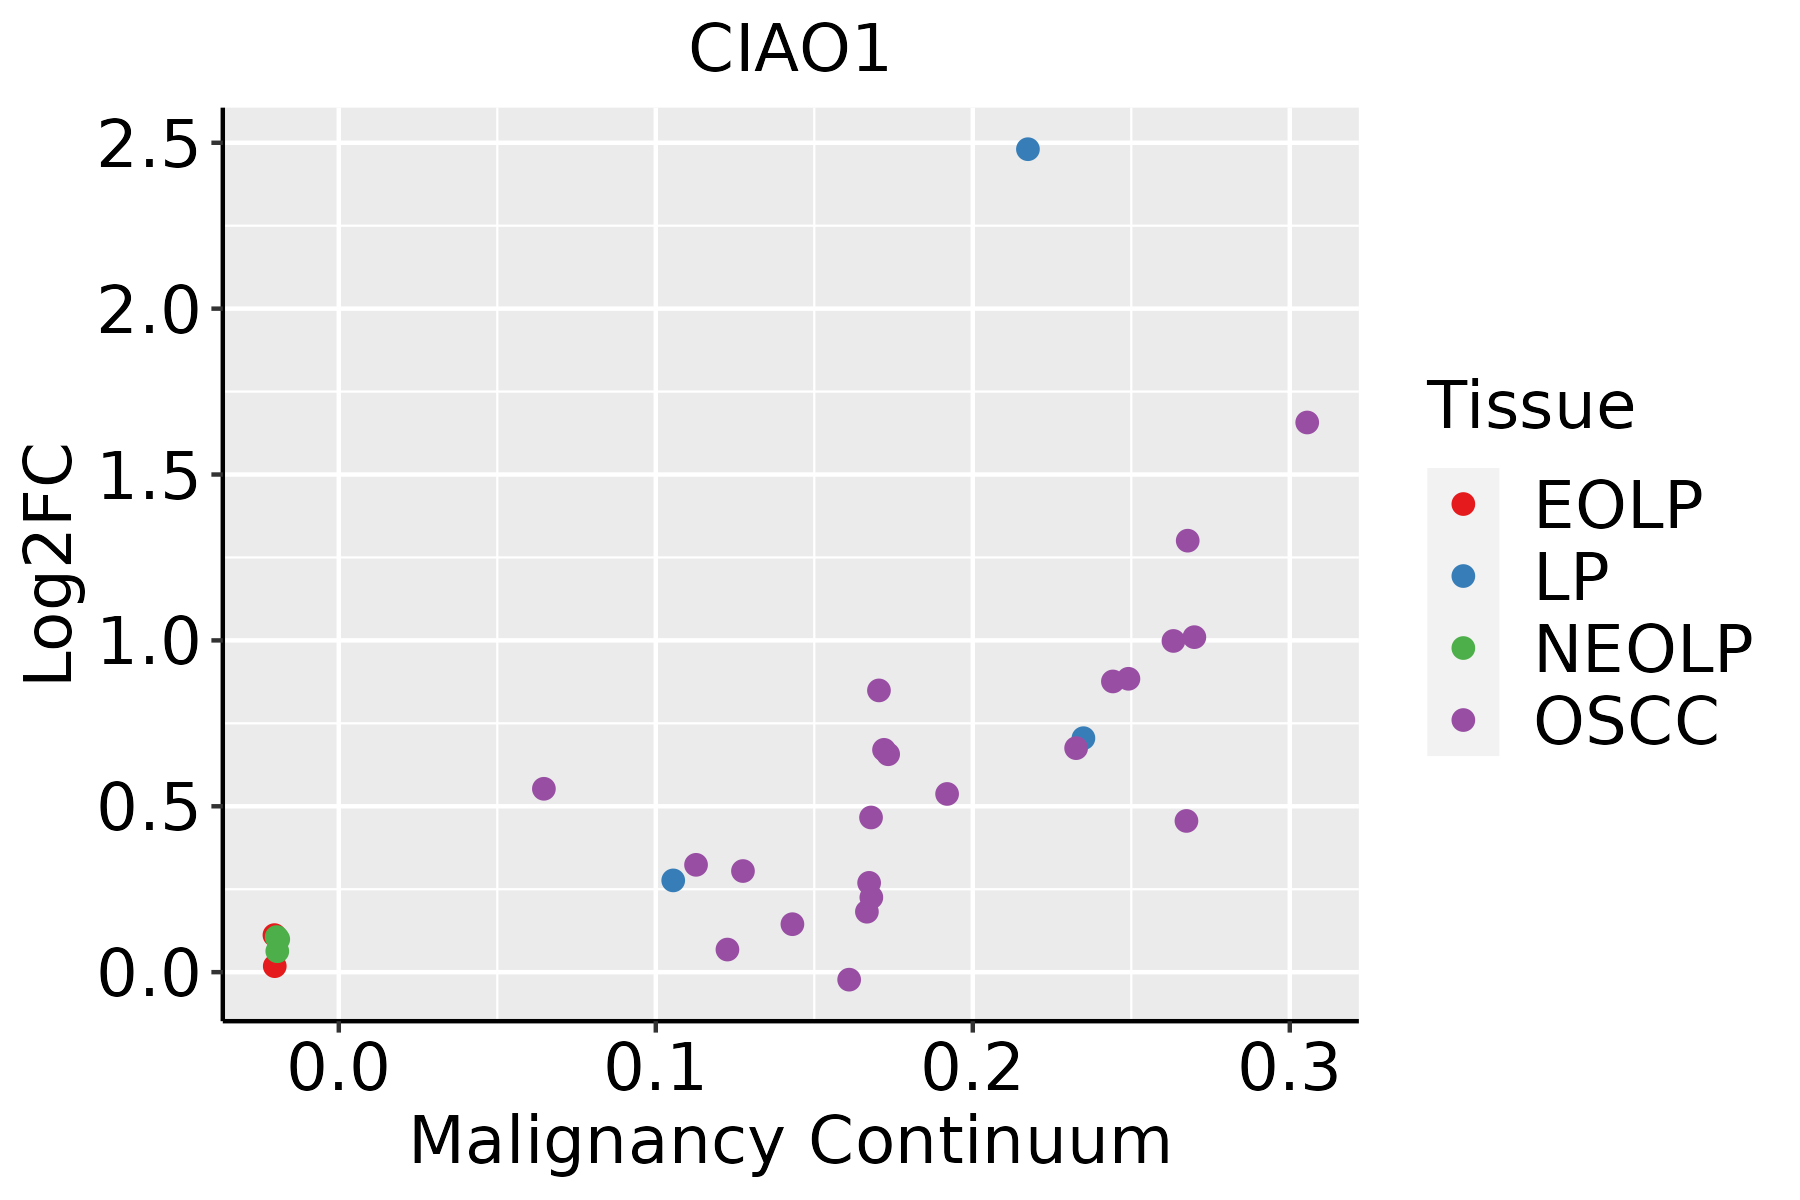
EOLP: Erosive Oral lichen planus
LP: leukoplakia
NEOLP: Non-erosive oral lichen planus
OSCC: Oral squamous cell carcinoma
SkinThe image shows the transcriptomic changes along malignancy continuum.log2FC in expression of this searched gene in stem-like cells from each diseased tissue sample relative to stem-like cells in normal samples in each tissue plotted against the malignancy continuum. Samples are colored based on if they are from different disease stage.
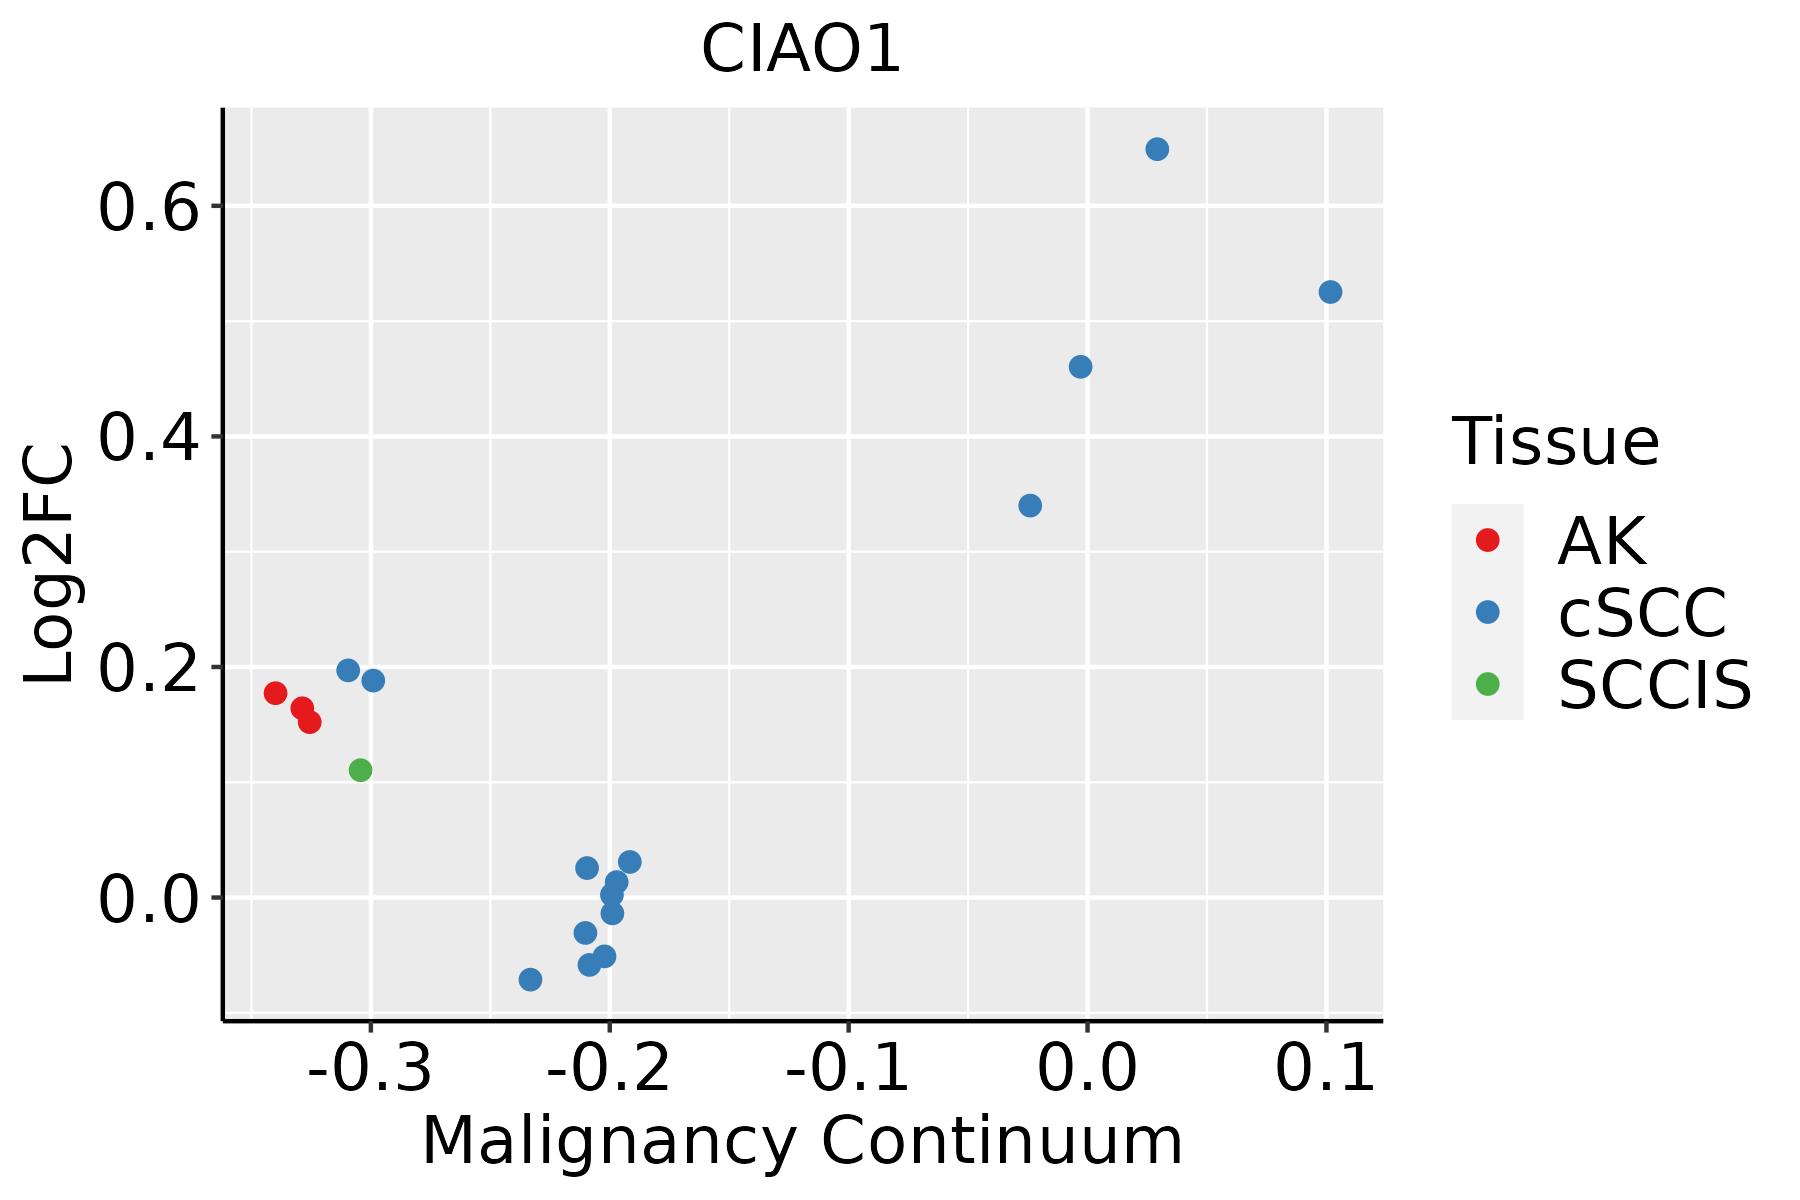
AK: Actinic keratosis
cSCC: Cutaneous squamous cell carcinoma
SCCIS:squamous cell carcinoma in situ
ThyroidThe image shows the transcriptomic changes along malignancy continuum.log2FC in expression of this searched gene in stem-like cells from each diseased tissue sample relative to stem-like cells in normal samples in each tissue plotted against the malignancy continuum. Samples are colored based on if they are from different disease stage.
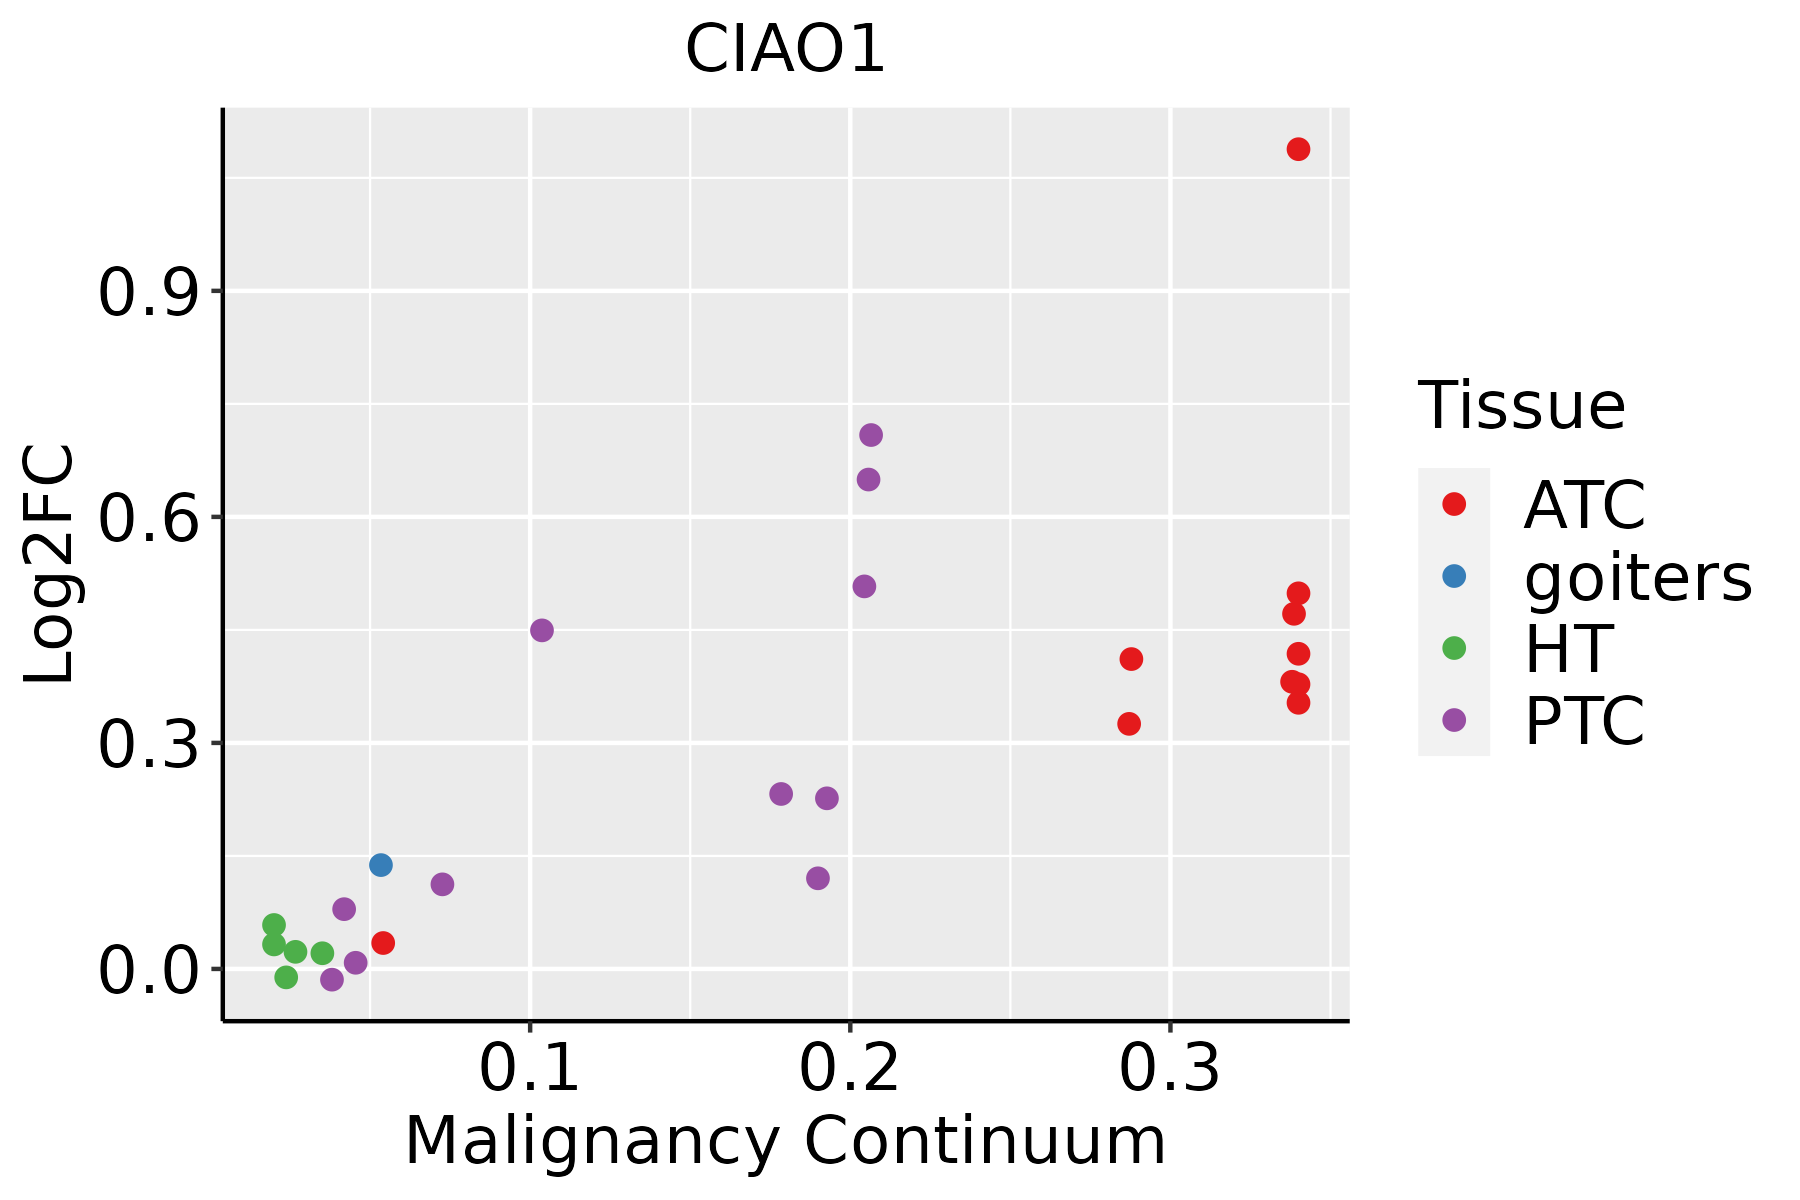
ATC: Anaplastic thyroid cancer
HT: Hashimoto's thyroiditis
PTC: Papillary thyroid cancer
∗log2FC in expression of this searched gene in stem-like cells from each diseased tissue sample relative to stem-like cells in normal samples in each tissue plotted against the malignancy continuum. Samples are colored based on if they are from different disease stage.

Top

Malignant transformation related pathway analysis

check buttonFind out the enriched GO biological processes and KEGG pathways involved in transition from healthy to precancer to cancer
check button Figure of enriched GO biological processes.
TissueDisease StageEnriched GO biological Processes
ColorectumADGO analysis - Figure of enriched GO biological processes: Top 15 enriched GO BP terms are showed in the bar plot of each disease state in each tissue. Each row represents a significant GO biological process which is colored according to the -log10(p.adjust).
ColorectumSERGO analysis - Figure of enriched GO biological processes: Top 15 enriched GO BP terms are showed in the bar plot of each disease state in each tissue. Each row represents a significant GO biological process which is colored according to the -log10(p.adjust).
ColorectumMSSGO analysis - Figure of enriched GO biological processes: Top 15 enriched GO BP terms are showed in the bar plot of each disease state in each tissue. Each row represents a significant GO biological process which is colored according to the -log10(p.adjust).
ColorectumMSI-HGO analysis - Figure of enriched GO biological processes: Top 15 enriched GO BP terms are showed in the bar plot of each disease state in each tissue. Each row represents a significant GO biological process which is colored according to the -log10(p.adjust).
ColorectumFAPGO analysis - Figure of enriched GO biological processes: Top 15 enriched GO BP terms are showed in the bar plot of each disease state in each tissue. Each row represents a significant GO biological process which is colored according to the -log10(p.adjust).
∗Top 15 enriched GO BP terms are showed in the bar plot of each disease state in each tissue. Each row represents a significant GO biological process which is colored according to the -log10(p.adjust).
Page: 1 2 3 4 5 6 7 8 9 

check button Enriched GO biological processes.
GO IDTissueDisease StageDescriptionGene RatioBg Ratiopvaluep.adjustCount
GO:000705911EsophagusESCCchromosome segregation238/8552346/187231.72e-181.82e-16238
GO:005160418EsophagusESCCprotein maturation189/8552294/187237.64e-112.39e-09189
GO:00067906EsophagusESCCsulfur compound metabolic process201/8552339/187232.64e-073.94e-06201
GO:001622611EsophagusESCCiron-sulfur cluster assembly21/855226/187232.69e-041.63e-0321
GO:003116311EsophagusESCCmetallo-sulfur cluster assembly21/855226/187232.69e-041.63e-0321
GO:009742811EsophagusESCCprotein maturation by iron-sulfur cluster transfer14/855216/187236.78e-043.56e-0314
GO:000679021LiverHCCsulfur compound metabolic process212/7958339/187235.60e-143.39e-12212
GO:0007059LiverHCCchromosome segregation197/7958346/187233.57e-087.87e-07197
GO:005160412LiverHCCprotein maturation171/7958294/187233.80e-088.30e-07171
GO:0016226LiverHCCiron-sulfur cluster assembly18/795826/187235.37e-032.24e-0218
GO:0031163LiverHCCmetallo-sulfur cluster assembly18/795826/187235.37e-032.24e-0218
GO:00070592Oral cavityOSCCchromosome segregation206/7305346/187235.82e-153.76e-13206
GO:005160410Oral cavityOSCCprotein maturation170/7305294/187233.97e-111.28e-09170
GO:00067905Oral cavityOSCCsulfur compound metabolic process168/7305339/187234.50e-053.84e-04168
GO:00162262Oral cavityOSCCiron-sulfur cluster assembly19/730526/187234.46e-042.70e-0319
GO:00311632Oral cavityOSCCmetallo-sulfur cluster assembly19/730526/187234.46e-042.70e-0319
GO:0097428Oral cavityOSCCprotein maturation by iron-sulfur cluster transfer11/730516/187231.56e-024.99e-0211
GO:005160416Oral cavityLPprotein maturation122/4623294/187231.37e-107.72e-09122
GO:00070591Oral cavityLPchromosome segregation117/4623346/187237.61e-059.91e-04117
GO:00162261Oral cavityLPiron-sulfur cluster assembly15/462326/187233.34e-043.34e-0315
Page: 1 2 

check button Enriched KEGG pathways.
Pathway IDTissueDisease StageDescriptionGene RatioBg Ratiopvaluep.adjustqvalueCount
Page: 1 

Top

Cell-cell communication analysis

check buttonIdentification of potential cell-cell interactions between two cell types and their ligand-receptor pairs for different disease states
LigandReceptorLRpairPathwayTissueDisease Stage
Page: 1 

Top

Single-cell gene regulatory network inference analysis

check buttonFind out the significant the regulons (TFs) and the target genes of each regulon across cell types for different disease states
TFCell TypeTissueDisease StageTarget GeneRSSRegulon Activity
∗The dot plots of a searched regulon are shown for all cell subpopulations in each disease state of each tissue based on the regulon specific score inferred using pySCENIC and by calculating the average expression.
Page: 1 

Top

Somatic mutation of malignant transformation related genes

check buttonAnnotation of somatic variants for genes involved in malignant transformation
Hugo SymbolVariant ClassVariant ClassificationdbSNP RSHGVScHGVSpHGVSp ShortSWISSPROTBIOTYPESIFTPolyPhenTumor Sample BarcodeTissueHistologySexAgeStageTherapy TypesDrugsOutcome
CIAO1SNVMissense_Mutationnovelc.596N>Tp.Ser199Ilep.S199IO76071protein_codingdeleterious(0)probably_damaging(0.964)TCGA-A2-A25A-01Breastbreast invasive carcinomaFemale<65I/IIUnspecificCytoxanSD
CIAO1SNVMissense_Mutationc.511N>Cp.Asp171Hisp.D171HO76071protein_codingdeleterious(0)probably_damaging(0.999)TCGA-AC-A23H-01Breastbreast invasive carcinomaFemale>=65I/IIUnknownUnknownPD
CIAO1insertionIn_Frame_Insnovelc.584_585insTGCCAGTCCCTTGATCTTGGACTTCCCAGCCTTCAGp.Ser195_Thr196insAlaSerProLeuIleLeuAspPheProAlaPheSerp.S195_T196insASPLILDFPAFSO76071protein_codingTCGA-A8-A07U-01Breastbreast invasive carcinomaFemale>=65III/IVChemotherapy5-fluorouracilSD
CIAO1insertionFrame_Shift_Insnovelc.248_249insATTGTGTp.Thr84LeufsTer13p.T84Lfs*13O76071protein_codingTCGA-AN-A0FS-01Breastbreast invasive carcinomaFemale<65I/IIUnknownUnknownSD
CIAO1insertionFrame_Shift_Insnovelc.638_639insCCTTTGCTTCCTGGGCCACACAGACACAp.Asp214LeufsTer10p.D214Lfs*10O76071protein_codingTCGA-AO-A0JD-01Breastbreast invasive carcinomaFemale<65III/IVChemotherapycyclophosphamideSD
CIAO1SNVMissense_Mutationnovelc.281A>Cp.Asp94Alap.D94AO76071protein_codingtolerated(0.06)benign(0.068)TCGA-2W-A8YY-01Cervixcervical & endocervical cancerFemale<65I/IIChemotherapycisplatinCR
CIAO1SNVMissense_Mutationnovelc.622N>Ap.Arg208Serp.R208SO76071protein_codingdeleterious(0.01)possibly_damaging(0.656)TCGA-AA-3956-01Colorectumcolon adenocarcinomaMale>=65I/IIUnknownUnknownSD
CIAO1SNVMissense_Mutationc.29G>Ap.Arg10Hisp.R10HO76071protein_codingdeleterious(0.03)possibly_damaging(0.593)TCGA-AD-5900-01Colorectumcolon adenocarcinomaMale>=65I/IIUnknownUnknownSD
CIAO1SNVMissense_Mutationc.854N>Tp.Ser285Leup.S285LO76071protein_codingdeleterious(0.03)benign(0.125)TCGA-A5-A0GP-01Endometriumuterine corpus endometrioid carcinomaFemale<65I/IIUnknownUnknownSD
CIAO1SNVMissense_Mutationc.532N>Tp.Arg178Trpp.R178WO76071protein_codingtolerated(0.08)probably_damaging(0.913)TCGA-A5-A0VP-01Endometriumuterine corpus endometrioid carcinomaFemale>=65I/IIUnknownUnknownSD
Page: 1 2 3 

Top

Related drugs of malignant transformation related genes

check buttonIdentification of chemicals and drugs interact with genes involved in malignant transfromation
(DGIdb 4.0)
Entrez IDSymbolCategoryInteraction TypesDrug Claim NameDrug NamePMIDs
Page: 1