
|
|||||
|
 | |
| |
| |
| |
| |
| |
|
Gene: CHTF18 |
Gene summary for CHTF18 |
| Gene information | Species | Human | Gene symbol | CHTF18 | Gene ID | 63922 |
| Gene name | chromosome transmission fidelity factor 18 | |
| Gene Alias | C16orf41 | |
| Cytomap | 16p13.3 | |
| Gene Type | protein-coding | GO ID | GO:0006139 | UniProtAcc | Q8WVB6 |
Top |
Malignant transformation analysis |
| Identification of the aberrant gene expression in precancerous and cancerous lesions by comparing the gene expression of stem-like cells in diseased tissues with normal stem cells |
| Entrez ID | Symbol | Replicates | Species | Organ | Tissue | Adj P-value | Log2FC | Malignancy |
| 63922 | CHTF18 | LZE7T | Human | Esophagus | ESCC | 4.18e-08 | 4.03e-01 | 0.0667 |
| 63922 | CHTF18 | LZE21D1 | Human | Esophagus | HGIN | 2.99e-04 | 2.84e-01 | 0.0632 |
| 63922 | CHTF18 | LZE24T | Human | Esophagus | ESCC | 6.82e-04 | 1.79e-01 | 0.0596 |
| 63922 | CHTF18 | LZE21T | Human | Esophagus | ESCC | 1.13e-03 | 3.96e-01 | 0.0655 |
| 63922 | CHTF18 | P1T-E | Human | Esophagus | ESCC | 2.86e-03 | 2.29e-01 | 0.0875 |
| 63922 | CHTF18 | P2T-E | Human | Esophagus | ESCC | 2.48e-19 | 4.17e-01 | 0.1177 |
| 63922 | CHTF18 | P4T-E | Human | Esophagus | ESCC | 3.56e-05 | 1.84e-01 | 0.1323 |
| 63922 | CHTF18 | P5T-E | Human | Esophagus | ESCC | 3.17e-09 | 2.12e-01 | 0.1327 |
| 63922 | CHTF18 | P8T-E | Human | Esophagus | ESCC | 1.40e-02 | 1.27e-01 | 0.0889 |
| 63922 | CHTF18 | P12T-E | Human | Esophagus | ESCC | 1.71e-02 | 1.80e-01 | 0.1122 |
| 63922 | CHTF18 | P15T-E | Human | Esophagus | ESCC | 1.99e-04 | 1.74e-01 | 0.1149 |
| 63922 | CHTF18 | P17T-E | Human | Esophagus | ESCC | 2.20e-02 | 2.26e-01 | 0.1278 |
| 63922 | CHTF18 | P19T-E | Human | Esophagus | ESCC | 4.13e-04 | 4.79e-01 | 0.1662 |
| 63922 | CHTF18 | P20T-E | Human | Esophagus | ESCC | 3.59e-02 | 8.89e-02 | 0.1124 |
| 63922 | CHTF18 | P21T-E | Human | Esophagus | ESCC | 2.31e-05 | 1.46e-01 | 0.1617 |
| 63922 | CHTF18 | P23T-E | Human | Esophagus | ESCC | 2.84e-04 | 1.51e-01 | 0.108 |
| 63922 | CHTF18 | P24T-E | Human | Esophagus | ESCC | 1.40e-03 | 1.63e-01 | 0.1287 |
| 63922 | CHTF18 | P26T-E | Human | Esophagus | ESCC | 5.98e-16 | 3.38e-01 | 0.1276 |
| 63922 | CHTF18 | P27T-E | Human | Esophagus | ESCC | 6.31e-04 | 1.07e-01 | 0.1055 |
| 63922 | CHTF18 | P28T-E | Human | Esophagus | ESCC | 5.58e-12 | 2.76e-01 | 0.1149 |
| Page: 1 2 3 |
| Tissue | Expression Dynamics | Abbreviation |
| Esophagus | 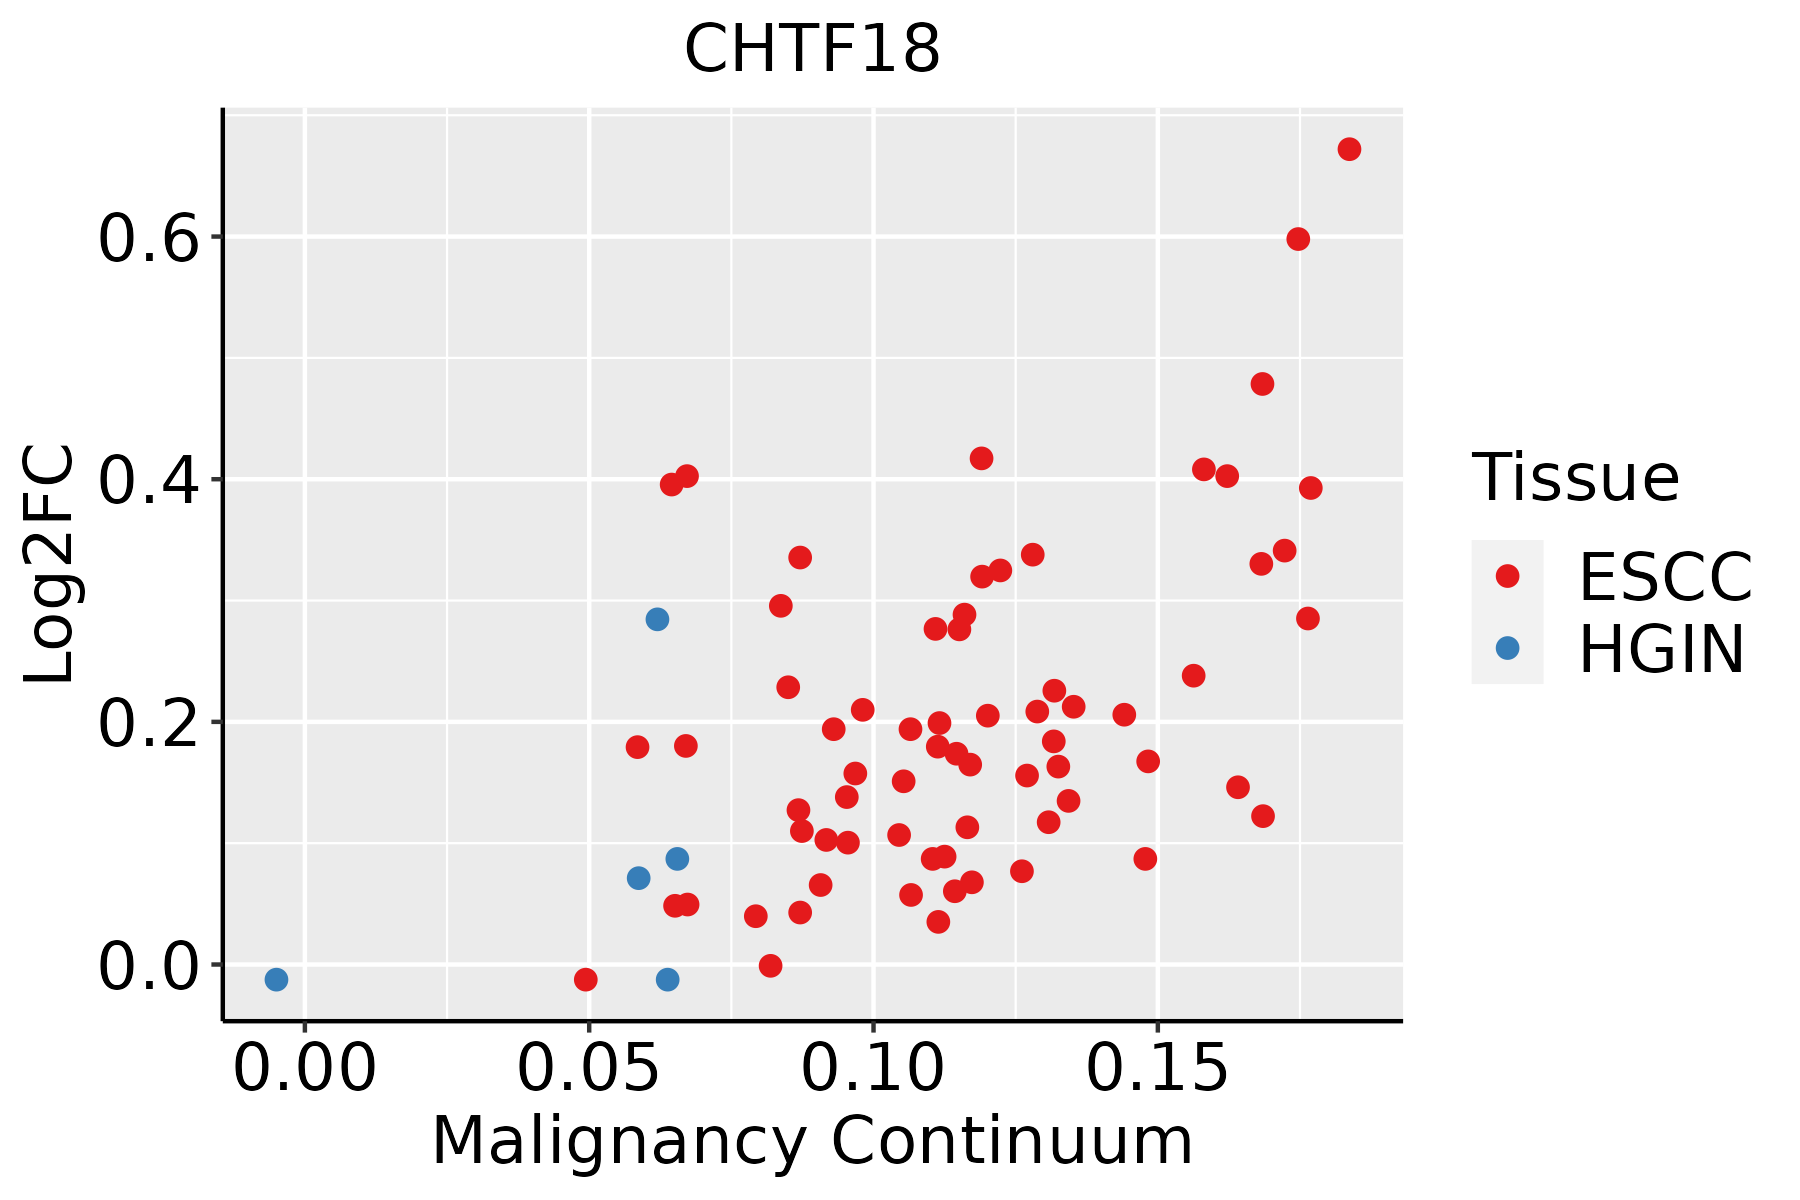 | ESCC: Esophageal squamous cell carcinoma |
| HGIN: High-grade intraepithelial neoplasias | ||
| LGIN: Low-grade intraepithelial neoplasias | ||
| Oral Cavity | 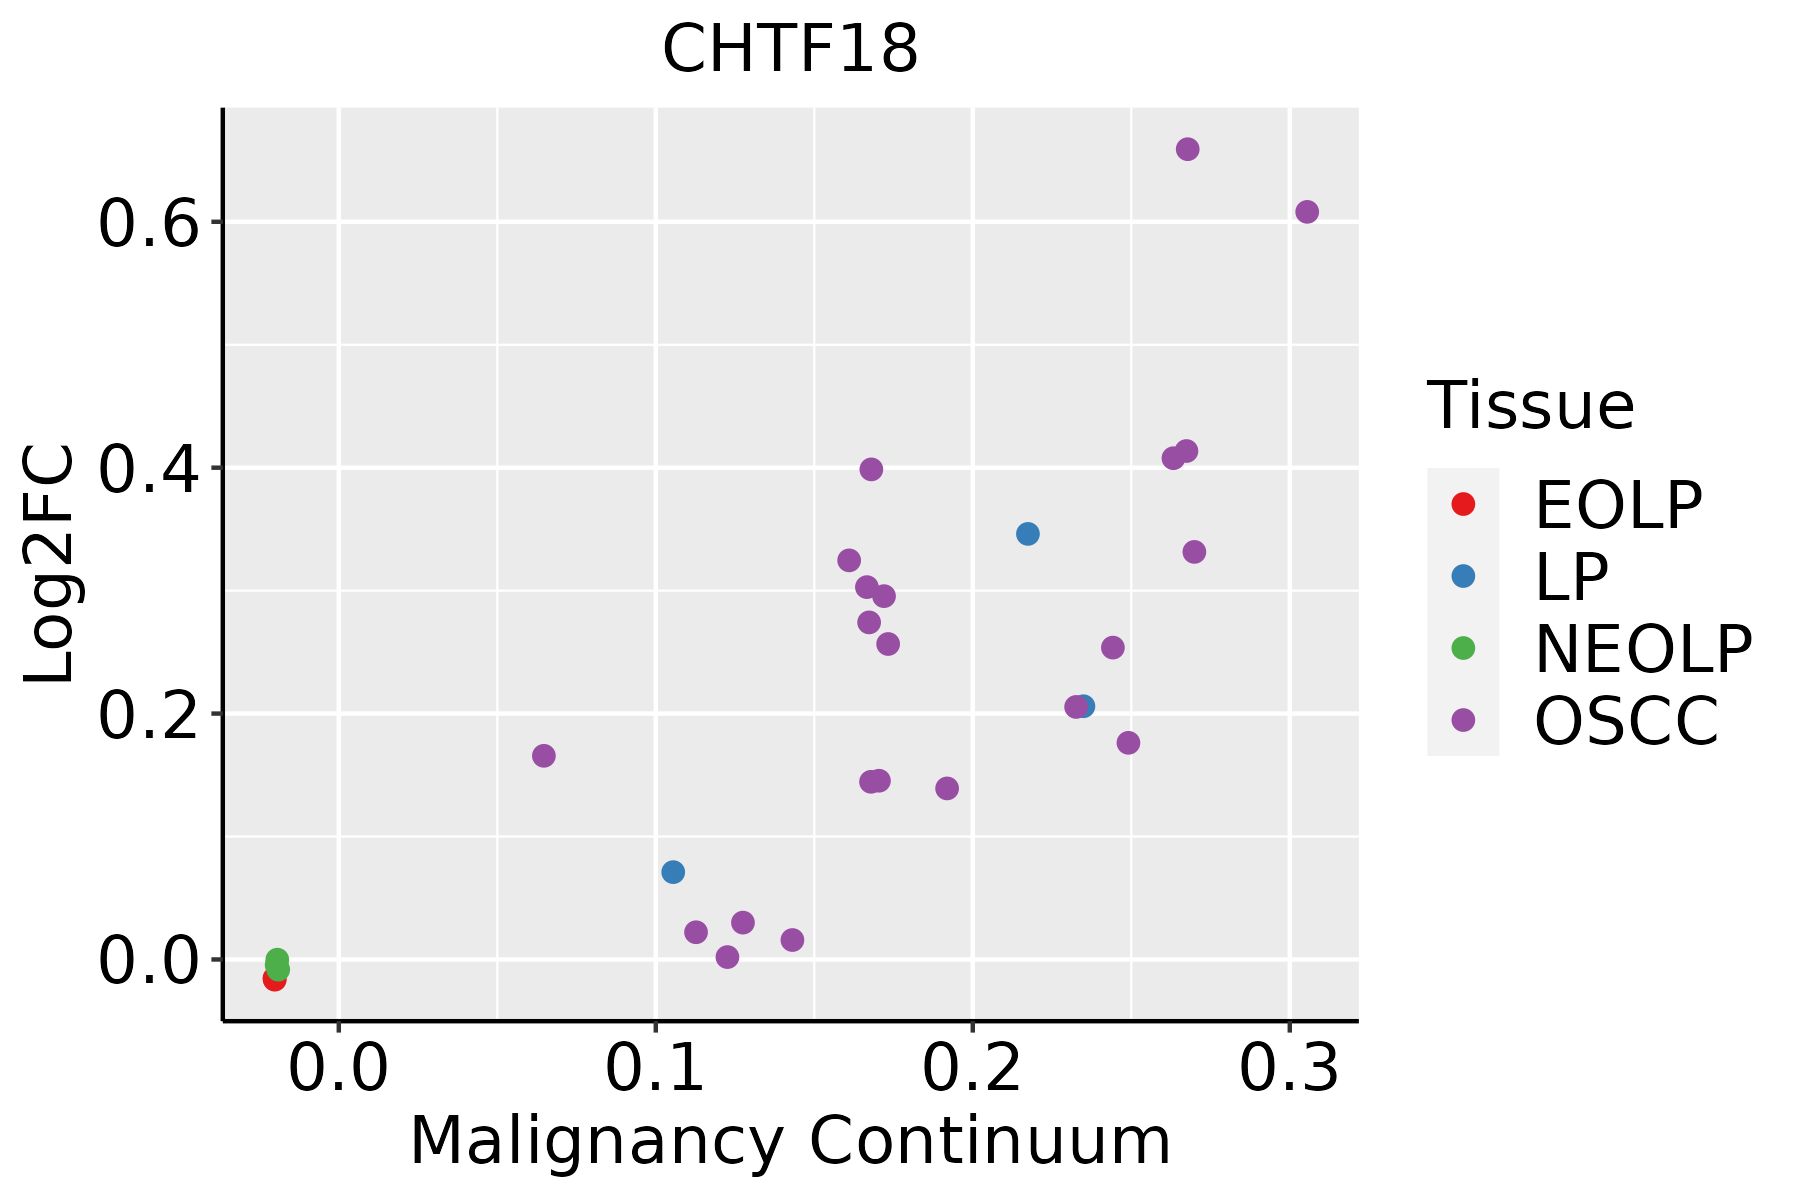 | EOLP: Erosive Oral lichen planus |
| LP: leukoplakia | ||
| NEOLP: Non-erosive oral lichen planus | ||
| OSCC: Oral squamous cell carcinoma |
| ∗log2FC in expression of this searched gene in stem-like cells from each diseased tissue sample relative to stem-like cells in normal samples in each tissue plotted against the malignancy continuum. Samples are colored based on if they are from different disease stage. |
Top |
Malignant transformation related pathway analysis |
| Find out the enriched GO biological processes and KEGG pathways involved in transition from healthy to precancer to cancer |
| Tissue | Disease Stage | Enriched GO biological Processes |
| Colorectum | AD |  |
| Colorectum | SER |  |
| Colorectum | MSS |  |
| Colorectum | MSI-H |  |
| Colorectum | FAP |  |
| ∗Top 15 enriched GO BP terms are showed in the bar plot of each disease state in each tissue. Each row represents a significant GO biological process which is colored according to the -log10(p.adjust). |
| Page: 1 2 3 4 5 6 7 8 9 |
| GO ID | Tissue | Disease Stage | Description | Gene Ratio | Bg Ratio | pvalue | p.adjust | Count |
| GO:005105214 | Esophagus | HGIN | regulation of DNA metabolic process | 79/2587 | 359/18723 | 1.38e-05 | 3.85e-04 | 79 |
| GO:007189710 | Esophagus | HGIN | DNA biosynthetic process | 44/2587 | 180/18723 | 8.97e-05 | 1.96e-03 | 44 |
| GO:005105416 | Esophagus | HGIN | positive regulation of DNA metabolic process | 47/2587 | 201/18723 | 1.65e-04 | 3.21e-03 | 47 |
| GO:00323926 | Esophagus | HGIN | DNA geometric change | 25/2587 | 90/18723 | 3.77e-04 | 5.85e-03 | 25 |
| GO:200027819 | Esophagus | HGIN | regulation of DNA biosynthetic process | 28/2587 | 106/18723 | 4.30e-04 | 6.47e-03 | 28 |
| GO:00325084 | Esophagus | HGIN | DNA duplex unwinding | 22/2587 | 84/18723 | 1.91e-03 | 2.03e-02 | 22 |
| GO:200057318 | Esophagus | HGIN | positive regulation of DNA biosynthetic process | 18/2587 | 66/18723 | 2.95e-03 | 2.86e-02 | 18 |
| GO:00062604 | Esophagus | ESCC | DNA replication | 181/8552 | 260/18723 | 3.55e-15 | 2.05e-13 | 181 |
| GO:005105215 | Esophagus | ESCC | regulation of DNA metabolic process | 232/8552 | 359/18723 | 2.40e-13 | 1.13e-11 | 232 |
| GO:007189716 | Esophagus | ESCC | DNA biosynthetic process | 127/8552 | 180/18723 | 1.04e-11 | 3.85e-10 | 127 |
| GO:005105417 | Esophagus | ESCC | positive regulation of DNA metabolic process | 139/8552 | 201/18723 | 1.20e-11 | 4.33e-10 | 139 |
| GO:200057319 | Esophagus | ESCC | positive regulation of DNA biosynthetic process | 56/8552 | 66/18723 | 4.51e-11 | 1.45e-09 | 56 |
| GO:2000278110 | Esophagus | ESCC | regulation of DNA biosynthetic process | 81/8552 | 106/18723 | 9.81e-11 | 2.96e-09 | 81 |
| GO:00062612 | Esophagus | ESCC | DNA-dependent DNA replication | 100/8552 | 151/18723 | 2.61e-07 | 3.94e-06 | 100 |
| GO:00062754 | Esophagus | ESCC | regulation of DNA replication | 73/8552 | 107/18723 | 1.97e-06 | 2.28e-05 | 73 |
| GO:003239214 | Esophagus | ESCC | DNA geometric change | 62/8552 | 90/18723 | 7.02e-06 | 7.04e-05 | 62 |
| GO:003250813 | Esophagus | ESCC | DNA duplex unwinding | 58/8552 | 84/18723 | 1.23e-05 | 1.14e-04 | 58 |
| GO:0090329 | Esophagus | ESCC | regulation of DNA-dependent DNA replication | 30/8552 | 46/18723 | 5.91e-03 | 2.18e-02 | 30 |
| GO:00062603 | Oral cavity | OSCC | DNA replication | 159/7305 | 260/18723 | 3.25e-13 | 1.59e-11 | 159 |
| GO:005105210 | Oral cavity | OSCC | regulation of DNA metabolic process | 207/7305 | 359/18723 | 4.45e-13 | 2.17e-11 | 207 |
| Page: 1 2 |
| Pathway ID | Tissue | Disease Stage | Description | Gene Ratio | Bg Ratio | pvalue | p.adjust | qvalue | Count |
| Page: 1 |
Top |
Cell-cell communication analysis |
| Identification of potential cell-cell interactions between two cell types and their ligand-receptor pairs for different disease states |
| Ligand | Receptor | LRpair | Pathway | Tissue | Disease Stage |
| Page: 1 |
Top |
Single-cell gene regulatory network inference analysis |
| Find out the significant the regulons (TFs) and the target genes of each regulon across cell types for different disease states |
| TF | Cell Type | Tissue | Disease Stage | Target Gene | RSS | Regulon Activity |
| ∗The dot plots of a searched regulon are shown for all cell subpopulations in each disease state of each tissue based on the regulon specific score inferred using pySCENIC and by calculating the average expression. |
| Page: 1 |
Top |
Somatic mutation of malignant transformation related genes |
| Annotation of somatic variants for genes involved in malignant transformation |
| Hugo Symbol | Variant Class | Variant Classification | dbSNP RS | HGVSc | HGVSp | HGVSp Short | SWISSPROT | BIOTYPE | SIFT | PolyPhen | Tumor Sample Barcode | Tissue | Histology | Sex | Age | Stage | Therapy Types | Drugs | Outcome |
| CHTF18 | SNV | Missense_Mutation | rs763378704 | c.34N>A | p.Glu12Lys | p.E12K | Q8WVB6 | protein_coding | deleterious(0.03) | probably_damaging(0.995) | TCGA-5L-AAT1-01 | Breast | breast invasive carcinoma | Female | <65 | III/IV | Hormone Therapy | letrozol | SD |
| CHTF18 | SNV | Missense_Mutation | novel | c.826N>T | p.Ala276Ser | p.A276S | Q8WVB6 | protein_coding | tolerated(0.95) | benign(0.003) | TCGA-A2-A1FV-01 | Breast | breast invasive carcinoma | Female | >=65 | I/II | Chemotherapy | cyclophosphamide | SD |
| CHTF18 | SNV | Missense_Mutation | novel | c.2374C>A | p.Leu792Met | p.L792M | Q8WVB6 | protein_coding | deleterious(0) | probably_damaging(0.996) | TCGA-BH-AB28-01 | Breast | breast invasive carcinoma | Female | <65 | III/IV | Chemotherapy | taxotere | SD |
| CHTF18 | SNV | Missense_Mutation | c.1909N>A | p.His637Asn | p.H637N | Q8WVB6 | protein_coding | deleterious(0.04) | benign(0.045) | TCGA-D8-A1J9-01 | Breast | breast invasive carcinoma | Female | <65 | I/II | Unknown | Unknown | SD | |
| CHTF18 | SNV | Missense_Mutation | c.2202G>C | p.Arg734Ser | p.R734S | Q8WVB6 | protein_coding | tolerated(0.06) | benign(0.013) | TCGA-E9-A228-01 | Breast | breast invasive carcinoma | Female | <65 | I/II | Chemotherapy | doxorubicin | SD | |
| CHTF18 | SNV | Missense_Mutation | novel | c.2218N>A | p.Leu740Met | p.L740M | Q8WVB6 | protein_coding | tolerated(0.96) | benign(0.135) | TCGA-JL-A3YW-01 | Breast | breast invasive carcinoma | Female | <65 | I/II | Unknown | Unknown | SD |
| CHTF18 | SNV | Missense_Mutation | rs199742669 | c.992C>T | p.Pro331Leu | p.P331L | Q8WVB6 | protein_coding | tolerated(0.18) | benign(0.003) | TCGA-2W-A8YY-01 | Cervix | cervical & endocervical cancer | Female | <65 | I/II | Chemotherapy | cisplatin | CR |
| CHTF18 | SNV | Missense_Mutation | rs760334422 | c.1618G>A | p.Ala540Thr | p.A540T | Q8WVB6 | protein_coding | deleterious(0.04) | possibly_damaging(0.488) | TCGA-2W-A8YY-01 | Cervix | cervical & endocervical cancer | Female | <65 | I/II | Chemotherapy | cisplatin | CR |
| CHTF18 | SNV | Missense_Mutation | c.443N>T | p.Ser148Leu | p.S148L | Q8WVB6 | protein_coding | tolerated(0.89) | benign(0) | TCGA-DG-A2KK-01 | Cervix | cervical & endocervical cancer | Female | <65 | III/IV | Chemotherapy | cisplatin | SD | |
| CHTF18 | SNV | Missense_Mutation | novel | c.1952G>A | p.Gly651Asp | p.G651D | Q8WVB6 | protein_coding | deleterious(0) | probably_damaging(0.998) | TCGA-VS-A94Z-01 | Cervix | cervical & endocervical cancer | Female | <65 | I/II | Chemotherapy | cisplatin | CR |
| Page: 1 2 3 4 5 6 7 8 |
Top |
Related drugs of malignant transformation related genes |
| Identification of chemicals and drugs interact with genes involved in malignant transfromation |
| (DGIdb 4.0) |
| Entrez ID | Symbol | Category | Interaction Types | Drug Claim Name | Drug Name | PMIDs |
| Page: 1 |

Copyright 2023-Present -The University of Texas Health Science Center at Houston |