
|
|||||
|
 | |
| |
| |
| |
| |
| |
|
Gene: CHST9 |
Gene summary for CHST9 |
| Gene information | Species | Human | Gene symbol | CHST9 | Gene ID | 83539 |
| Gene name | carbohydrate sulfotransferase 9 | |
| Gene Alias | GALNAC4ST-2 | |
| Cytomap | 18q11.2 | |
| Gene Type | protein-coding | GO ID | GO:0005975 | UniProtAcc | Q7L1S5 |
Top |
Malignant transformation analysis |
| Identification of the aberrant gene expression in precancerous and cancerous lesions by comparing the gene expression of stem-like cells in diseased tissues with normal stem cells |
| Entrez ID | Symbol | Replicates | Species | Organ | Tissue | Adj P-value | Log2FC | Malignancy |
| 83539 | CHST9 | LZE5T | Human | Esophagus | ESCC | 1.40e-10 | 9.82e-01 | 0.0514 |
| 83539 | CHST9 | LZE8T | Human | Esophagus | ESCC | 3.64e-02 | 8.85e-02 | 0.067 |
| 83539 | CHST9 | LZE24T | Human | Esophagus | ESCC | 2.95e-03 | 7.60e-01 | 0.0596 |
| 83539 | CHST9 | P1T-E | Human | Esophagus | ESCC | 1.04e-04 | 4.94e-01 | 0.0875 |
| 83539 | CHST9 | P8T-E | Human | Esophagus | ESCC | 2.78e-59 | 1.58e+00 | 0.0889 |
| 83539 | CHST9 | P10T-E | Human | Esophagus | ESCC | 9.59e-03 | -1.13e-01 | 0.116 |
| 83539 | CHST9 | P12T-E | Human | Esophagus | ESCC | 7.24e-04 | 3.30e-01 | 0.1122 |
| 83539 | CHST9 | P23T-E | Human | Esophagus | ESCC | 3.42e-20 | 8.95e-01 | 0.108 |
| 83539 | CHST9 | P26T-E | Human | Esophagus | ESCC | 4.91e-09 | 3.22e-01 | 0.1276 |
| 83539 | CHST9 | P27T-E | Human | Esophagus | ESCC | 4.02e-24 | 6.93e-01 | 0.1055 |
| 83539 | CHST9 | P39T-E | Human | Esophagus | ESCC | 3.62e-09 | 3.68e-01 | 0.0894 |
| 83539 | CHST9 | P47T-E | Human | Esophagus | ESCC | 3.50e-02 | -1.34e-01 | 0.1067 |
| 83539 | CHST9 | P48T-E | Human | Esophagus | ESCC | 9.01e-14 | 3.78e-01 | 0.0959 |
| 83539 | CHST9 | P54T-E | Human | Esophagus | ESCC | 1.62e-14 | 4.64e-01 | 0.0975 |
| 83539 | CHST9 | P57T-E | Human | Esophagus | ESCC | 3.80e-15 | 6.16e-01 | 0.0926 |
| 83539 | CHST9 | P61T-E | Human | Esophagus | ESCC | 1.50e-40 | 1.86e+00 | 0.099 |
| 83539 | CHST9 | P75T-E | Human | Esophagus | ESCC | 3.07e-12 | 3.50e-01 | 0.1125 |
| 83539 | CHST9 | P76T-E | Human | Esophagus | ESCC | 5.20e-03 | 2.63e-02 | 0.1207 |
| 83539 | CHST9 | P127T-E | Human | Esophagus | ESCC | 7.93e-12 | 3.88e-01 | 0.0826 |
| 83539 | CHST9 | P128T-E | Human | Esophagus | ESCC | 1.61e-46 | 1.95e+00 | 0.1241 |
| Page: 1 2 |
| Tissue | Expression Dynamics | Abbreviation |
| Esophagus | 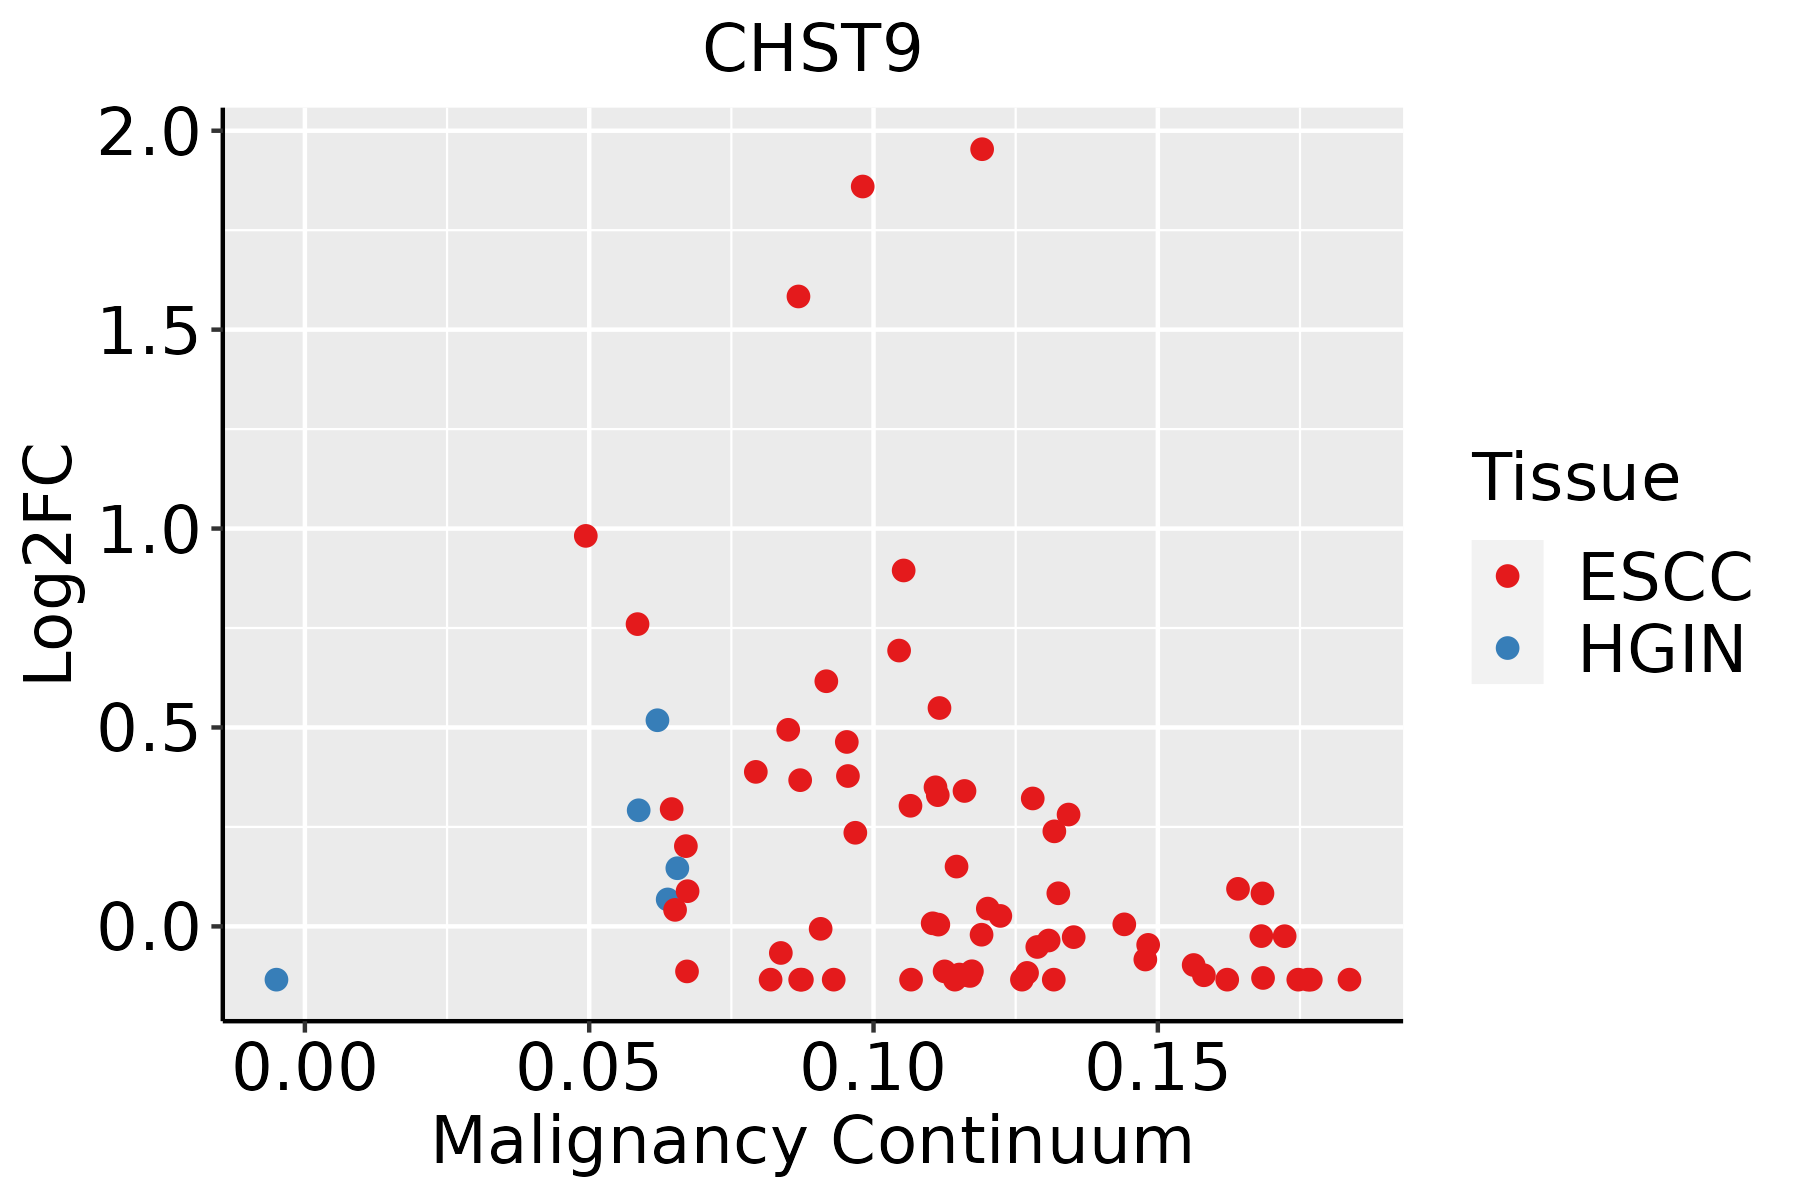 | ESCC: Esophageal squamous cell carcinoma |
| HGIN: High-grade intraepithelial neoplasias | ||
| LGIN: Low-grade intraepithelial neoplasias | ||
| Oral Cavity | 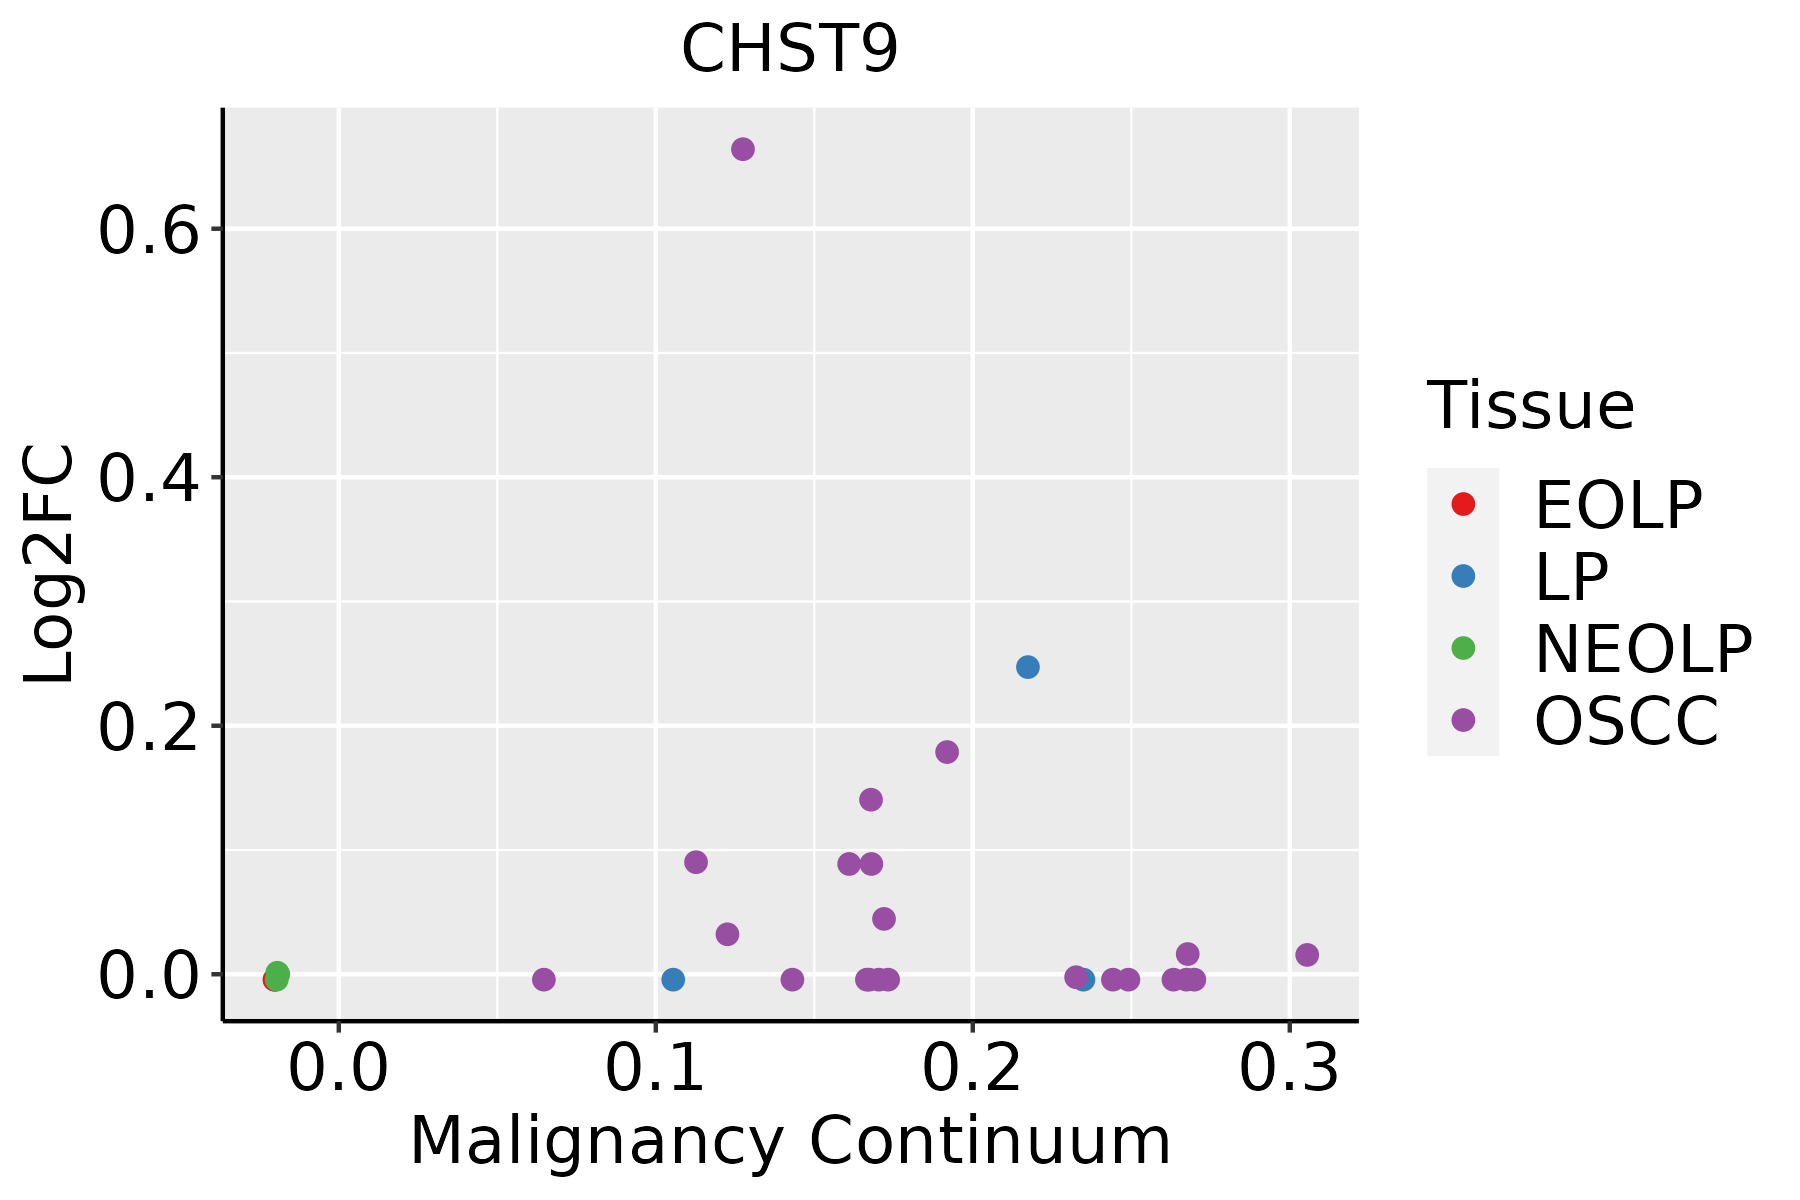 | EOLP: Erosive Oral lichen planus |
| LP: leukoplakia | ||
| NEOLP: Non-erosive oral lichen planus | ||
| OSCC: Oral squamous cell carcinoma |
| ∗log2FC in expression of this searched gene in stem-like cells from each diseased tissue sample relative to stem-like cells in normal samples in each tissue plotted against the malignancy continuum. Samples are colored based on if they are from different disease stage. |
Top |
Malignant transformation related pathway analysis |
| Find out the enriched GO biological processes and KEGG pathways involved in transition from healthy to precancer to cancer |
| Tissue | Disease Stage | Enriched GO biological Processes |
| Colorectum | AD |  |
| Colorectum | SER |  |
| Colorectum | MSS |  |
| Colorectum | MSI-H |  |
| Colorectum | FAP |  |
| ∗Top 15 enriched GO BP terms are showed in the bar plot of each disease state in each tissue. Each row represents a significant GO biological process which is colored according to the -log10(p.adjust). |
| Page: 1 2 3 4 5 6 7 8 9 |
| GO ID | Tissue | Disease Stage | Description | Gene Ratio | Bg Ratio | pvalue | p.adjust | Count |
| GO:00091002 | Esophagus | ESCC | glycoprotein metabolic process | 226/8552 | 387/18723 | 2.64e-07 | 3.94e-06 | 226 |
| GO:00067906 | Esophagus | ESCC | sulfur compound metabolic process | 201/8552 | 339/18723 | 2.64e-07 | 3.94e-06 | 201 |
| GO:00442725 | Esophagus | ESCC | sulfur compound biosynthetic process | 96/8552 | 148/18723 | 1.86e-06 | 2.16e-05 | 96 |
| GO:00091012 | Esophagus | ESCC | glycoprotein biosynthetic process | 181/8552 | 317/18723 | 2.54e-05 | 2.15e-04 | 181 |
| GO:00160514 | Esophagus | ESCC | carbohydrate biosynthetic process | 117/8552 | 202/18723 | 2.96e-04 | 1.79e-03 | 117 |
| GO:0006029 | Esophagus | ESCC | proteoglycan metabolic process | 48/8552 | 79/18723 | 4.93e-03 | 1.89e-02 | 48 |
| GO:0030166 | Esophagus | ESCC | proteoglycan biosynthetic process | 35/8552 | 56/18723 | 8.30e-03 | 2.94e-02 | 35 |
| GO:0006024 | Esophagus | ESCC | glycosaminoglycan biosynthetic process | 45/8552 | 75/18723 | 8.75e-03 | 3.08e-02 | 45 |
| GO:0006023 | Esophagus | ESCC | aminoglycan biosynthetic process | 47/8552 | 79/18723 | 9.29e-03 | 3.23e-02 | 47 |
| GO:00442724 | Oral cavity | OSCC | sulfur compound biosynthetic process | 82/7305 | 148/18723 | 3.71e-05 | 3.31e-04 | 82 |
| GO:00067905 | Oral cavity | OSCC | sulfur compound metabolic process | 168/7305 | 339/18723 | 4.50e-05 | 3.84e-04 | 168 |
| GO:0030206 | Oral cavity | OSCC | chondroitin sulfate biosynthetic process | 15/7305 | 18/18723 | 1.53e-04 | 1.07e-03 | 15 |
| GO:00091001 | Oral cavity | OSCC | glycoprotein metabolic process | 185/7305 | 387/18723 | 2.37e-04 | 1.54e-03 | 185 |
| GO:00091011 | Oral cavity | OSCC | glycoprotein biosynthetic process | 151/7305 | 317/18723 | 1.01e-03 | 5.26e-03 | 151 |
| GO:0050650 | Oral cavity | OSCC | chondroitin sulfate proteoglycan biosynthetic process | 16/7305 | 23/18723 | 2.93e-03 | 1.27e-02 | 16 |
| GO:00160513 | Oral cavity | OSCC | carbohydrate biosynthetic process | 97/7305 | 202/18723 | 5.50e-03 | 2.13e-02 | 97 |
| GO:0030204 | Oral cavity | OSCC | chondroitin sulfate metabolic process | 19/7305 | 30/18723 | 6.03e-03 | 2.28e-02 | 19 |
| Page: 1 |
| Pathway ID | Tissue | Disease Stage | Description | Gene Ratio | Bg Ratio | pvalue | p.adjust | qvalue | Count |
| hsa005136 | Esophagus | ESCC | Various types of N-glycan biosynthesis | 31/4205 | 42/8465 | 1.23e-03 | 3.78e-03 | 1.93e-03 | 31 |
| hsa0051313 | Esophagus | ESCC | Various types of N-glycan biosynthesis | 31/4205 | 42/8465 | 1.23e-03 | 3.78e-03 | 1.93e-03 | 31 |
| Page: 1 |
Top |
Cell-cell communication analysis |
| Identification of potential cell-cell interactions between two cell types and their ligand-receptor pairs for different disease states |
| Ligand | Receptor | LRpair | Pathway | Tissue | Disease Stage |
| Page: 1 |
Top |
Single-cell gene regulatory network inference analysis |
| Find out the significant the regulons (TFs) and the target genes of each regulon across cell types for different disease states |
| TF | Cell Type | Tissue | Disease Stage | Target Gene | RSS | Regulon Activity |
| ∗The dot plots of a searched regulon are shown for all cell subpopulations in each disease state of each tissue based on the regulon specific score inferred using pySCENIC and by calculating the average expression. |
| Page: 1 |
Top |
Somatic mutation of malignant transformation related genes |
| Annotation of somatic variants for genes involved in malignant transformation |
| Hugo Symbol | Variant Class | Variant Classification | dbSNP RS | HGVSc | HGVSp | HGVSp Short | SWISSPROT | BIOTYPE | SIFT | PolyPhen | Tumor Sample Barcode | Tissue | Histology | Sex | Age | Stage | Therapy Types | Drugs | Outcome |
| CHST9 | SNV | Missense_Mutation | c.824A>C | p.Lys275Thr | p.K275T | Q7L1S5 | protein_coding | deleterious(0) | probably_damaging(0.968) | TCGA-A2-A0CX-01 | Breast | breast invasive carcinoma | Female | <65 | I/II | Chemotherapy | adriamycin | SD | |
| CHST9 | SNV | Missense_Mutation | c.497N>C | p.Asn166Thr | p.N166T | Q7L1S5 | protein_coding | tolerated(0.2) | benign(0.034) | TCGA-A2-A0SX-01 | Breast | breast invasive carcinoma | Female | <65 | I/II | Chemotherapy | adriamycin | PD | |
| CHST9 | SNV | Missense_Mutation | c.415N>T | p.Ala139Ser | p.A139S | Q7L1S5 | protein_coding | tolerated(0.54) | benign(0) | TCGA-A2-A25B-01 | Breast | breast invasive carcinoma | Female | <65 | I/II | Chemotherapy | taxotere | PD | |
| CHST9 | SNV | Missense_Mutation | c.668G>C | p.Gly223Ala | p.G223A | Q7L1S5 | protein_coding | tolerated(0.23) | probably_damaging(0.953) | TCGA-E2-A14R-01 | Breast | breast invasive carcinoma | Female | <65 | I/II | Chemotherapy | doxorubicin | PD | |
| CHST9 | insertion | Frame_Shift_Ins | novel | c.724_725insT | p.Tyr242LeufsTer19 | p.Y242Lfs*19 | Q7L1S5 | protein_coding | TCGA-AO-A0JM-01 | Breast | breast invasive carcinoma | Female | <65 | I/II | Chemotherapy | doxorubicin | SD | ||
| CHST9 | SNV | Missense_Mutation | c.1228N>A | p.Val410Met | p.V410M | Q7L1S5 | protein_coding | deleterious(0.02) | probably_damaging(0.98) | TCGA-A6-5667-01 | Colorectum | colon adenocarcinoma | Female | <65 | III/IV | Chemotherapy | oxaliplatin | SD | |
| CHST9 | SNV | Missense_Mutation | novel | c.1204G>T | p.Asp402Tyr | p.D402Y | Q7L1S5 | protein_coding | deleterious(0) | probably_damaging(0.988) | TCGA-AA-3949-01 | Colorectum | colon adenocarcinoma | Female | >=65 | III/IV | Unknown | Unknown | SD |
| CHST9 | SNV | Missense_Mutation | c.977N>A | p.Ser326Tyr | p.S326Y | Q7L1S5 | protein_coding | deleterious(0) | probably_damaging(0.986) | TCGA-AA-3977-01 | Colorectum | colon adenocarcinoma | Male | >=65 | I/II | Unknown | Unknown | SD | |
| CHST9 | SNV | Missense_Mutation | novel | c.632N>C | p.Lys211Thr | p.K211T | Q7L1S5 | protein_coding | deleterious(0.02) | benign(0.386) | TCGA-AA-3984-01 | Colorectum | colon adenocarcinoma | Female | <65 | I/II | Unknown | Unknown | SD |
| CHST9 | SNV | Missense_Mutation | c.665N>T | p.Ala222Val | p.A222V | Q7L1S5 | protein_coding | tolerated(0.25) | possibly_damaging(0.447) | TCGA-AA-A00N-01 | Colorectum | colon adenocarcinoma | Male | >=65 | I/II | Unknown | Unknown | PD |
| Page: 1 2 3 4 5 6 |
Top |
Related drugs of malignant transformation related genes |
| Identification of chemicals and drugs interact with genes involved in malignant transfromation |
| (DGIdb 4.0) |
| Entrez ID | Symbol | Category | Interaction Types | Drug Claim Name | Drug Name | PMIDs |
| Page: 1 |

Copyright 2023-Present -The University of Texas Health Science Center at Houston |