
|
|||||
|
 | |
| |
| |
| |
| |
| |
|
Gene: CHST7 |
Gene summary for CHST7 |
| Gene information | Species | Human | Gene symbol | CHST7 | Gene ID | 56548 |
| Gene name | carbohydrate sulfotransferase 7 | |
| Gene Alias | C6ST-2 | |
| Cytomap | Xp11.3 | |
| Gene Type | protein-coding | GO ID | GO:0005975 | UniProtAcc | Q9NS84 |
Top |
Malignant transformation analysis |
| Identification of the aberrant gene expression in precancerous and cancerous lesions by comparing the gene expression of stem-like cells in diseased tissues with normal stem cells |
| Entrez ID | Symbol | Replicates | Species | Organ | Tissue | Adj P-value | Log2FC | Malignancy |
| 56548 | CHST7 | LZE4T | Human | Esophagus | ESCC | 2.31e-06 | 3.35e-01 | 0.0811 |
| 56548 | CHST7 | LZE24T | Human | Esophagus | ESCC | 2.21e-05 | 1.10e-01 | 0.0596 |
| 56548 | CHST7 | LZE21T | Human | Esophagus | ESCC | 6.22e-03 | 2.59e-01 | 0.0655 |
| 56548 | CHST7 | P2T-E | Human | Esophagus | ESCC | 8.05e-13 | 2.13e-01 | 0.1177 |
| 56548 | CHST7 | P4T-E | Human | Esophagus | ESCC | 4.12e-15 | 3.51e-01 | 0.1323 |
| 56548 | CHST7 | P5T-E | Human | Esophagus | ESCC | 1.80e-12 | 3.04e-01 | 0.1327 |
| 56548 | CHST7 | P8T-E | Human | Esophagus | ESCC | 7.64e-08 | 7.42e-02 | 0.0889 |
| 56548 | CHST7 | P9T-E | Human | Esophagus | ESCC | 6.13e-16 | 4.50e-01 | 0.1131 |
| 56548 | CHST7 | P10T-E | Human | Esophagus | ESCC | 2.40e-24 | 4.64e-01 | 0.116 |
| 56548 | CHST7 | P12T-E | Human | Esophagus | ESCC | 4.72e-19 | 4.05e-01 | 0.1122 |
| 56548 | CHST7 | P15T-E | Human | Esophagus | ESCC | 1.68e-21 | 4.63e-01 | 0.1149 |
| 56548 | CHST7 | P22T-E | Human | Esophagus | ESCC | 6.14e-12 | 2.04e-01 | 0.1236 |
| 56548 | CHST7 | P23T-E | Human | Esophagus | ESCC | 1.10e-13 | 4.44e-01 | 0.108 |
| 56548 | CHST7 | P24T-E | Human | Esophagus | ESCC | 1.84e-09 | 7.40e-02 | 0.1287 |
| 56548 | CHST7 | P26T-E | Human | Esophagus | ESCC | 4.65e-57 | 1.02e+00 | 0.1276 |
| 56548 | CHST7 | P27T-E | Human | Esophagus | ESCC | 1.41e-24 | 4.81e-01 | 0.1055 |
| 56548 | CHST7 | P28T-E | Human | Esophagus | ESCC | 6.21e-29 | 5.95e-01 | 0.1149 |
| 56548 | CHST7 | P30T-E | Human | Esophagus | ESCC | 8.64e-22 | 9.35e-01 | 0.137 |
| 56548 | CHST7 | P31T-E | Human | Esophagus | ESCC | 2.82e-27 | 5.26e-01 | 0.1251 |
| 56548 | CHST7 | P32T-E | Human | Esophagus | ESCC | 3.82e-07 | 1.89e-01 | 0.1666 |
| Page: 1 2 3 |
| Tissue | Expression Dynamics | Abbreviation |
| Esophagus | 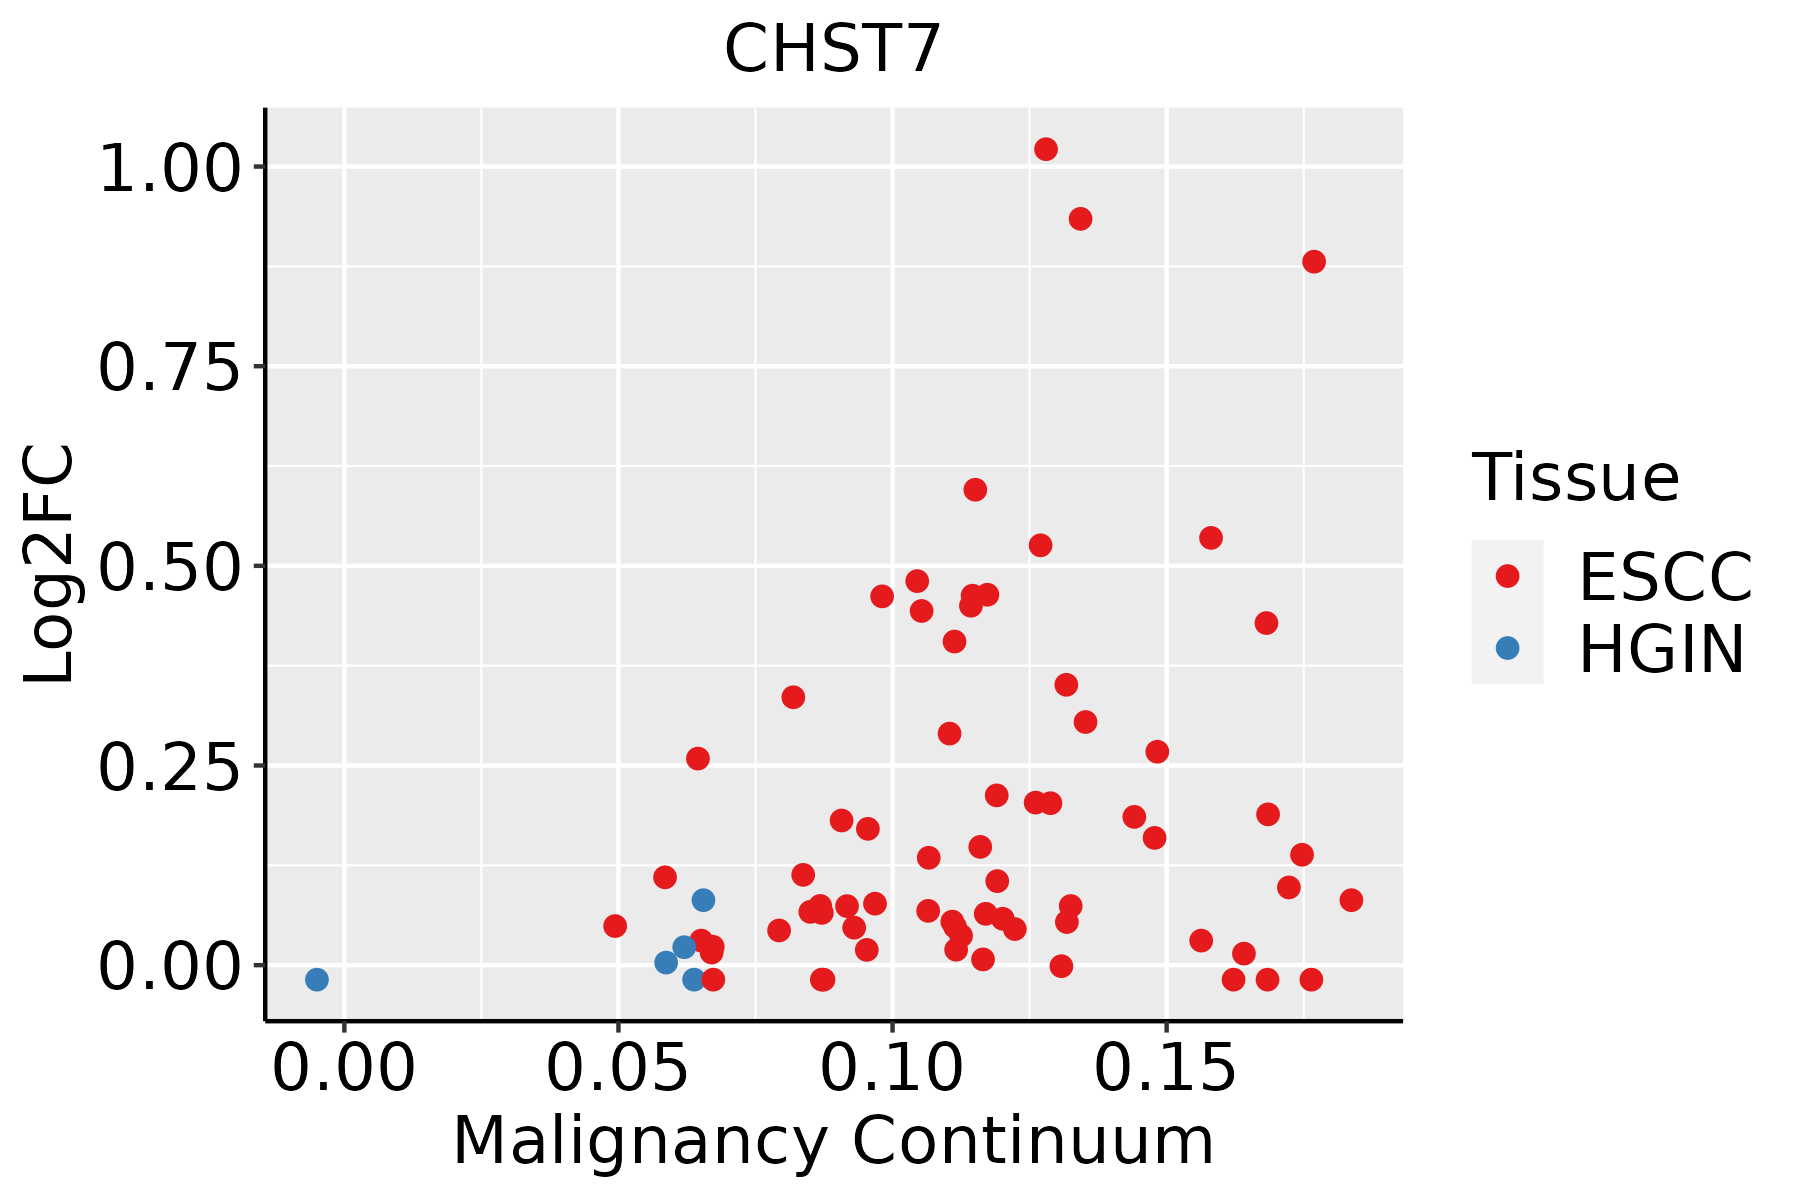 | ESCC: Esophageal squamous cell carcinoma |
| HGIN: High-grade intraepithelial neoplasias | ||
| LGIN: Low-grade intraepithelial neoplasias | ||
| Oral Cavity | 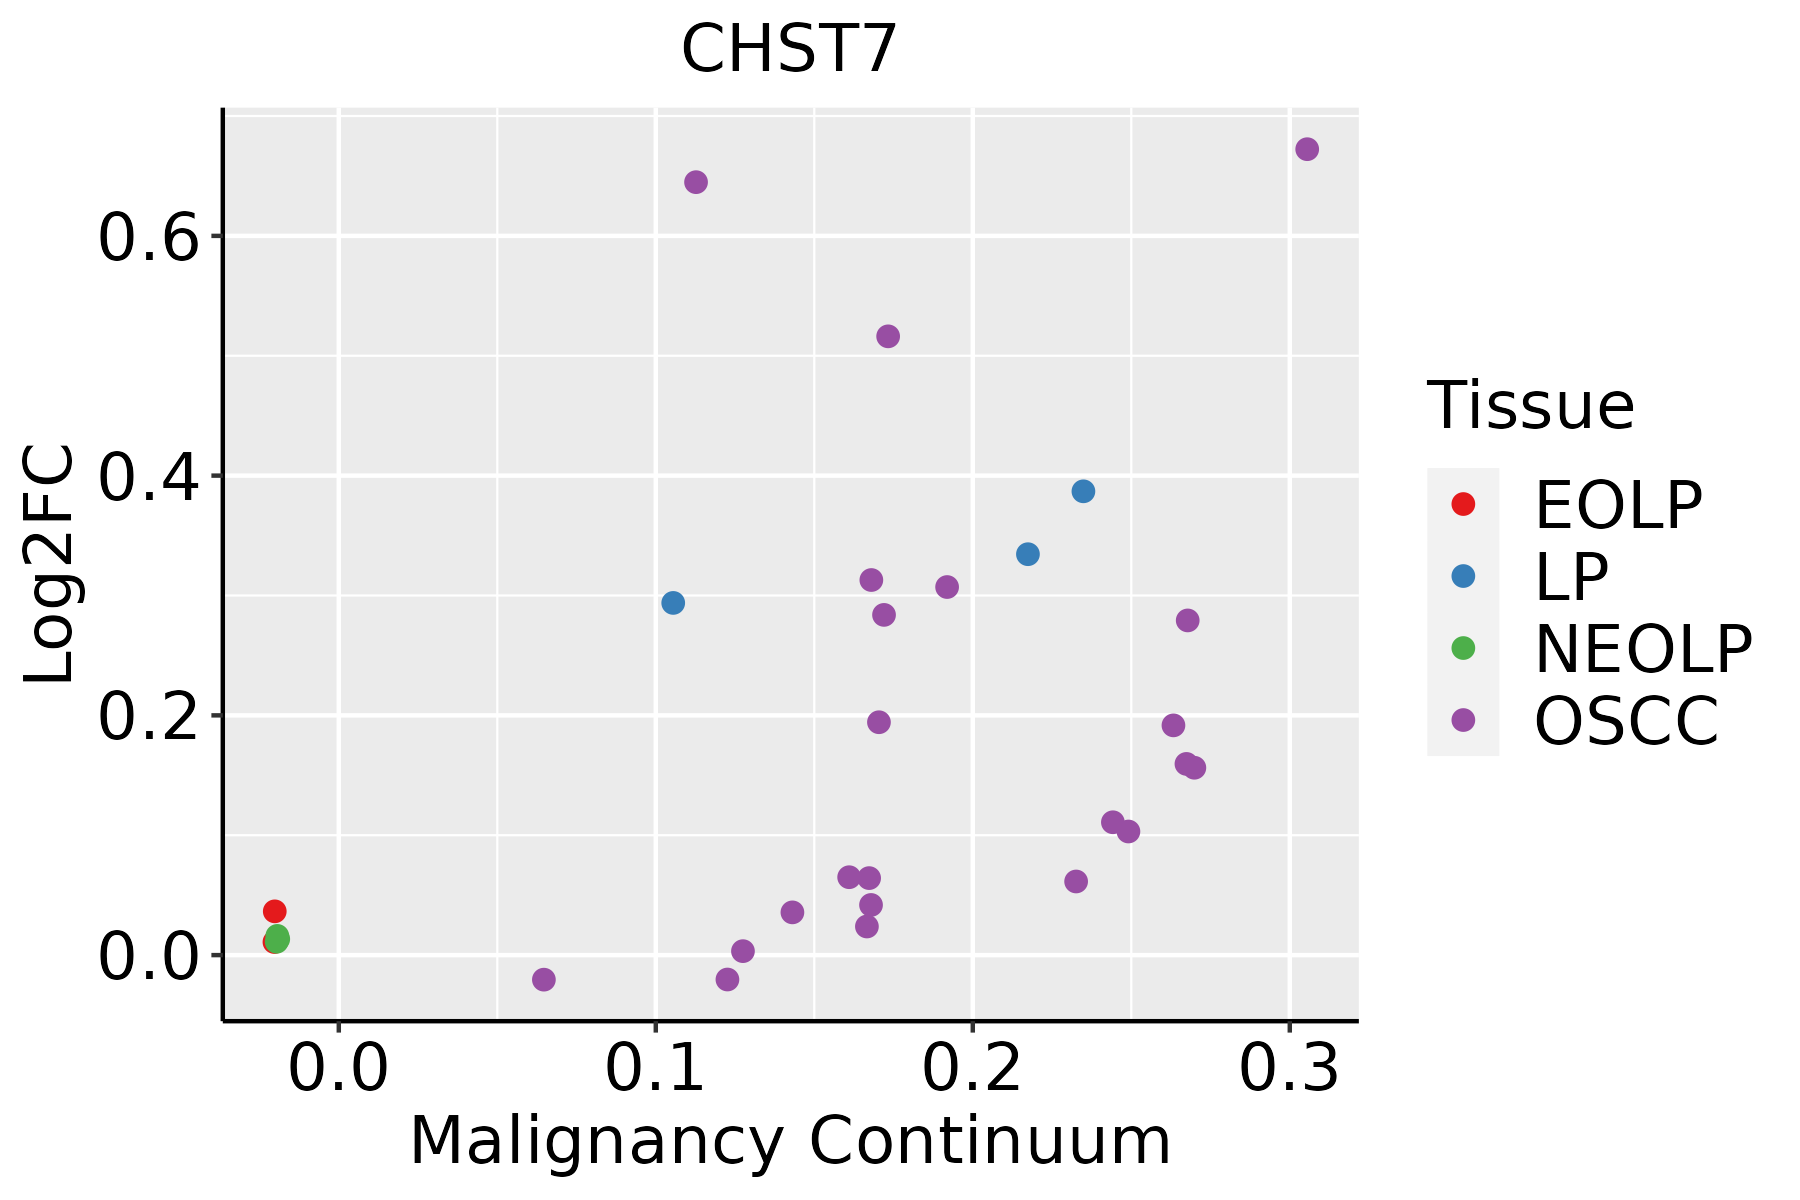 | EOLP: Erosive Oral lichen planus |
| LP: leukoplakia | ||
| NEOLP: Non-erosive oral lichen planus | ||
| OSCC: Oral squamous cell carcinoma |
| ∗log2FC in expression of this searched gene in stem-like cells from each diseased tissue sample relative to stem-like cells in normal samples in each tissue plotted against the malignancy continuum. Samples are colored based on if they are from different disease stage. |
Top |
Malignant transformation related pathway analysis |
| Find out the enriched GO biological processes and KEGG pathways involved in transition from healthy to precancer to cancer |
| Tissue | Disease Stage | Enriched GO biological Processes |
| Colorectum | AD |  |
| Colorectum | SER |  |
| Colorectum | MSS |  |
| Colorectum | MSI-H |  |
| Colorectum | FAP |  |
| ∗Top 15 enriched GO BP terms are showed in the bar plot of each disease state in each tissue. Each row represents a significant GO biological process which is colored according to the -log10(p.adjust). |
| Page: 1 2 3 4 5 6 7 8 9 |
| GO ID | Tissue | Disease Stage | Description | Gene Ratio | Bg Ratio | pvalue | p.adjust | Count |
| GO:00091002 | Esophagus | ESCC | glycoprotein metabolic process | 226/8552 | 387/18723 | 2.64e-07 | 3.94e-06 | 226 |
| GO:00067906 | Esophagus | ESCC | sulfur compound metabolic process | 201/8552 | 339/18723 | 2.64e-07 | 3.94e-06 | 201 |
| GO:00442725 | Esophagus | ESCC | sulfur compound biosynthetic process | 96/8552 | 148/18723 | 1.86e-06 | 2.16e-05 | 96 |
| GO:00091012 | Esophagus | ESCC | glycoprotein biosynthetic process | 181/8552 | 317/18723 | 2.54e-05 | 2.15e-04 | 181 |
| GO:0006029 | Esophagus | ESCC | proteoglycan metabolic process | 48/8552 | 79/18723 | 4.93e-03 | 1.89e-02 | 48 |
| GO:0030166 | Esophagus | ESCC | proteoglycan biosynthetic process | 35/8552 | 56/18723 | 8.30e-03 | 2.94e-02 | 35 |
| GO:0006024 | Esophagus | ESCC | glycosaminoglycan biosynthetic process | 45/8552 | 75/18723 | 8.75e-03 | 3.08e-02 | 45 |
| GO:0006023 | Esophagus | ESCC | aminoglycan biosynthetic process | 47/8552 | 79/18723 | 9.29e-03 | 3.23e-02 | 47 |
| GO:00442724 | Oral cavity | OSCC | sulfur compound biosynthetic process | 82/7305 | 148/18723 | 3.71e-05 | 3.31e-04 | 82 |
| GO:00067905 | Oral cavity | OSCC | sulfur compound metabolic process | 168/7305 | 339/18723 | 4.50e-05 | 3.84e-04 | 168 |
| GO:0030206 | Oral cavity | OSCC | chondroitin sulfate biosynthetic process | 15/7305 | 18/18723 | 1.53e-04 | 1.07e-03 | 15 |
| GO:00091001 | Oral cavity | OSCC | glycoprotein metabolic process | 185/7305 | 387/18723 | 2.37e-04 | 1.54e-03 | 185 |
| GO:00091011 | Oral cavity | OSCC | glycoprotein biosynthetic process | 151/7305 | 317/18723 | 1.01e-03 | 5.26e-03 | 151 |
| GO:0050650 | Oral cavity | OSCC | chondroitin sulfate proteoglycan biosynthetic process | 16/7305 | 23/18723 | 2.93e-03 | 1.27e-02 | 16 |
| GO:0030204 | Oral cavity | OSCC | chondroitin sulfate metabolic process | 19/7305 | 30/18723 | 6.03e-03 | 2.28e-02 | 19 |
| GO:0006040 | Oral cavity | OSCC | amino sugar metabolic process | 24/7305 | 42/18723 | 1.30e-02 | 4.34e-02 | 24 |
| Page: 1 |
| Pathway ID | Tissue | Disease Stage | Description | Gene Ratio | Bg Ratio | pvalue | p.adjust | qvalue | Count |
| hsa00532 | Oral cavity | OSCC | Glycosaminoglycan biosynthesis - chondroitin sulfate / dermatan sulfate | 16/3704 | 21/8465 | 2.61e-03 | 6.77e-03 | 3.45e-03 | 16 |
| hsa005321 | Oral cavity | OSCC | Glycosaminoglycan biosynthesis - chondroitin sulfate / dermatan sulfate | 16/3704 | 21/8465 | 2.61e-03 | 6.77e-03 | 3.45e-03 | 16 |
| Page: 1 |
Top |
Cell-cell communication analysis |
| Identification of potential cell-cell interactions between two cell types and their ligand-receptor pairs for different disease states |
| Ligand | Receptor | LRpair | Pathway | Tissue | Disease Stage |
| Page: 1 |
Top |
Single-cell gene regulatory network inference analysis |
| Find out the significant the regulons (TFs) and the target genes of each regulon across cell types for different disease states |
| TF | Cell Type | Tissue | Disease Stage | Target Gene | RSS | Regulon Activity |
| ∗The dot plots of a searched regulon are shown for all cell subpopulations in each disease state of each tissue based on the regulon specific score inferred using pySCENIC and by calculating the average expression. |
| Page: 1 |
Top |
Somatic mutation of malignant transformation related genes |
| Annotation of somatic variants for genes involved in malignant transformation |
| Hugo Symbol | Variant Class | Variant Classification | dbSNP RS | HGVSc | HGVSp | HGVSp Short | SWISSPROT | BIOTYPE | SIFT | PolyPhen | Tumor Sample Barcode | Tissue | Histology | Sex | Age | Stage | Therapy Types | Drugs | Outcome |
| CHST7 | SNV | Missense_Mutation | c.499N>A | p.Val167Met | p.V167M | Q9NS84 | protein_coding | deleterious(0) | probably_damaging(0.995) | TCGA-AC-A23G-01 | Breast | breast invasive carcinoma | Female | >=65 | I/II | Chemotherapy | cytoxan | CR | |
| CHST7 | SNV | Missense_Mutation | novel | c.136N>A | p.Pro46Thr | p.P46T | Q9NS84 | protein_coding | deleterious_low_confidence(0.04) | benign(0.007) | TCGA-BH-A0B6-01 | Breast | breast invasive carcinoma | Female | <65 | I/II | Unknown | Unknown | SD |
| CHST7 | SNV | Missense_Mutation | c.643G>A | p.Ala215Thr | p.A215T | Q9NS84 | protein_coding | tolerated(0.56) | possibly_damaging(0.747) | TCGA-D8-A1XZ-01 | Breast | breast invasive carcinoma | Female | >=65 | III/IV | Hormone Therapy | tamoxiphen+anastrozolum | SD | |
| CHST7 | SNV | Missense_Mutation | c.637G>A | p.Ala213Thr | p.A213T | Q9NS84 | protein_coding | tolerated(0.74) | benign(0.003) | TCGA-E2-A15P-01 | Breast | breast invasive carcinoma | Female | <65 | I/II | Hormone Therapy | arimidex | SD | |
| CHST7 | SNV | Missense_Mutation | novel | c.107N>A | p.Arg36His | p.R36H | Q9NS84 | protein_coding | deleterious_low_confidence(0.03) | benign(0.143) | TCGA-2W-A8YY-01 | Cervix | cervical & endocervical cancer | Female | <65 | I/II | Chemotherapy | cisplatin | CR |
| CHST7 | SNV | Missense_Mutation | novel | c.332N>A | p.Arg111His | p.R111H | Q9NS84 | protein_coding | deleterious(0) | probably_damaging(0.995) | TCGA-2W-A8YY-01 | Cervix | cervical & endocervical cancer | Female | <65 | I/II | Chemotherapy | cisplatin | CR |
| CHST7 | SNV | Missense_Mutation | novel | c.587N>A | p.Arg196Gln | p.R196Q | Q9NS84 | protein_coding | tolerated(0.16) | benign(0.24) | TCGA-2W-A8YY-01 | Cervix | cervical & endocervical cancer | Female | <65 | I/II | Chemotherapy | cisplatin | CR |
| CHST7 | SNV | Missense_Mutation | novel | c.89N>T | p.Ser30Phe | p.S30F | Q9NS84 | protein_coding | tolerated_low_confidence(0.25) | benign(0.048) | TCGA-VS-A94X-01 | Cervix | cervical & endocervical cancer | Female | <65 | I/II | Chemotherapy | cisplatin | PD |
| CHST7 | SNV | Missense_Mutation | novel | c.832C>T | p.Arg278Cys | p.R278C | Q9NS84 | protein_coding | deleterious(0.02) | probably_damaging(1) | TCGA-VS-A9U5-01 | Cervix | cervical & endocervical cancer | Female | <65 | I/II | Chemotherapy | cisplatin | CR |
| CHST7 | SNV | Missense_Mutation | c.428N>T | p.Pro143Leu | p.P143L | Q9NS84 | protein_coding | deleterious(0) | probably_damaging(1) | TCGA-CK-4951-01 | Colorectum | colon adenocarcinoma | Female | >=65 | I/II | Unknown | Unknown | PD |
| Page: 1 2 3 4 5 |
Top |
Related drugs of malignant transformation related genes |
| Identification of chemicals and drugs interact with genes involved in malignant transfromation |
| (DGIdb 4.0) |
| Entrez ID | Symbol | Category | Interaction Types | Drug Claim Name | Drug Name | PMIDs |
| Page: 1 |

Copyright 2023-Present -The University of Texas Health Science Center at Houston |