
|
|||||
|
 | |
| |
| |
| |
| |
| |
|
Gene: CHST6 |
Gene summary for CHST6 |
| Gene information | Species | Human | Gene symbol | CHST6 | Gene ID | 4166 |
| Gene name | carbohydrate sulfotransferase 6 | |
| Gene Alias | C-GlcNAc6ST | |
| Cytomap | 16q23.1 | |
| Gene Type | protein-coding | GO ID | GO:0005975 | UniProtAcc | Q9GZX3 |
Top |
Malignant transformation analysis |
| Identification of the aberrant gene expression in precancerous and cancerous lesions by comparing the gene expression of stem-like cells in diseased tissues with normal stem cells |
| Entrez ID | Symbol | Replicates | Species | Organ | Tissue | Adj P-value | Log2FC | Malignancy |
| 4166 | CHST6 | HCC1 | Human | Liver | HCC | 4.08e-22 | 1.88e+00 | 0.5336 |
| 4166 | CHST6 | HCC2 | Human | Liver | HCC | 1.80e-31 | 2.05e+00 | 0.5341 |
| 4166 | CHST6 | HCC5 | Human | Liver | HCC | 1.53e-37 | 2.07e+00 | 0.4932 |
| Page: 1 |
| Tissue | Expression Dynamics | Abbreviation |
| Liver | 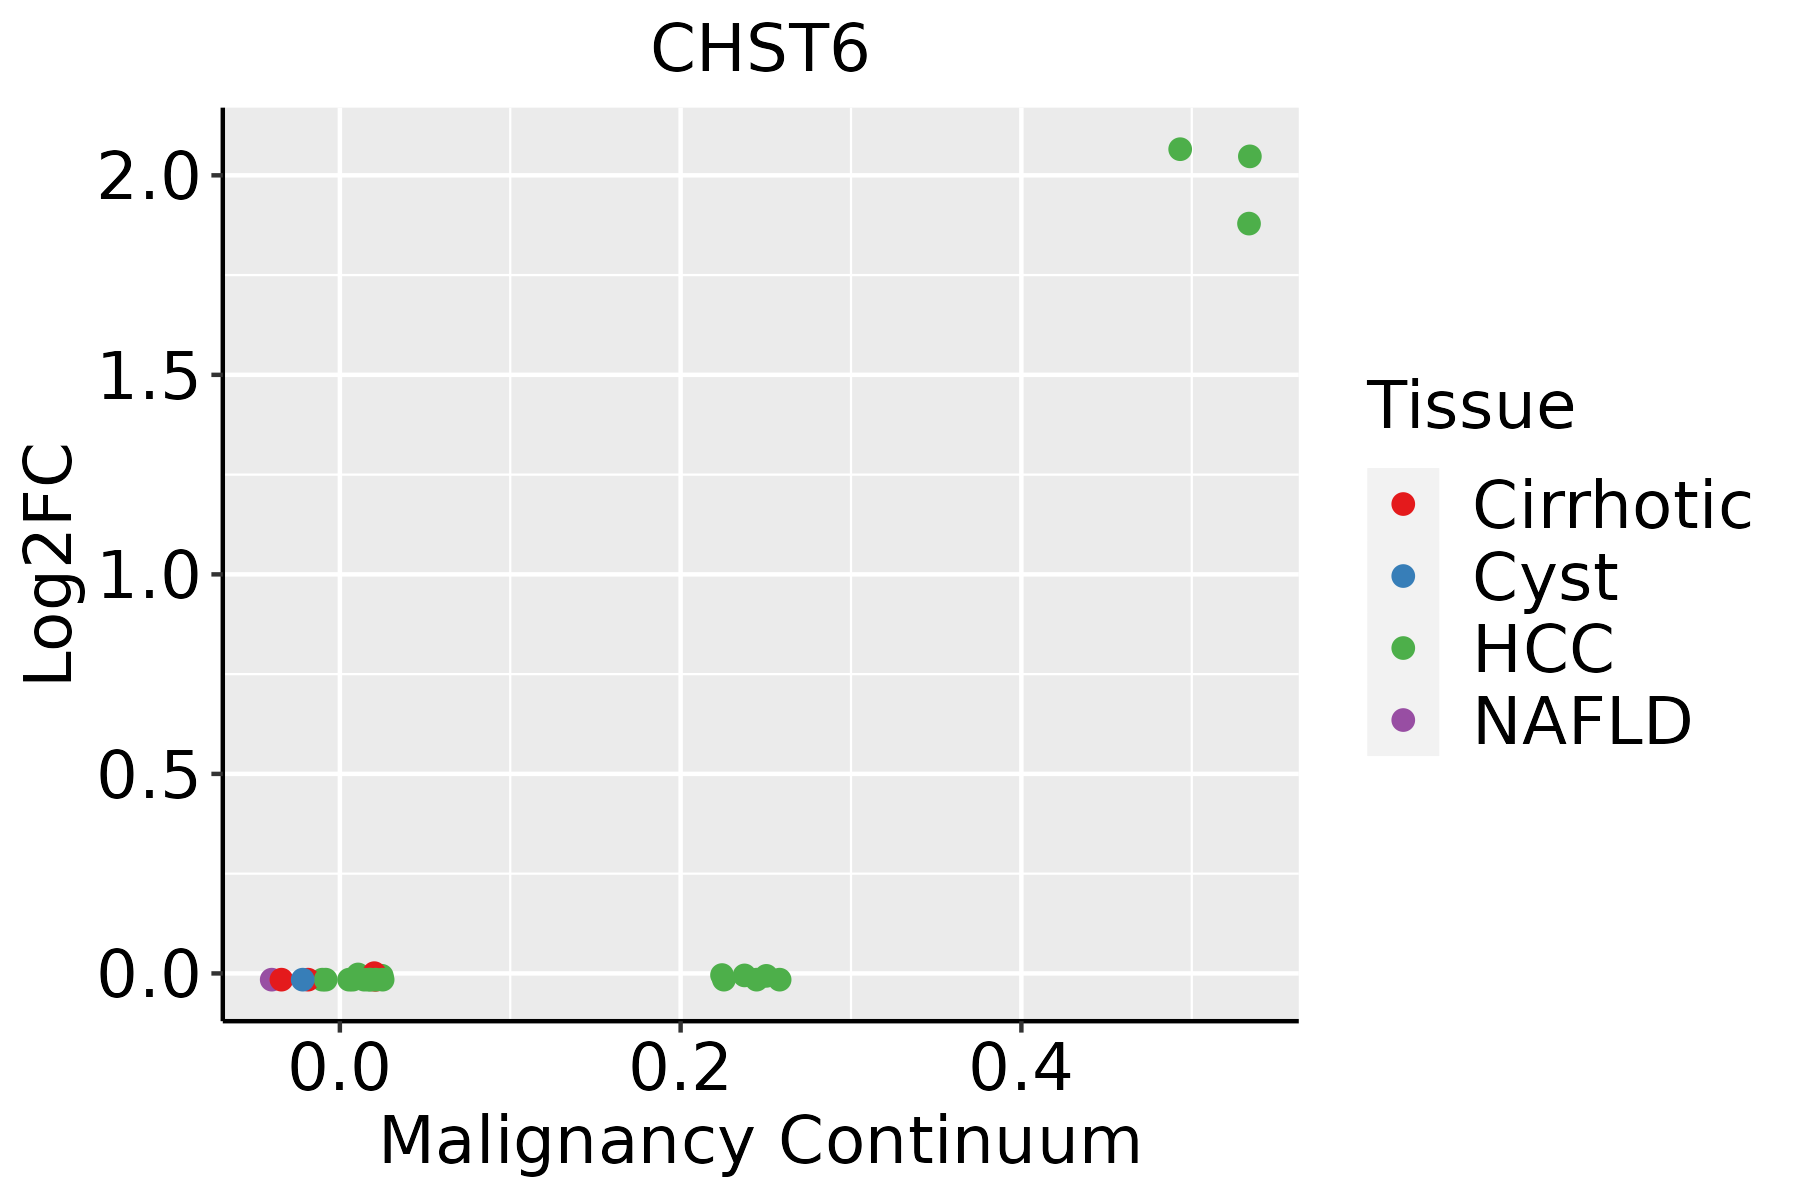 | HCC: Hepatocellular carcinoma |
| NAFLD: Non-alcoholic fatty liver disease |
| ∗log2FC in expression of this searched gene in stem-like cells from each diseased tissue sample relative to stem-like cells in normal samples in each tissue plotted against the malignancy continuum. Samples are colored based on if they are from different disease stage. |
Top |
Malignant transformation related pathway analysis |
| Find out the enriched GO biological processes and KEGG pathways involved in transition from healthy to precancer to cancer |
| Tissue | Disease Stage | Enriched GO biological Processes |
| Colorectum | AD |  |
| Colorectum | SER |  |
| Colorectum | MSS |  |
| Colorectum | MSI-H |  |
| Colorectum | FAP |  |
| ∗Top 15 enriched GO BP terms are showed in the bar plot of each disease state in each tissue. Each row represents a significant GO biological process which is colored according to the -log10(p.adjust). |
| Page: 1 2 3 4 5 6 7 8 9 |
| GO ID | Tissue | Disease Stage | Description | Gene Ratio | Bg Ratio | pvalue | p.adjust | Count |
| GO:000679021 | Liver | HCC | sulfur compound metabolic process | 212/7958 | 339/18723 | 5.60e-14 | 3.39e-12 | 212 |
| GO:00442722 | Liver | HCC | sulfur compound biosynthetic process | 95/7958 | 148/18723 | 7.89e-08 | 1.58e-06 | 95 |
| Page: 1 |
| Pathway ID | Tissue | Disease Stage | Description | Gene Ratio | Bg Ratio | pvalue | p.adjust | qvalue | Count |
| Page: 1 |
Top |
Cell-cell communication analysis |
| Identification of potential cell-cell interactions between two cell types and their ligand-receptor pairs for different disease states |
| Ligand | Receptor | LRpair | Pathway | Tissue | Disease Stage |
| Page: 1 |
Top |
Single-cell gene regulatory network inference analysis |
| Find out the significant the regulons (TFs) and the target genes of each regulon across cell types for different disease states |
| TF | Cell Type | Tissue | Disease Stage | Target Gene | RSS | Regulon Activity |
| ∗The dot plots of a searched regulon are shown for all cell subpopulations in each disease state of each tissue based on the regulon specific score inferred using pySCENIC and by calculating the average expression. |
| Page: 1 |
Top |
Somatic mutation of malignant transformation related genes |
| Annotation of somatic variants for genes involved in malignant transformation |
| Hugo Symbol | Variant Class | Variant Classification | dbSNP RS | HGVSc | HGVSp | HGVSp Short | SWISSPROT | BIOTYPE | SIFT | PolyPhen | Tumor Sample Barcode | Tissue | Histology | Sex | Age | Stage | Therapy Types | Drugs | Outcome |
| CHST6 | SNV | Missense_Mutation | rs2550908 | c.460G>A | p.Ala154Thr | p.A154T | Q9GZX3 | protein_coding | tolerated(0.25) | benign(0.009) | TCGA-EA-A410-01 | Cervix | cervical & endocervical cancer | Female | <65 | I/II | Unknown | Unknown | SD |
| CHST6 | SNV | Missense_Mutation | c.1031G>A | p.Arg344His | p.R344H | Q9GZX3 | protein_coding | deleterious(0.02) | possibly_damaging(0.908) | TCGA-A6-3809-01 | Colorectum | colon adenocarcinoma | Female | >=65 | I/II | Unknown | Unknown | SD | |
| CHST6 | SNV | Missense_Mutation | c.1090G>A | p.Glu364Lys | p.E364K | Q9GZX3 | protein_coding | tolerated(0.05) | possibly_damaging(0.616) | TCGA-AD-6895-01 | Colorectum | colon adenocarcinoma | Male | >=65 | III/IV | Unknown | Unknown | SD | |
| CHST6 | SNV | Missense_Mutation | c.316G>A | p.Val106Met | p.V106M | Q9GZX3 | protein_coding | deleterious(0) | probably_damaging(0.998) | TCGA-AZ-4682-01 | Colorectum | colon adenocarcinoma | Male | <65 | I/II | Chemotherapy | camptosar | PD | |
| CHST6 | SNV | Missense_Mutation | c.161C>T | p.Ser54Phe | p.S54F | Q9GZX3 | protein_coding | deleterious(0) | probably_damaging(0.998) | TCGA-CK-4951-01 | Colorectum | colon adenocarcinoma | Female | >=65 | I/II | Unknown | Unknown | PD | |
| CHST6 | SNV | Missense_Mutation | c.859N>G | p.Leu287Val | p.L287V | Q9GZX3 | protein_coding | deleterious(0.01) | benign(0.199) | TCGA-CM-5348-01 | Colorectum | colon adenocarcinoma | Male | >=65 | III/IV | Unknown | Unknown | SD | |
| CHST6 | SNV | Missense_Mutation | c.865N>A | p.Ala289Thr | p.A289T | Q9GZX3 | protein_coding | tolerated(0.24) | benign(0.017) | TCGA-G4-6315-01 | Colorectum | colon adenocarcinoma | Male | >=65 | III/IV | Chemotherapy | fluorouracil | SD | |
| CHST6 | SNV | Missense_Mutation | c.511G>A | p.Val171Met | p.V171M | Q9GZX3 | protein_coding | deleterious(0) | probably_damaging(0.995) | TCGA-G4-6628-01 | Colorectum | colon adenocarcinoma | Male | >=65 | I/II | Unknown | Unknown | SD | |
| CHST6 | SNV | Missense_Mutation | c.370N>A | p.Ala124Thr | p.A124T | Q9GZX3 | protein_coding | tolerated(0.28) | benign(0.297) | TCGA-EI-6882-01 | Colorectum | rectum adenocarcinoma | Male | <65 | I/II | Unknown | Unknown | SD | |
| CHST6 | SNV | Missense_Mutation | rs72547549 | c.91N>T | p.Pro31Ser | p.P31S | Q9GZX3 | protein_coding | tolerated(0.68) | benign(0.054) | TCGA-A5-A1OF-01 | Endometrium | uterine corpus endometrioid carcinoma | Female | <65 | I/II | Unknown | Unknown | SD |
| Page: 1 2 3 4 5 6 7 |
Top |
Related drugs of malignant transformation related genes |
| Identification of chemicals and drugs interact with genes involved in malignant transfromation |
| (DGIdb 4.0) |
| Entrez ID | Symbol | Category | Interaction Types | Drug Claim Name | Drug Name | PMIDs |
| Page: 1 |

Copyright 2023-Present -The University of Texas Health Science Center at Houston |