Schematic overview of the cellular and molecular mechanisms involved in the cancer progression, including the proposed cellular and molecular mechanisms in cancer cells trajectory. AT1: alveolar type 1 cells; AT2: alveolar type 2 cells; AAH: atypical adenomatous hyperplasia; AIS: adenocarcinoma in situ; MIA: minimally invasive adenocarcinoma; IA: invasive adenocarcinoma; EMT: epithelial-mesenchymal transition

Home

Download

Statistics

Help

Contact

Center for Computational Systems Medicine
leaf

Gene summary

leaf

Malignant transformation analysis

leaf

Malignant transformation related pathway analysis

leaf

Cell-cell communication analysis

leaf

Single-cell gene regulatory network inference analysis

leaf

Somatic mutation of malignant transformation related genes

leaf

Related drugs of malignant transformation related genes

Gene: CHST2

Gene summary for CHST2

check button Gene summary.

Gene informationSpeciesHuman
Gene symbol

CHST2

Gene ID

9435

Gene namecarbohydrate sulfotransferase 2
Gene AliasC6ST
Cytomap3q24
Gene Typeprotein-coding
GO ID

GO:0002376

UniProtAcc

Q9Y4C5


Top

Malignant transformation analysis

check button Identification of the aberrant gene expression in precancerous and cancerous lesions by comparing the gene expression of stem-like cells in diseased tissues with normal stem cells
check button Malignant transformation involving gene list.
Entrez IDSymbolReplicatesSpeciesOrganTissueAdj P-valueLog2FCMalignancy
9435CHST2P9T-EHumanEsophagusESCC6.79e-083.24e-010.1131
9435CHST2P10T-EHumanEsophagusESCC2.26e-214.60e-010.116
9435CHST2P22T-EHumanEsophagusESCC2.87e-072.29e-010.1236
9435CHST2P28T-EHumanEsophagusESCC9.21e-245.27e-010.1149
9435CHST2P30T-EHumanEsophagusESCC4.08e-115.80e-010.137
9435CHST2P31T-EHumanEsophagusESCC1.01e-039.49e-020.1251
9435CHST2P32T-EHumanEsophagusESCC3.16e-036.32e-020.1666
9435CHST2P36T-EHumanEsophagusESCC9.47e-058.76e-010.1187
9435CHST2P52T-EHumanEsophagusESCC2.59e-031.62e-010.1555
9435CHST2P62T-EHumanEsophagusESCC5.07e-052.01e-010.1302
9435CHST2P91T-EHumanEsophagusESCC1.18e-045.30e-010.1828
9435CHST2P107T-EHumanEsophagusESCC3.43e-021.97e-010.171
9435CHST2C04HumanOral cavityOSCC5.43e-239.84e-010.2633
9435CHST2C21HumanOral cavityOSCC3.38e-093.50e-010.2678
9435CHST2C30HumanOral cavityOSCC1.66e-105.78e-010.3055
9435CHST2C38HumanOral cavityOSCC1.21e-091.26e+000.172
9435CHST2C43HumanOral cavityOSCC5.37e-204.22e-010.1704
9435CHST2C51HumanOral cavityOSCC2.00e-168.23e-010.2674
9435CHST2C06HumanOral cavityOSCC7.70e-152.06e+000.2699
9435CHST2C07HumanOral cavityOSCC2.05e-028.86e-010.2491
Page: 1 2 

check button Transcriptomic changes along malignancy continuum.
TissueExpression DynamicsAbbreviation
EsophagusThe image shows the transcriptomic changes along malignancy continuum.log2FC in expression of this searched gene in stem-like cells from each diseased tissue sample relative to stem-like cells in normal samples in each tissue plotted against the malignancy continuum. Samples are colored based on if they are from different disease stage.
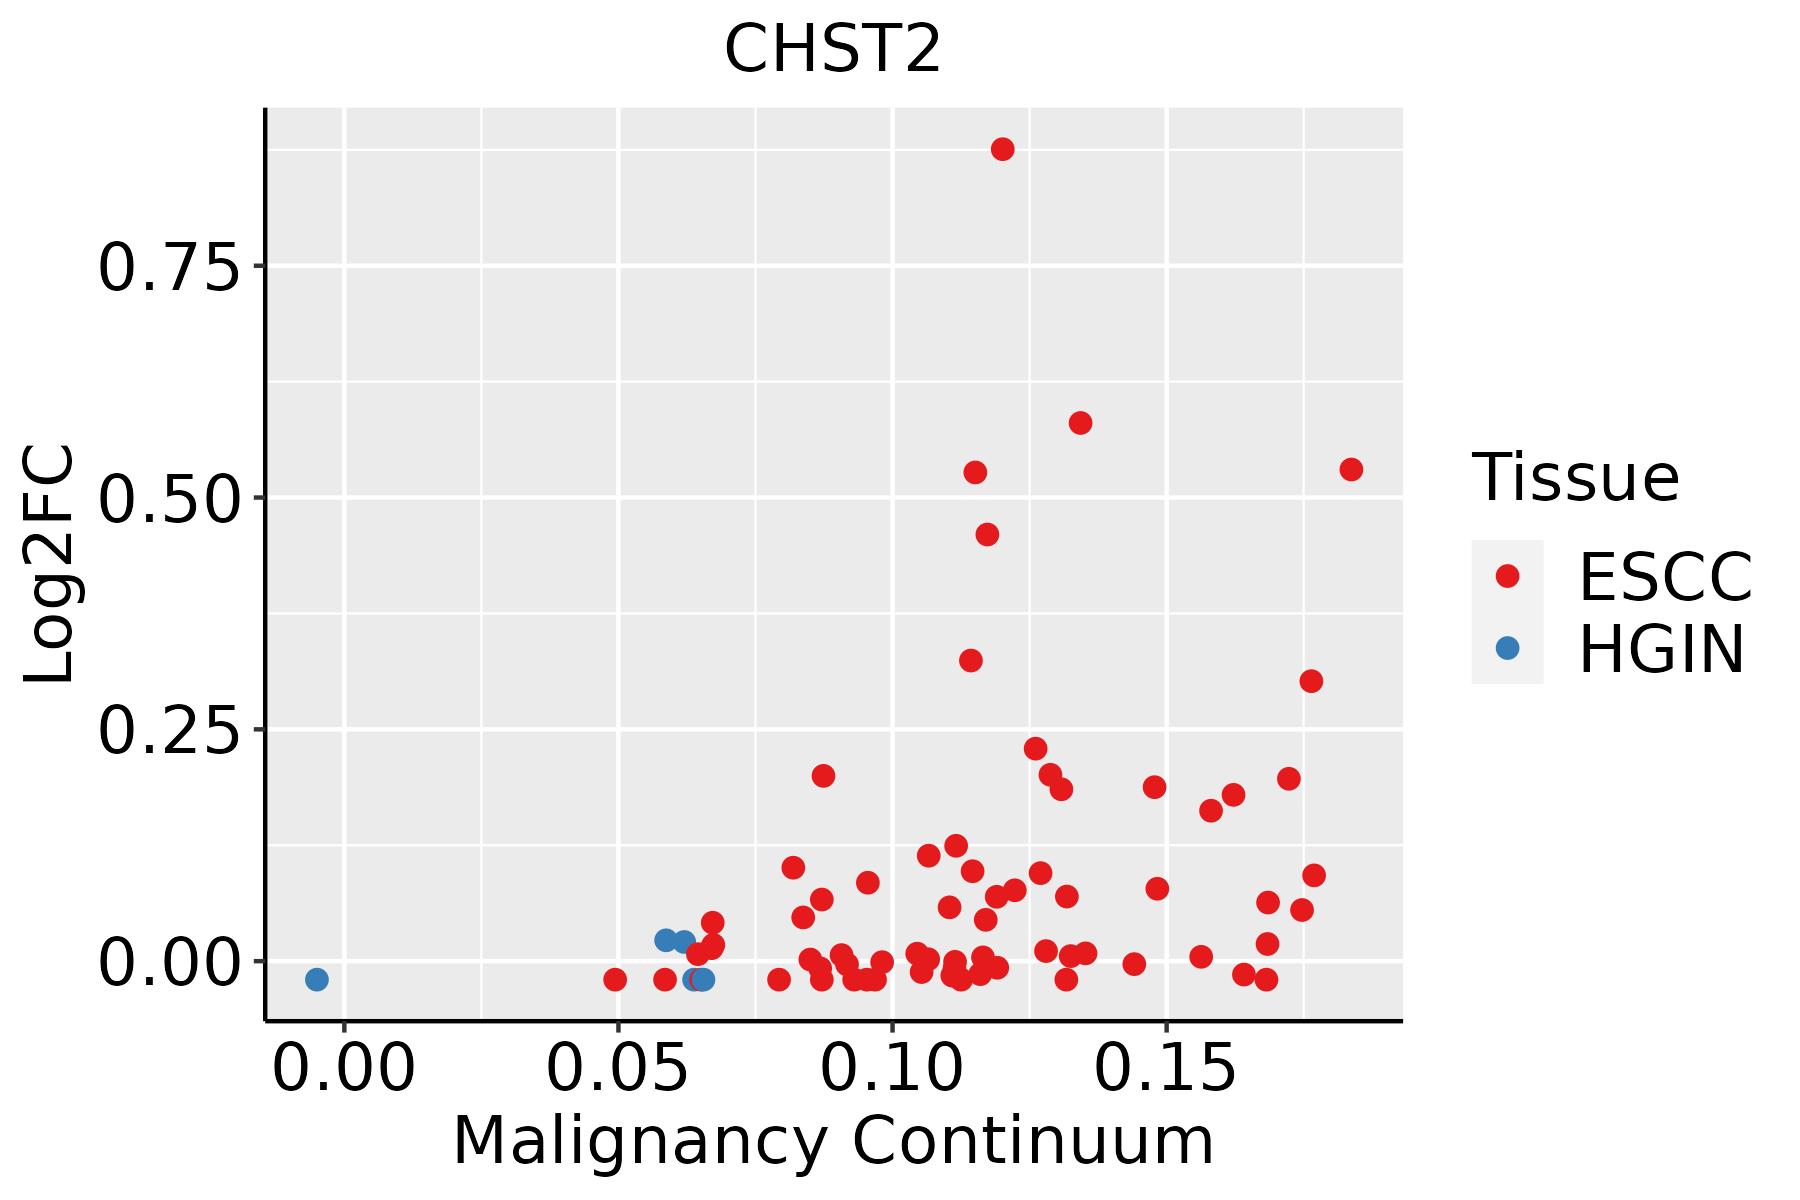
ESCC: Esophageal squamous cell carcinoma
HGIN: High-grade intraepithelial neoplasias
LGIN: Low-grade intraepithelial neoplasias
Oral CavityThe image shows the transcriptomic changes along malignancy continuum.log2FC in expression of this searched gene in stem-like cells from each diseased tissue sample relative to stem-like cells in normal samples in each tissue plotted against the malignancy continuum. Samples are colored based on if they are from different disease stage.
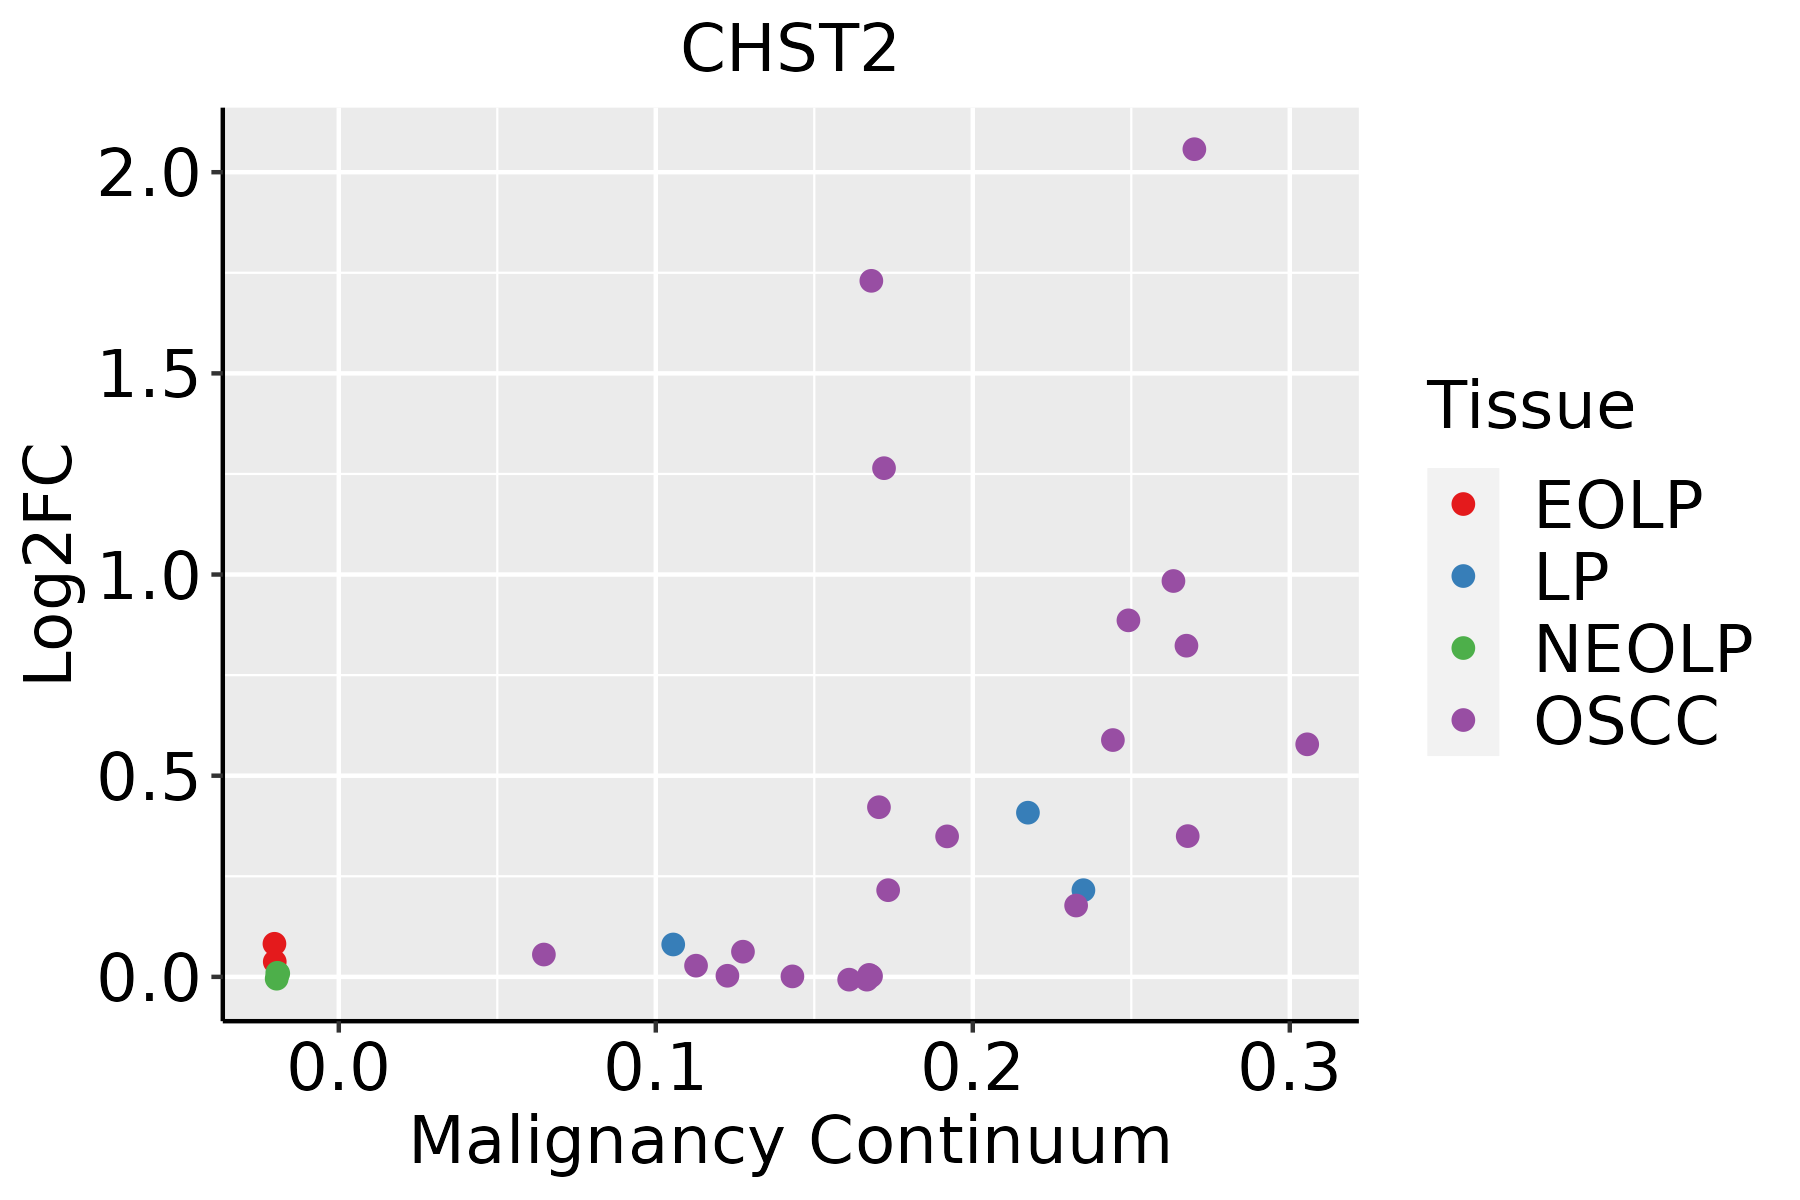
EOLP: Erosive Oral lichen planus
LP: leukoplakia
NEOLP: Non-erosive oral lichen planus
OSCC: Oral squamous cell carcinoma
ProstateThe image shows the transcriptomic changes along malignancy continuum.log2FC in expression of this searched gene in stem-like cells from each diseased tissue sample relative to stem-like cells in normal samples in each tissue plotted against the malignancy continuum. Samples are colored based on if they are from different disease stage.BPH: Benign Prostatic Hyperplasia
ThyroidThe image shows the transcriptomic changes along malignancy continuum.log2FC in expression of this searched gene in stem-like cells from each diseased tissue sample relative to stem-like cells in normal samples in each tissue plotted against the malignancy continuum. Samples are colored based on if they are from different disease stage.
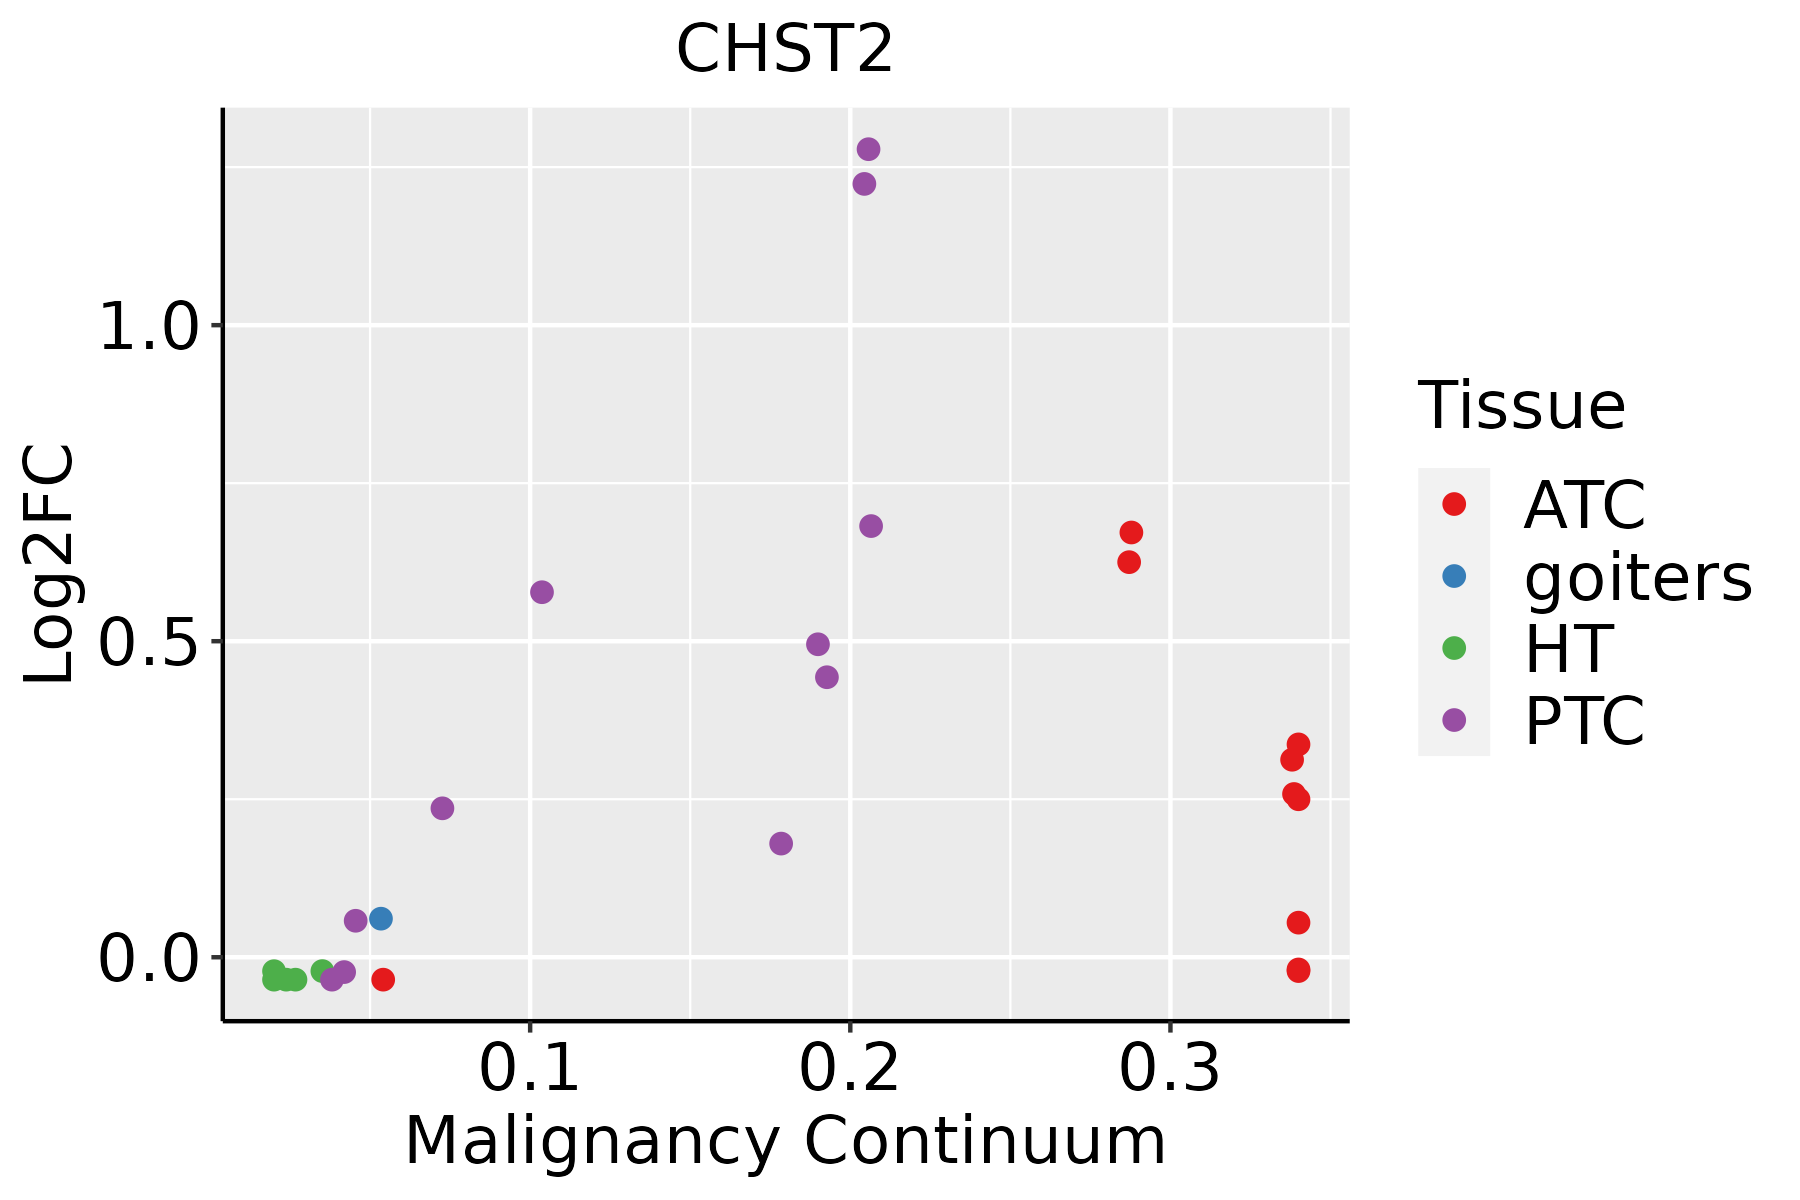
ATC: Anaplastic thyroid cancer
HT: Hashimoto's thyroiditis
PTC: Papillary thyroid cancer
∗log2FC in expression of this searched gene in stem-like cells from each diseased tissue sample relative to stem-like cells in normal samples in each tissue plotted against the malignancy continuum. Samples are colored based on if they are from different disease stage.

Top

Malignant transformation related pathway analysis

check buttonFind out the enriched GO biological processes and KEGG pathways involved in transition from healthy to precancer to cancer
check button Figure of enriched GO biological processes.
TissueDisease StageEnriched GO biological Processes
ColorectumADGO analysis - Figure of enriched GO biological processes: Top 15 enriched GO BP terms are showed in the bar plot of each disease state in each tissue. Each row represents a significant GO biological process which is colored according to the -log10(p.adjust).
ColorectumSERGO analysis - Figure of enriched GO biological processes: Top 15 enriched GO BP terms are showed in the bar plot of each disease state in each tissue. Each row represents a significant GO biological process which is colored according to the -log10(p.adjust).
ColorectumMSSGO analysis - Figure of enriched GO biological processes: Top 15 enriched GO BP terms are showed in the bar plot of each disease state in each tissue. Each row represents a significant GO biological process which is colored according to the -log10(p.adjust).
ColorectumMSI-HGO analysis - Figure of enriched GO biological processes: Top 15 enriched GO BP terms are showed in the bar plot of each disease state in each tissue. Each row represents a significant GO biological process which is colored according to the -log10(p.adjust).
ColorectumFAPGO analysis - Figure of enriched GO biological processes: Top 15 enriched GO BP terms are showed in the bar plot of each disease state in each tissue. Each row represents a significant GO biological process which is colored according to the -log10(p.adjust).
∗Top 15 enriched GO BP terms are showed in the bar plot of each disease state in each tissue. Each row represents a significant GO biological process which is colored according to the -log10(p.adjust).
Page: 1 2 3 4 5 6 7 8 9 

check button Enriched GO biological processes.
GO IDTissueDisease StageDescriptionGene RatioBg Ratiopvaluep.adjustCount
GO:004578527EsophagusESCCpositive regulation of cell adhesion255/8552437/187235.07e-089.11e-07255
GO:00067906EsophagusESCCsulfur compound metabolic process201/8552339/187232.64e-073.94e-06201
GO:00442725EsophagusESCCsulfur compound biosynthetic process96/8552148/187231.86e-062.16e-0596
GO:002240720EsophagusESCCregulation of cell-cell adhesion239/8552448/187235.88e-043.19e-03239
GO:002240919EsophagusESCCpositive regulation of cell-cell adhesion155/8552284/187231.50e-037.06e-03155
GO:000268515EsophagusESCCregulation of leukocyte migration114/8552210/187237.26e-032.63e-02114
GO:190303916EsophagusESCCpositive regulation of leukocyte cell-cell adhesion128/8552239/187238.40e-032.96e-02128
GO:0006024EsophagusESCCglycosaminoglycan biosynthetic process45/855275/187238.75e-033.08e-0245
GO:0006023EsophagusESCCaminoglycan biosynthetic process47/855279/187239.29e-033.23e-0247
GO:000715918EsophagusESCCleukocyte cell-cell adhesion192/8552371/187231.03e-023.51e-02192
GO:190303717EsophagusESCCregulation of leukocyte cell-cell adhesion174/8552336/187231.36e-024.43e-02174
GO:004578520Oral cavityOSCCpositive regulation of cell adhesion225/7305437/187236.06e-081.09e-06225
GO:002240718Oral cavityOSCCregulation of cell-cell adhesion218/7305448/187231.71e-051.68e-04218
GO:00442724Oral cavityOSCCsulfur compound biosynthetic process82/7305148/187233.71e-053.31e-0482
GO:00067905Oral cavityOSCCsulfur compound metabolic process168/7305339/187234.50e-053.84e-04168
GO:000268510Oral cavityOSCCregulation of leukocyte migration108/7305210/187231.63e-041.13e-03108
GO:000715916Oral cavityOSCCleukocyte cell-cell adhesion178/7305371/187232.44e-041.57e-03178
GO:190303715Oral cavityOSCCregulation of leukocyte cell-cell adhesion162/7305336/187233.39e-042.08e-03162
GO:005090010Oral cavityOSCCleukocyte migration176/7305369/187233.80e-042.31e-03176
GO:002240917Oral cavityOSCCpositive regulation of cell-cell adhesion136/7305284/187231.35e-036.62e-03136
Page: 1 2 

check button Enriched KEGG pathways.
Pathway IDTissueDisease StageDescriptionGene RatioBg Ratiopvaluep.adjustqvalueCount
Page: 1 

Top

Cell-cell communication analysis

check buttonIdentification of potential cell-cell interactions between two cell types and their ligand-receptor pairs for different disease states
LigandReceptorLRpairPathwayTissueDisease Stage
Page: 1 

Top

Single-cell gene regulatory network inference analysis

check buttonFind out the significant the regulons (TFs) and the target genes of each regulon across cell types for different disease states
TFCell TypeTissueDisease StageTarget GeneRSSRegulon Activity
∗The dot plots of a searched regulon are shown for all cell subpopulations in each disease state of each tissue based on the regulon specific score inferred using pySCENIC and by calculating the average expression.
Page: 1 

Top

Somatic mutation of malignant transformation related genes

check buttonAnnotation of somatic variants for genes involved in malignant transformation
Hugo SymbolVariant ClassVariant ClassificationdbSNP RSHGVScHGVSpHGVSp ShortSWISSPROTBIOTYPESIFTPolyPhenTumor Sample BarcodeTissueHistologySexAgeStageTherapy TypesDrugsOutcome
CHST2SNVMissense_Mutationrs868587203c.1094N>Ap.Arg365Hisp.R365HQ9Y4C5protein_codingtolerated(0.05)probably_damaging(0.973)TCGA-A2-A0SY-01Breastbreast invasive carcinomaFemale<65III/IVHormone TherapyarimidexSD
CHST2SNVMissense_Mutationnovelc.485A>Tp.Asp162Valp.D162VQ9Y4C5protein_codingtolerated(0.23)benign(0)TCGA-A2-A3Y0-01Breastbreast invasive carcinomaFemale<65I/IIChemotherapyadriamycinCR
CHST2SNVMissense_Mutationnovelc.486C>Ap.Asp162Glup.D162EQ9Y4C5protein_codingtolerated(1)benign(0)TCGA-A2-A3Y0-01Breastbreast invasive carcinomaFemale<65I/IIChemotherapyadriamycinCR
CHST2SNVMissense_Mutationnovelc.578N>Cp.Leu193Prop.L193PQ9Y4C5protein_codingdeleterious(0)probably_damaging(0.999)TCGA-A7-A4SF-01Breastbreast invasive carcinomaFemale<65I/IIChemotherapycarboplatinCR
CHST2SNVMissense_Mutationc.767A>Gp.Lys256Argp.K256RQ9Y4C5protein_codingtolerated(0.69)probably_damaging(0.949)TCGA-AR-A24S-01Breastbreast invasive carcinomaFemale<65I/IIHormone TherapyanastrozoleSD
CHST2SNVMissense_Mutationnovelc.1292N>Cp.Asp431Alap.D431AQ9Y4C5protein_codingtolerated(0.2)benign(0.138)TCGA-BH-A0BS-01Breastbreast invasive carcinomaFemale<65III/IVChemotherapyadriamycinCR
CHST2SNVMissense_Mutationrs373790739c.1240N>Ap.Asp414Asnp.D414NQ9Y4C5protein_codingtolerated(0.29)possibly_damaging(0.562)TCGA-E2-A10C-01Breastbreast invasive carcinomaFemale<65I/IIChemotherapycytoxanSD
CHST2SNVMissense_Mutationnovelc.817G>Ap.Gly273Argp.G273RQ9Y4C5protein_codingdeleterious(0.02)probably_damaging(0.99)TCGA-2W-A8YY-01Cervixcervical & endocervical cancerFemale<65I/IIChemotherapycisplatinCR
CHST2SNVMissense_Mutationc.1456N>Ap.Ala486Thrp.A486TQ9Y4C5protein_codingtolerated(0.51)possibly_damaging(0.574)TCGA-C5-A2LV-01Cervixcervical & endocervical cancerFemale<65I/IIUnknownUnknownSD
CHST2SNVMissense_Mutationc.1364N>Tp.Ala455Valp.A455VQ9Y4C5protein_codingtolerated(0.94)benign(0.125)TCGA-A6-2686-01Colorectumcolon adenocarcinomaFemale>=65I/IIUnknownUnknownSD
Page: 1 2 3 4 5 6 7 8 9 10 

Top

Related drugs of malignant transformation related genes

check buttonIdentification of chemicals and drugs interact with genes involved in malignant transfromation
(DGIdb 4.0)
Entrez IDSymbolCategoryInteraction TypesDrug Claim NameDrug NamePMIDs
Page: 1