
|
|||||
|
 | |
| |
| |
| |
| |
| |
|
Gene: CHST15 |
Gene summary for CHST15 |
| Gene information | Species | Human | Gene symbol | CHST15 | Gene ID | 51363 |
| Gene name | carbohydrate sulfotransferase 15 | |
| Gene Alias | BRAG | |
| Cytomap | 10q26.13 | |
| Gene Type | protein-coding | GO ID | GO:0005975 | UniProtAcc | Q7LFX5 |
Top |
Malignant transformation analysis |
| Identification of the aberrant gene expression in precancerous and cancerous lesions by comparing the gene expression of stem-like cells in diseased tissues with normal stem cells |
| Entrez ID | Symbol | Replicates | Species | Organ | Tissue | Adj P-value | Log2FC | Malignancy |
| 51363 | CHST15 | LZE24T | Human | Esophagus | ESCC | 3.58e-06 | 2.87e-01 | 0.0596 |
| 51363 | CHST15 | P1T-E | Human | Esophagus | ESCC | 2.42e-03 | 2.44e-01 | 0.0875 |
| 51363 | CHST15 | P2T-E | Human | Esophagus | ESCC | 6.45e-10 | 2.53e-01 | 0.1177 |
| 51363 | CHST15 | P4T-E | Human | Esophagus | ESCC | 7.06e-05 | 8.37e-02 | 0.1323 |
| 51363 | CHST15 | P5T-E | Human | Esophagus | ESCC | 3.44e-08 | 1.45e-01 | 0.1327 |
| 51363 | CHST15 | P8T-E | Human | Esophagus | ESCC | 6.05e-12 | 2.66e-01 | 0.0889 |
| 51363 | CHST15 | P10T-E | Human | Esophagus | ESCC | 1.02e-04 | 3.86e-02 | 0.116 |
| 51363 | CHST15 | P11T-E | Human | Esophagus | ESCC | 2.72e-05 | 4.04e-01 | 0.1426 |
| 51363 | CHST15 | P12T-E | Human | Esophagus | ESCC | 1.04e-11 | 1.87e-01 | 0.1122 |
| 51363 | CHST15 | P15T-E | Human | Esophagus | ESCC | 4.46e-18 | 1.61e-01 | 0.1149 |
| 51363 | CHST15 | P16T-E | Human | Esophagus | ESCC | 2.40e-12 | 1.49e-01 | 0.1153 |
| 51363 | CHST15 | P17T-E | Human | Esophagus | ESCC | 3.97e-02 | 1.36e-01 | 0.1278 |
| 51363 | CHST15 | P20T-E | Human | Esophagus | ESCC | 3.85e-04 | -1.78e-02 | 0.1124 |
| 51363 | CHST15 | P21T-E | Human | Esophagus | ESCC | 3.12e-10 | 1.61e-01 | 0.1617 |
| 51363 | CHST15 | P22T-E | Human | Esophagus | ESCC | 1.66e-02 | -1.43e-02 | 0.1236 |
| 51363 | CHST15 | P23T-E | Human | Esophagus | ESCC | 1.15e-04 | 1.06e-01 | 0.108 |
| 51363 | CHST15 | P24T-E | Human | Esophagus | ESCC | 4.22e-07 | 9.59e-02 | 0.1287 |
| 51363 | CHST15 | P26T-E | Human | Esophagus | ESCC | 3.61e-07 | 7.65e-02 | 0.1276 |
| 51363 | CHST15 | P27T-E | Human | Esophagus | ESCC | 4.23e-10 | 2.07e-01 | 0.1055 |
| 51363 | CHST15 | P28T-E | Human | Esophagus | ESCC | 1.19e-05 | -6.40e-03 | 0.1149 |
| Page: 1 2 3 4 5 |
| Tissue | Expression Dynamics | Abbreviation |
| Esophagus |  | ESCC: Esophageal squamous cell carcinoma |
| HGIN: High-grade intraepithelial neoplasias | ||
| LGIN: Low-grade intraepithelial neoplasias | ||
| Liver | 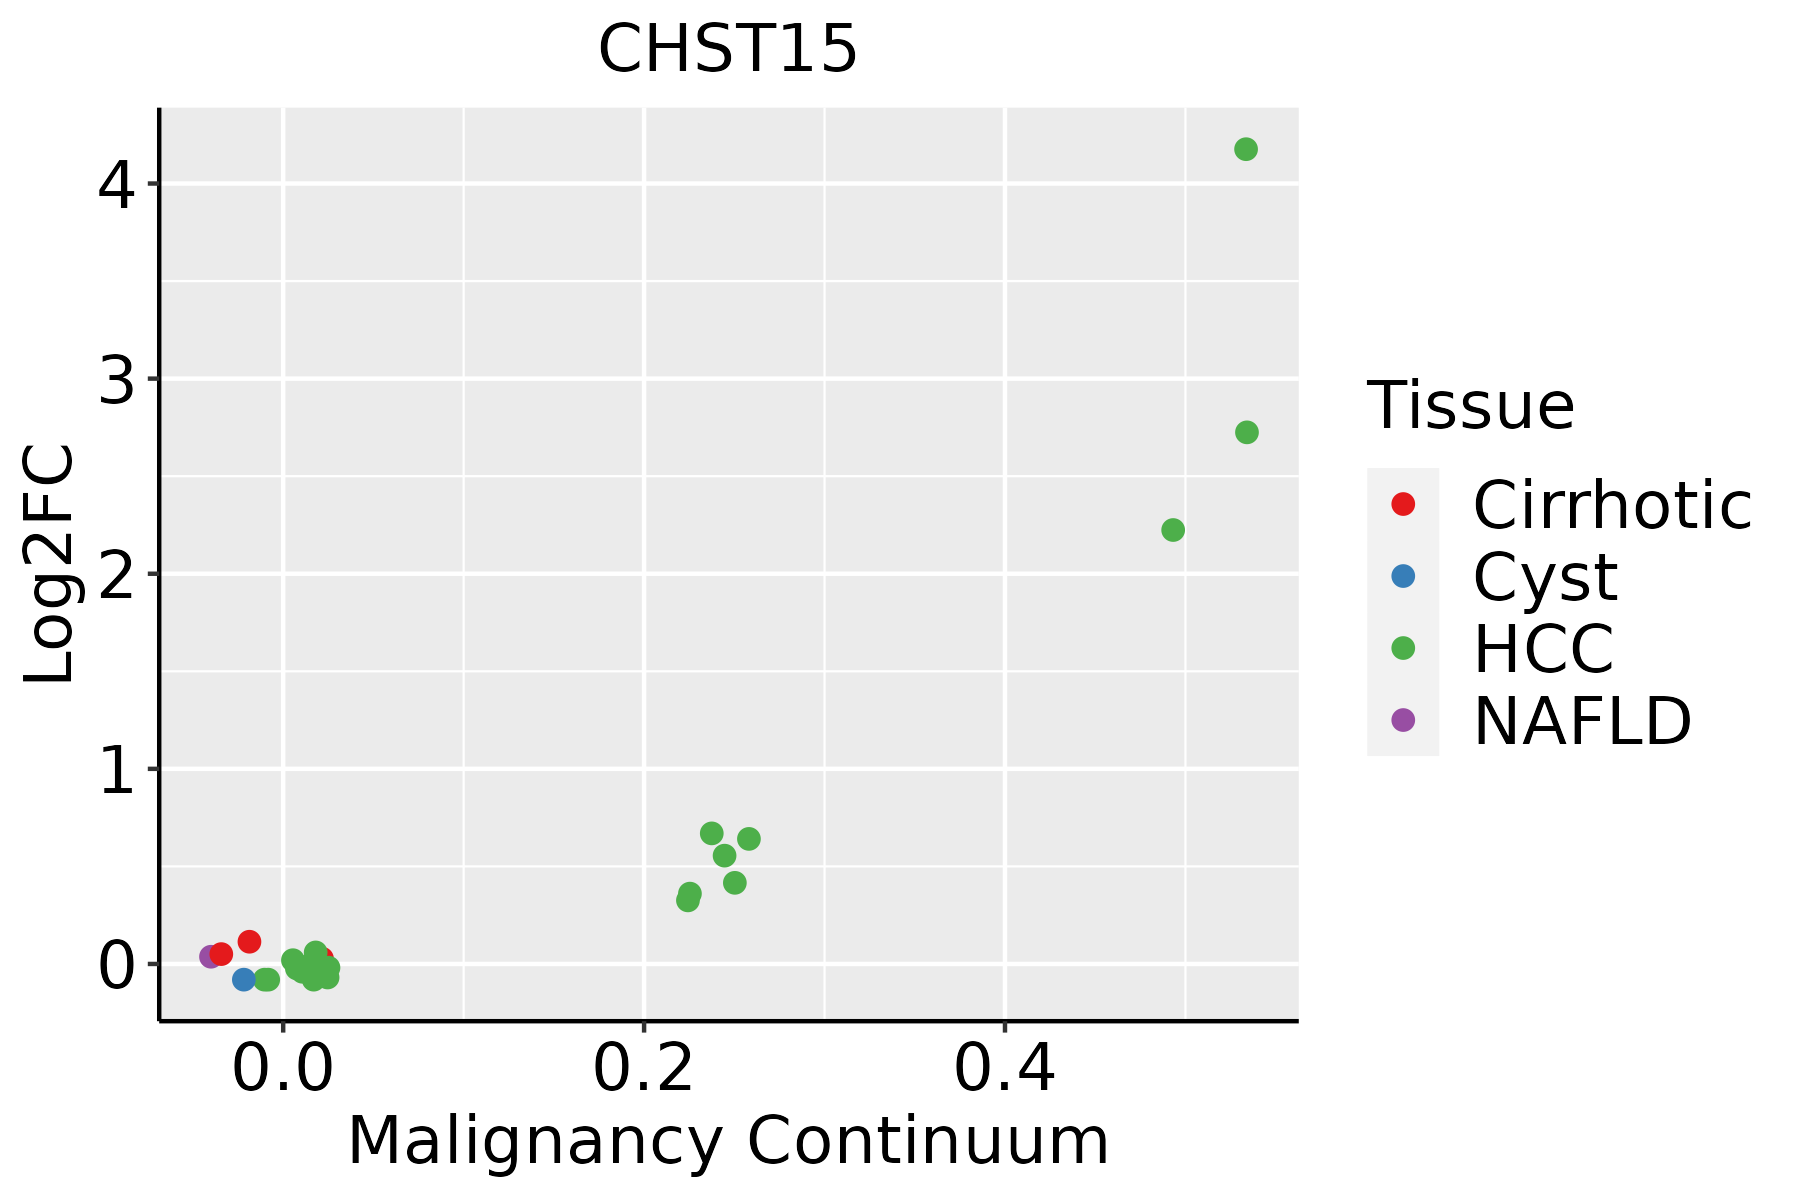 | HCC: Hepatocellular carcinoma |
| NAFLD: Non-alcoholic fatty liver disease | ||
| Lung |  | AAH: Atypical adenomatous hyperplasia |
| AIS: Adenocarcinoma in situ | ||
| IAC: Invasive lung adenocarcinoma | ||
| MIA: Minimally invasive adenocarcinoma | ||
| Oral Cavity |  | EOLP: Erosive Oral lichen planus |
| LP: leukoplakia | ||
| NEOLP: Non-erosive oral lichen planus | ||
| OSCC: Oral squamous cell carcinoma | ||
| Thyroid |  | ATC: Anaplastic thyroid cancer |
| HT: Hashimoto's thyroiditis | ||
| PTC: Papillary thyroid cancer |
| ∗log2FC in expression of this searched gene in stem-like cells from each diseased tissue sample relative to stem-like cells in normal samples in each tissue plotted against the malignancy continuum. Samples are colored based on if they are from different disease stage. |
Top |
Malignant transformation related pathway analysis |
| Find out the enriched GO biological processes and KEGG pathways involved in transition from healthy to precancer to cancer |
| Tissue | Disease Stage | Enriched GO biological Processes |
| Colorectum | AD |  |
| Colorectum | SER |  |
| Colorectum | MSS |  |
| Colorectum | MSI-H |  |
| Colorectum | FAP |  |
| ∗Top 15 enriched GO BP terms are showed in the bar plot of each disease state in each tissue. Each row represents a significant GO biological process which is colored according to the -log10(p.adjust). |
| Page: 1 2 3 4 5 6 7 8 9 |
| GO ID | Tissue | Disease Stage | Description | Gene Ratio | Bg Ratio | pvalue | p.adjust | Count |
| GO:00059969 | Esophagus | ESCC | monosaccharide metabolic process | 159/8552 | 257/18723 | 1.11e-07 | 1.81e-06 | 159 |
| GO:00193189 | Esophagus | ESCC | hexose metabolic process | 147/8552 | 237/18723 | 2.63e-07 | 3.94e-06 | 147 |
| GO:00091002 | Esophagus | ESCC | glycoprotein metabolic process | 226/8552 | 387/18723 | 2.64e-07 | 3.94e-06 | 226 |
| GO:00067906 | Esophagus | ESCC | sulfur compound metabolic process | 201/8552 | 339/18723 | 2.64e-07 | 3.94e-06 | 201 |
| GO:00442725 | Esophagus | ESCC | sulfur compound biosynthetic process | 96/8552 | 148/18723 | 1.86e-06 | 2.16e-05 | 96 |
| GO:00091012 | Esophagus | ESCC | glycoprotein biosynthetic process | 181/8552 | 317/18723 | 2.54e-05 | 2.15e-04 | 181 |
| GO:00160514 | Esophagus | ESCC | carbohydrate biosynthetic process | 117/8552 | 202/18723 | 2.96e-04 | 1.79e-03 | 117 |
| GO:00463643 | Esophagus | ESCC | monosaccharide biosynthetic process | 52/8552 | 82/18723 | 9.03e-04 | 4.61e-03 | 52 |
| GO:00193193 | Esophagus | ESCC | hexose biosynthetic process | 49/8552 | 78/18723 | 1.69e-03 | 7.81e-03 | 49 |
| GO:0006029 | Esophagus | ESCC | proteoglycan metabolic process | 48/8552 | 79/18723 | 4.93e-03 | 1.89e-02 | 48 |
| GO:0030166 | Esophagus | ESCC | proteoglycan biosynthetic process | 35/8552 | 56/18723 | 8.30e-03 | 2.94e-02 | 35 |
| GO:0006024 | Esophagus | ESCC | glycosaminoglycan biosynthetic process | 45/8552 | 75/18723 | 8.75e-03 | 3.08e-02 | 45 |
| GO:0006023 | Esophagus | ESCC | aminoglycan biosynthetic process | 47/8552 | 79/18723 | 9.29e-03 | 3.23e-02 | 47 |
| GO:000679021 | Liver | HCC | sulfur compound metabolic process | 212/7958 | 339/18723 | 5.60e-14 | 3.39e-12 | 212 |
| GO:000599621 | Liver | HCC | monosaccharide metabolic process | 167/7958 | 257/18723 | 2.31e-13 | 1.25e-11 | 167 |
| GO:001931821 | Liver | HCC | hexose metabolic process | 155/7958 | 237/18723 | 7.63e-13 | 3.90e-11 | 155 |
| GO:00442722 | Liver | HCC | sulfur compound biosynthetic process | 95/7958 | 148/18723 | 7.89e-08 | 1.58e-06 | 95 |
| GO:00463642 | Liver | HCC | monosaccharide biosynthetic process | 58/7958 | 82/18723 | 2.08e-07 | 3.75e-06 | 58 |
| GO:00193192 | Liver | HCC | hexose biosynthetic process | 54/7958 | 78/18723 | 1.61e-06 | 2.27e-05 | 54 |
| GO:00160512 | Liver | HCC | carbohydrate biosynthetic process | 113/7958 | 202/18723 | 7.64e-05 | 6.83e-04 | 113 |
| Page: 1 2 3 |
| Pathway ID | Tissue | Disease Stage | Description | Gene Ratio | Bg Ratio | pvalue | p.adjust | qvalue | Count |
| hsa00532 | Oral cavity | OSCC | Glycosaminoglycan biosynthesis - chondroitin sulfate / dermatan sulfate | 16/3704 | 21/8465 | 2.61e-03 | 6.77e-03 | 3.45e-03 | 16 |
| hsa005321 | Oral cavity | OSCC | Glycosaminoglycan biosynthesis - chondroitin sulfate / dermatan sulfate | 16/3704 | 21/8465 | 2.61e-03 | 6.77e-03 | 3.45e-03 | 16 |
| Page: 1 |
Top |
Cell-cell communication analysis |
| Identification of potential cell-cell interactions between two cell types and their ligand-receptor pairs for different disease states |
| Ligand | Receptor | LRpair | Pathway | Tissue | Disease Stage |
| Page: 1 |
Top |
Single-cell gene regulatory network inference analysis |
| Find out the significant the regulons (TFs) and the target genes of each regulon across cell types for different disease states |
| TF | Cell Type | Tissue | Disease Stage | Target Gene | RSS | Regulon Activity |
| ∗The dot plots of a searched regulon are shown for all cell subpopulations in each disease state of each tissue based on the regulon specific score inferred using pySCENIC and by calculating the average expression. |
| Page: 1 |
Top |
Somatic mutation of malignant transformation related genes |
| Annotation of somatic variants for genes involved in malignant transformation |
| Hugo Symbol | Variant Class | Variant Classification | dbSNP RS | HGVSc | HGVSp | HGVSp Short | SWISSPROT | BIOTYPE | SIFT | PolyPhen | Tumor Sample Barcode | Tissue | Histology | Sex | Age | Stage | Therapy Types | Drugs | Outcome |
| CHST15 | SNV | Missense_Mutation | c.920G>A | p.Arg307His | p.R307H | Q7LFX5 | protein_coding | deleterious(0.03) | probably_damaging(0.946) | TCGA-BH-A18G-01 | Breast | breast invasive carcinoma | Female | >=65 | I/II | Unknown | Unknown | SD | |
| CHST15 | SNV | Missense_Mutation | c.1390N>A | p.Trp464Arg | p.W464R | Q7LFX5 | protein_coding | deleterious(0) | probably_damaging(1) | TCGA-E9-A1ND-01 | Breast | breast invasive carcinoma | Female | >=65 | I/II | Hormone Therapy | aromasin | SD | |
| CHST15 | SNV | Missense_Mutation | novel | c.922T>C | p.Tyr308His | p.Y308H | Q7LFX5 | protein_coding | deleterious(0.03) | possibly_damaging(0.677) | TCGA-HN-A2NL-01 | Breast | breast invasive carcinoma | Female | <65 | I/II | Chemotherapy | cyclophosphamide | SD |
| CHST15 | insertion | In_Frame_Ins | novel | c.411_412insCACACT | p.Gln137_Ser138insHisThr | p.Q137_S138insHT | Q7LFX5 | protein_coding | TCGA-A2-A04Y-01 | Breast | breast invasive carcinoma | Female | <65 | I/II | Chemotherapy | cytoxan | SD | ||
| CHST15 | insertion | Frame_Shift_Ins | novel | c.409_410insTATGCATTTGCTGGACGTGTCTG | p.Gln137LeufsTer12 | p.Q137Lfs*12 | Q7LFX5 | protein_coding | TCGA-A2-A04Y-01 | Breast | breast invasive carcinoma | Female | <65 | I/II | Chemotherapy | cytoxan | SD | ||
| CHST15 | deletion | Frame_Shift_Del | novel | c.870delG | p.Trp290Ter | p.W290* | Q7LFX5 | protein_coding | TCGA-D8-A27V-01 | Breast | breast invasive carcinoma | Female | <65 | I/II | Hormone Therapy | tamoxiphen | SD | ||
| CHST15 | SNV | Missense_Mutation | c.691G>A | p.Ala231Thr | p.A231T | Q7LFX5 | protein_coding | tolerated(0.72) | benign(0) | TCGA-2W-A8YY-01 | Cervix | cervical & endocervical cancer | Female | <65 | I/II | Chemotherapy | cisplatin | CR | |
| CHST15 | SNV | Missense_Mutation | novel | c.1682C>A | p.Thr561Lys | p.T561K | Q7LFX5 | protein_coding | deleterious_low_confidence(0) | benign(0.041) | TCGA-C5-A8YR-01 | Cervix | cervical & endocervical cancer | Female | <65 | I/II | Unknown | Unknown | PD |
| CHST15 | SNV | Missense_Mutation | novel | c.293T>G | p.Leu98Arg | p.L98R | Q7LFX5 | protein_coding | deleterious(0) | probably_damaging(0.998) | TCGA-MA-AA3Z-01 | Cervix | cervical & endocervical cancer | Female | <65 | I/II | Unknown | Unknown | SD |
| CHST15 | SNV | Missense_Mutation | rs368746217 | c.961N>A | p.Ala321Thr | p.A321T | Q7LFX5 | protein_coding | tolerated(0.06) | probably_damaging(0.994) | TCGA-VS-A9U6-01 | Cervix | cervical & endocervical cancer | Female | <65 | I/II | Chemotherapy | cisplatin | PD |
| Page: 1 2 3 4 5 6 7 8 9 10 |
Top |
Related drugs of malignant transformation related genes |
| Identification of chemicals and drugs interact with genes involved in malignant transfromation |
| (DGIdb 4.0) |
| Entrez ID | Symbol | Category | Interaction Types | Drug Claim Name | Drug Name | PMIDs |
| Page: 1 |

Copyright 2023-Present -The University of Texas Health Science Center at Houston |