
|
|||||
|
 | |
| |
| |
| |
| |
| |
|
Gene: CHST12 |
Gene summary for CHST12 |
| Gene information | Species | Human | Gene symbol | CHST12 | Gene ID | 55501 |
| Gene name | carbohydrate sulfotransferase 12 | |
| Gene Alias | C4S-2 | |
| Cytomap | 7p22.3 | |
| Gene Type | protein-coding | GO ID | GO:0005975 | UniProtAcc | A0A024R860 |
Top |
Malignant transformation analysis |
| Identification of the aberrant gene expression in precancerous and cancerous lesions by comparing the gene expression of stem-like cells in diseased tissues with normal stem cells |
| Entrez ID | Symbol | Replicates | Species | Organ | Tissue | Adj P-value | Log2FC | Malignancy |
| 55501 | CHST12 | LZE2T | Human | Esophagus | ESCC | 2.21e-03 | 4.69e-01 | 0.082 |
| 55501 | CHST12 | LZE4T | Human | Esophagus | ESCC | 1.05e-04 | 1.16e-01 | 0.0811 |
| 55501 | CHST12 | LZE7T | Human | Esophagus | ESCC | 4.11e-12 | 3.69e-01 | 0.0667 |
| 55501 | CHST12 | LZE8T | Human | Esophagus | ESCC | 1.03e-05 | 1.43e-01 | 0.067 |
| 55501 | CHST12 | LZE20T | Human | Esophagus | ESCC | 3.69e-10 | 2.46e-01 | 0.0662 |
| 55501 | CHST12 | LZE22T | Human | Esophagus | ESCC | 5.08e-03 | 2.06e-01 | 0.068 |
| 55501 | CHST12 | LZE24T | Human | Esophagus | ESCC | 8.31e-22 | 6.33e-01 | 0.0596 |
| 55501 | CHST12 | LZE6T | Human | Esophagus | ESCC | 1.76e-07 | 2.65e-01 | 0.0845 |
| 55501 | CHST12 | P1T-E | Human | Esophagus | ESCC | 2.73e-07 | 5.39e-01 | 0.0875 |
| 55501 | CHST12 | P2T-E | Human | Esophagus | ESCC | 1.98e-26 | 4.29e-01 | 0.1177 |
| 55501 | CHST12 | P4T-E | Human | Esophagus | ESCC | 2.56e-24 | 5.19e-01 | 0.1323 |
| 55501 | CHST12 | P8T-E | Human | Esophagus | ESCC | 5.23e-29 | 5.58e-01 | 0.0889 |
| 55501 | CHST12 | P9T-E | Human | Esophagus | ESCC | 1.70e-19 | 3.95e-01 | 0.1131 |
| 55501 | CHST12 | P10T-E | Human | Esophagus | ESCC | 2.13e-23 | 3.86e-01 | 0.116 |
| 55501 | CHST12 | P11T-E | Human | Esophagus | ESCC | 7.63e-23 | 7.71e-01 | 0.1426 |
| 55501 | CHST12 | P12T-E | Human | Esophagus | ESCC | 2.01e-28 | 5.92e-01 | 0.1122 |
| 55501 | CHST12 | P15T-E | Human | Esophagus | ESCC | 4.60e-30 | 5.07e-01 | 0.1149 |
| 55501 | CHST12 | P16T-E | Human | Esophagus | ESCC | 1.77e-22 | 4.81e-01 | 0.1153 |
| 55501 | CHST12 | P17T-E | Human | Esophagus | ESCC | 1.29e-04 | 2.54e-01 | 0.1278 |
| 55501 | CHST12 | P19T-E | Human | Esophagus | ESCC | 5.53e-08 | 6.27e-01 | 0.1662 |
| Page: 1 2 3 4 5 6 |
| Tissue | Expression Dynamics | Abbreviation |
| Esophagus | 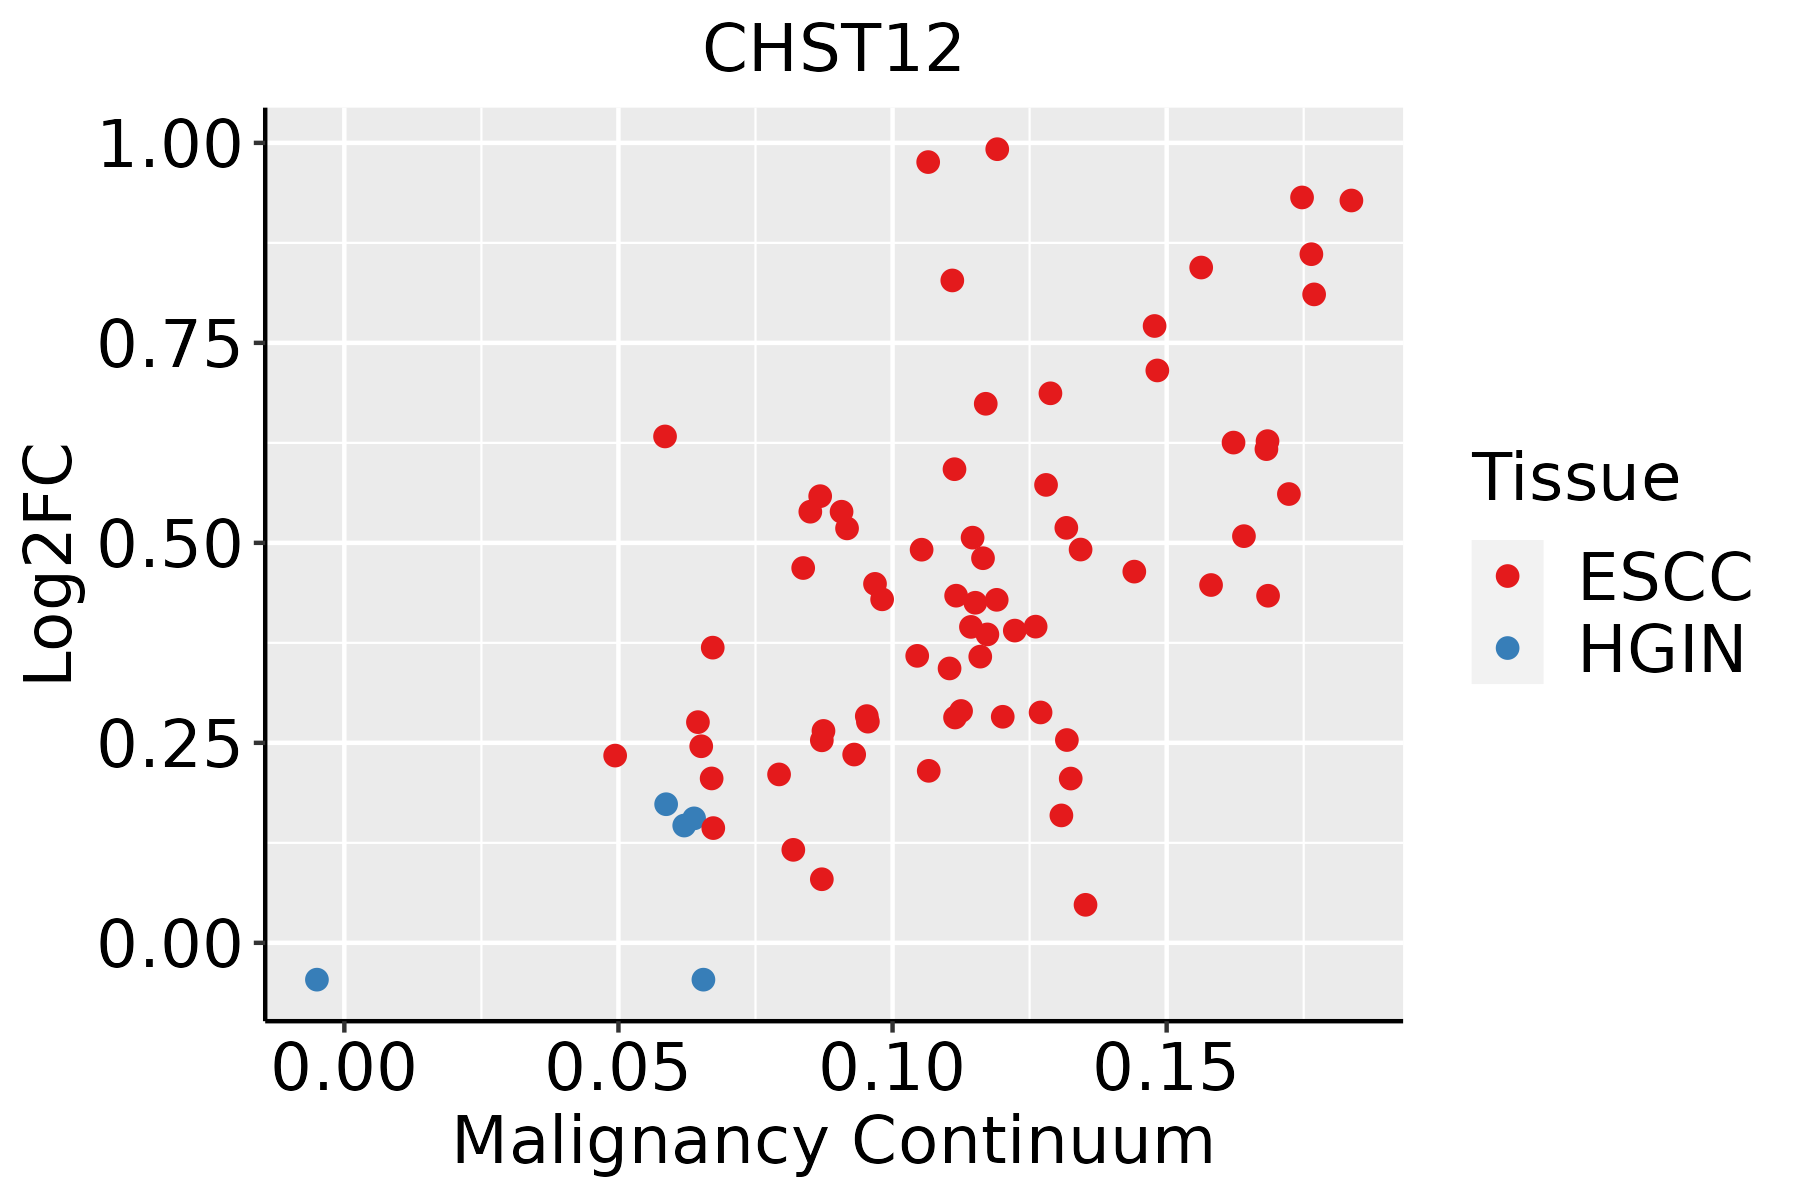 | ESCC: Esophageal squamous cell carcinoma |
| HGIN: High-grade intraepithelial neoplasias | ||
| LGIN: Low-grade intraepithelial neoplasias | ||
| Liver |  | HCC: Hepatocellular carcinoma |
| NAFLD: Non-alcoholic fatty liver disease | ||
| Oral Cavity | 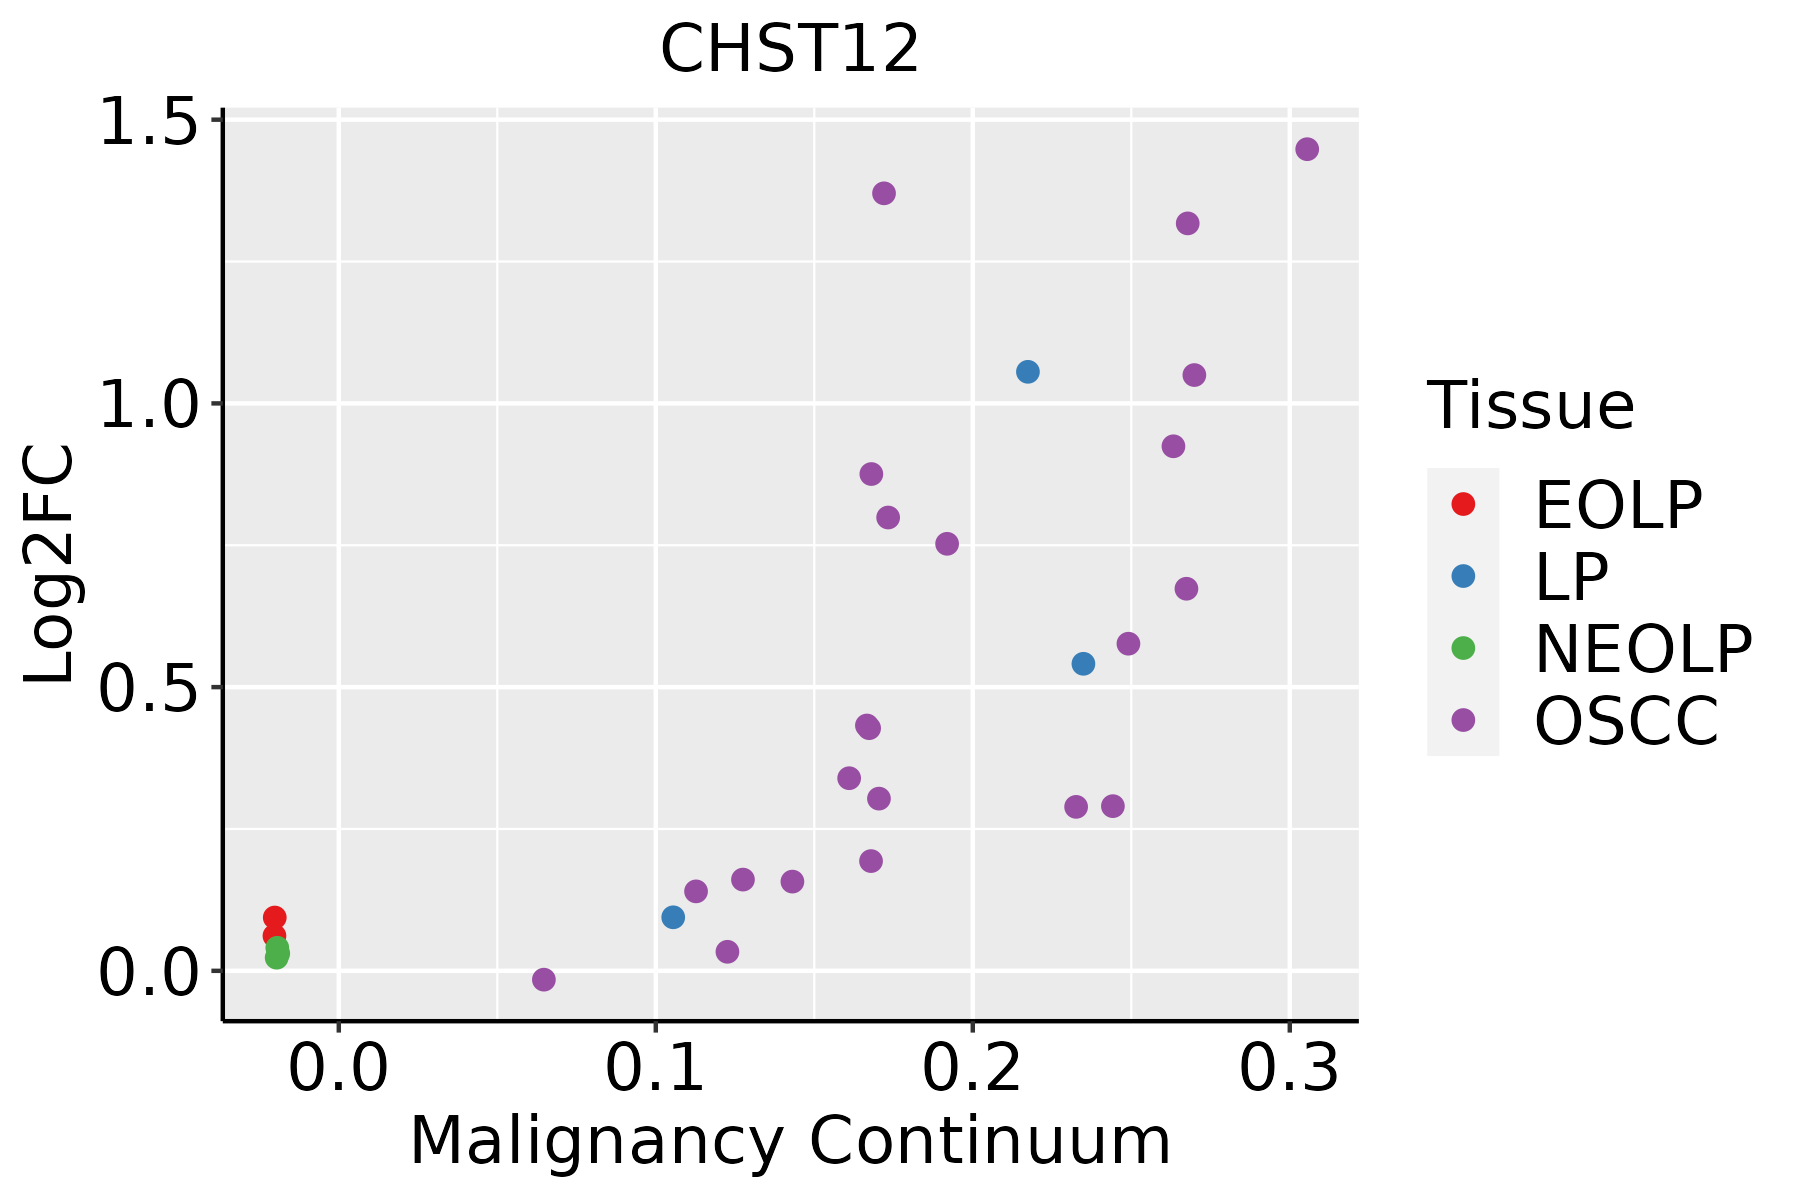 | EOLP: Erosive Oral lichen planus |
| LP: leukoplakia | ||
| NEOLP: Non-erosive oral lichen planus | ||
| OSCC: Oral squamous cell carcinoma | ||
| Thyroid | 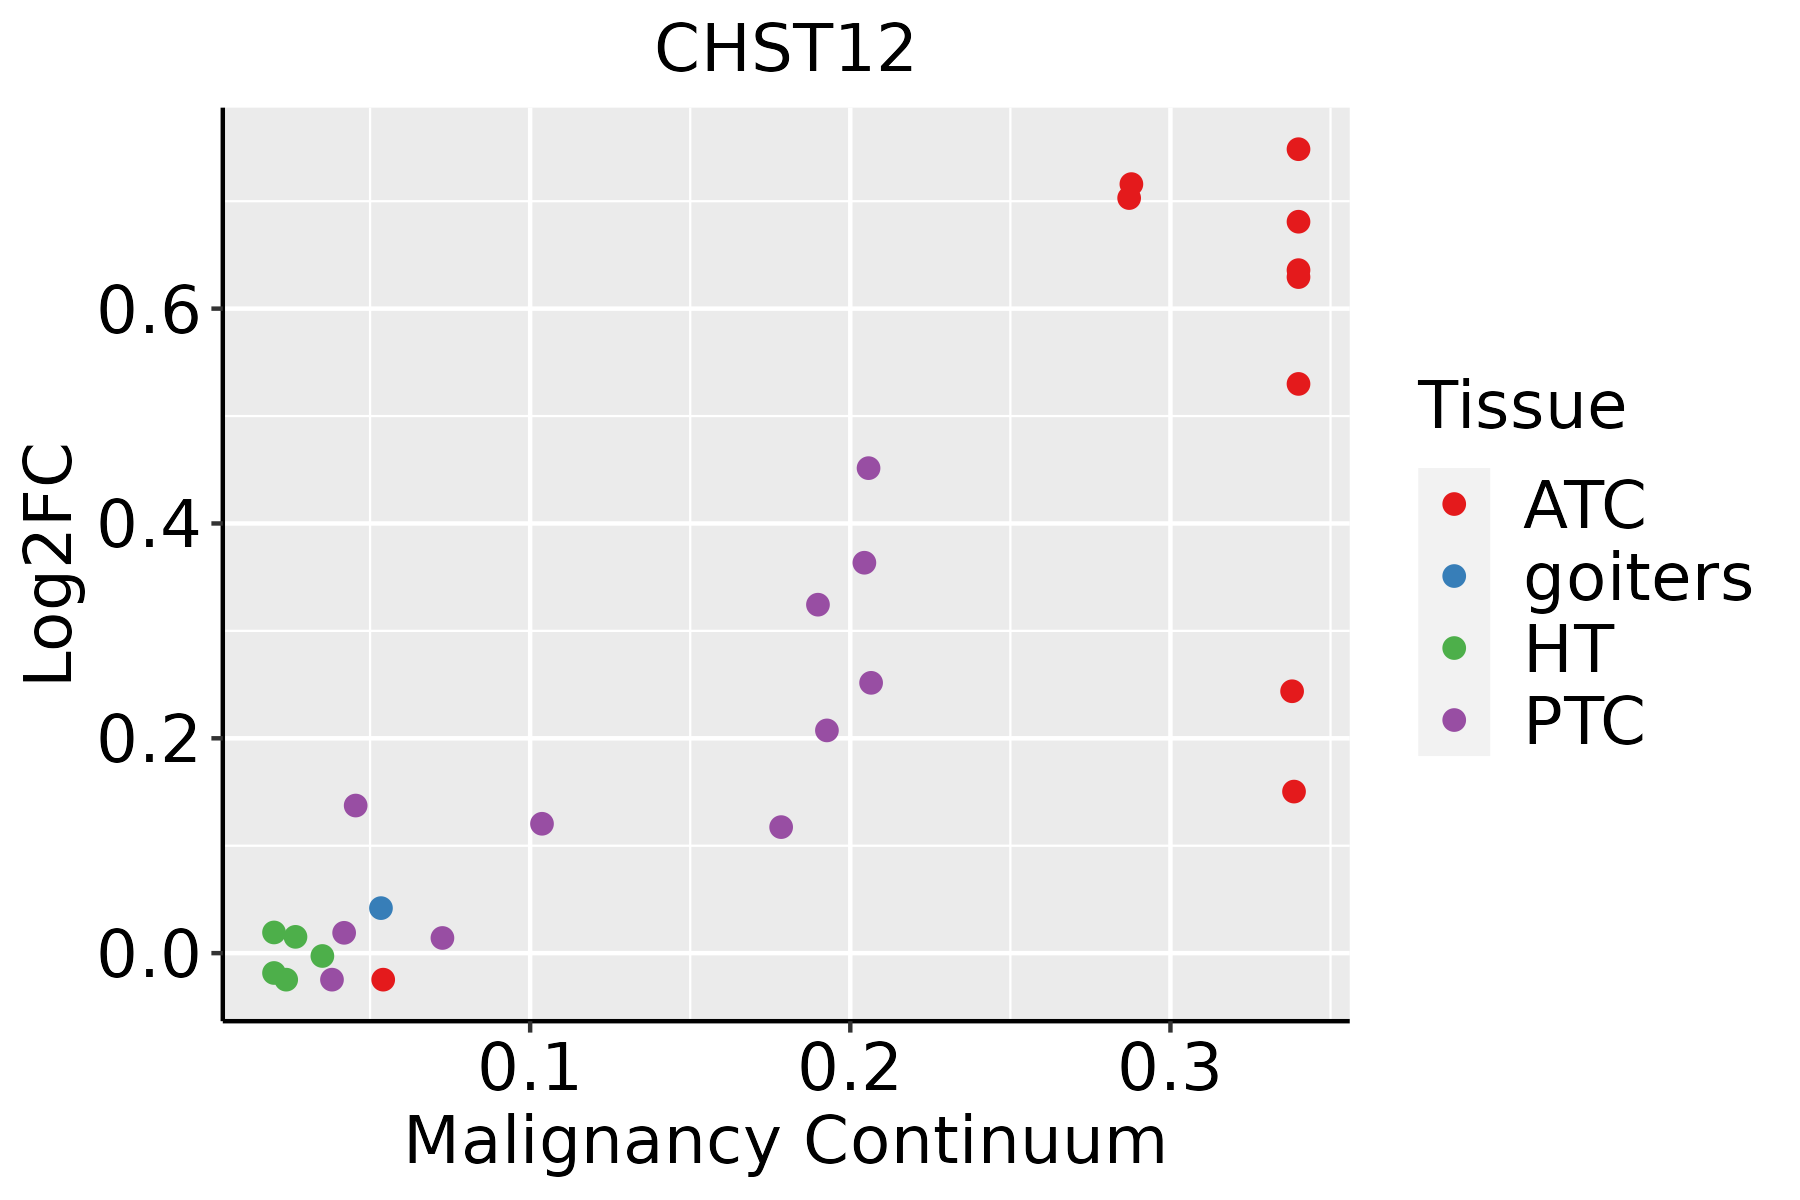 | ATC: Anaplastic thyroid cancer |
| HT: Hashimoto's thyroiditis | ||
| PTC: Papillary thyroid cancer |
| ∗log2FC in expression of this searched gene in stem-like cells from each diseased tissue sample relative to stem-like cells in normal samples in each tissue plotted against the malignancy continuum. Samples are colored based on if they are from different disease stage. |
Top |
Malignant transformation related pathway analysis |
| Find out the enriched GO biological processes and KEGG pathways involved in transition from healthy to precancer to cancer |
| Tissue | Disease Stage | Enriched GO biological Processes |
| Colorectum | AD |  |
| Colorectum | SER |  |
| Colorectum | MSS |  |
| Colorectum | MSI-H |  |
| Colorectum | FAP |  |
| ∗Top 15 enriched GO BP terms are showed in the bar plot of each disease state in each tissue. Each row represents a significant GO biological process which is colored according to the -log10(p.adjust). |
| Page: 1 2 3 4 5 6 7 8 9 |
| GO ID | Tissue | Disease Stage | Description | Gene Ratio | Bg Ratio | pvalue | p.adjust | Count |
| GO:00091002 | Esophagus | ESCC | glycoprotein metabolic process | 226/8552 | 387/18723 | 2.64e-07 | 3.94e-06 | 226 |
| GO:00067906 | Esophagus | ESCC | sulfur compound metabolic process | 201/8552 | 339/18723 | 2.64e-07 | 3.94e-06 | 201 |
| GO:00442725 | Esophagus | ESCC | sulfur compound biosynthetic process | 96/8552 | 148/18723 | 1.86e-06 | 2.16e-05 | 96 |
| GO:00091012 | Esophagus | ESCC | glycoprotein biosynthetic process | 181/8552 | 317/18723 | 2.54e-05 | 2.15e-04 | 181 |
| GO:00160514 | Esophagus | ESCC | carbohydrate biosynthetic process | 117/8552 | 202/18723 | 2.96e-04 | 1.79e-03 | 117 |
| GO:0006029 | Esophagus | ESCC | proteoglycan metabolic process | 48/8552 | 79/18723 | 4.93e-03 | 1.89e-02 | 48 |
| GO:0030166 | Esophagus | ESCC | proteoglycan biosynthetic process | 35/8552 | 56/18723 | 8.30e-03 | 2.94e-02 | 35 |
| GO:0006024 | Esophagus | ESCC | glycosaminoglycan biosynthetic process | 45/8552 | 75/18723 | 8.75e-03 | 3.08e-02 | 45 |
| GO:0006023 | Esophagus | ESCC | aminoglycan biosynthetic process | 47/8552 | 79/18723 | 9.29e-03 | 3.23e-02 | 47 |
| GO:000679011 | Liver | Cirrhotic | sulfur compound metabolic process | 129/4634 | 339/18723 | 3.06e-08 | 1.04e-06 | 129 |
| GO:00442721 | Liver | Cirrhotic | sulfur compound biosynthetic process | 58/4634 | 148/18723 | 6.93e-05 | 7.83e-04 | 58 |
| GO:00160511 | Liver | Cirrhotic | carbohydrate biosynthetic process | 73/4634 | 202/18723 | 1.91e-04 | 1.77e-03 | 73 |
| GO:000679021 | Liver | HCC | sulfur compound metabolic process | 212/7958 | 339/18723 | 5.60e-14 | 3.39e-12 | 212 |
| GO:00442722 | Liver | HCC | sulfur compound biosynthetic process | 95/7958 | 148/18723 | 7.89e-08 | 1.58e-06 | 95 |
| GO:00160512 | Liver | HCC | carbohydrate biosynthetic process | 113/7958 | 202/18723 | 7.64e-05 | 6.83e-04 | 113 |
| GO:0009100 | Liver | HCC | glycoprotein metabolic process | 193/7958 | 387/18723 | 1.89e-03 | 9.62e-03 | 193 |
| GO:00442724 | Oral cavity | OSCC | sulfur compound biosynthetic process | 82/7305 | 148/18723 | 3.71e-05 | 3.31e-04 | 82 |
| GO:00067905 | Oral cavity | OSCC | sulfur compound metabolic process | 168/7305 | 339/18723 | 4.50e-05 | 3.84e-04 | 168 |
| GO:0030206 | Oral cavity | OSCC | chondroitin sulfate biosynthetic process | 15/7305 | 18/18723 | 1.53e-04 | 1.07e-03 | 15 |
| GO:00091001 | Oral cavity | OSCC | glycoprotein metabolic process | 185/7305 | 387/18723 | 2.37e-04 | 1.54e-03 | 185 |
| Page: 1 2 |
| Pathway ID | Tissue | Disease Stage | Description | Gene Ratio | Bg Ratio | pvalue | p.adjust | qvalue | Count |
| hsa00532 | Oral cavity | OSCC | Glycosaminoglycan biosynthesis - chondroitin sulfate / dermatan sulfate | 16/3704 | 21/8465 | 2.61e-03 | 6.77e-03 | 3.45e-03 | 16 |
| hsa005321 | Oral cavity | OSCC | Glycosaminoglycan biosynthesis - chondroitin sulfate / dermatan sulfate | 16/3704 | 21/8465 | 2.61e-03 | 6.77e-03 | 3.45e-03 | 16 |
| Page: 1 |
Top |
Cell-cell communication analysis |
| Identification of potential cell-cell interactions between two cell types and their ligand-receptor pairs for different disease states |
| Ligand | Receptor | LRpair | Pathway | Tissue | Disease Stage |
| Page: 1 |
Top |
Single-cell gene regulatory network inference analysis |
| Find out the significant the regulons (TFs) and the target genes of each regulon across cell types for different disease states |
| TF | Cell Type | Tissue | Disease Stage | Target Gene | RSS | Regulon Activity |
| ∗The dot plots of a searched regulon are shown for all cell subpopulations in each disease state of each tissue based on the regulon specific score inferred using pySCENIC and by calculating the average expression. |
| Page: 1 |
Top |
Somatic mutation of malignant transformation related genes |
| Annotation of somatic variants for genes involved in malignant transformation |
| Hugo Symbol | Variant Class | Variant Classification | dbSNP RS | HGVSc | HGVSp | HGVSp Short | SWISSPROT | BIOTYPE | SIFT | PolyPhen | Tumor Sample Barcode | Tissue | Histology | Sex | Age | Stage | Therapy Types | Drugs | Outcome |
| CHST12 | SNV | Missense_Mutation | novel | c.1121G>A | p.Ser374Asn | p.S374N | Q9NRB3 | protein_coding | tolerated(0.25) | probably_damaging(0.94) | TCGA-A8-A08P-01 | Breast | breast invasive carcinoma | Female | >=65 | III/IV | Chemotherapy | 5-fluorouracil | CR |
| CHST12 | SNV | Missense_Mutation | c.240G>C | p.Gln80His | p.Q80H | Q9NRB3 | protein_coding | tolerated(0.17) | benign(0) | TCGA-LP-A4AV-01 | Cervix | cervical & endocervical cancer | Female | <65 | I/II | Unknown | Unknown | SD | |
| CHST12 | SNV | Missense_Mutation | c.1027G>A | p.Glu343Lys | p.E343K | Q9NRB3 | protein_coding | deleterious(0) | probably_damaging(1) | TCGA-LP-A4AV-01 | Cervix | cervical & endocervical cancer | Female | <65 | I/II | Unknown | Unknown | SD | |
| CHST12 | SNV | Missense_Mutation | c.661N>T | p.Arg221Cys | p.R221C | Q9NRB3 | protein_coding | deleterious(0) | probably_damaging(0.976) | TCGA-A6-3809-01 | Colorectum | colon adenocarcinoma | Female | >=65 | I/II | Unknown | Unknown | SD | |
| CHST12 | SNV | Missense_Mutation | c.937N>A | p.Glu313Lys | p.E313K | Q9NRB3 | protein_coding | deleterious(0.01) | probably_damaging(1) | TCGA-AA-3672-01 | Colorectum | colon adenocarcinoma | Female | >=65 | III/IV | Unknown | Unknown | SD | |
| CHST12 | SNV | Missense_Mutation | c.430C>T | p.Arg144Cys | p.R144C | Q9NRB3 | protein_coding | deleterious(0) | probably_damaging(0.97) | TCGA-D5-6928-01 | Colorectum | colon adenocarcinoma | Male | >=65 | I/II | Unknown | Unknown | SD | |
| CHST12 | SNV | Missense_Mutation | rs756193680 | c.143N>T | p.Pro48Leu | p.P48L | Q9NRB3 | protein_coding | tolerated(0.13) | benign(0) | TCGA-DY-A1DD-01 | Colorectum | rectum adenocarcinoma | Female | >=65 | III/IV | Unknown | Unknown | SD |
| CHST12 | SNV | Missense_Mutation | novel | c.884G>A | p.Gly295Asp | p.G295D | Q9NRB3 | protein_coding | deleterious(0) | probably_damaging(1) | TCGA-A5-A0G2-01 | Endometrium | uterine corpus endometrioid carcinoma | Female | <65 | III/IV | Unknown | Unknown | SD |
| CHST12 | SNV | Missense_Mutation | rs769324562 | c.263C>T | p.Thr88Met | p.T88M | Q9NRB3 | protein_coding | tolerated(0.1) | benign(0.186) | TCGA-A5-A1OF-01 | Endometrium | uterine corpus endometrioid carcinoma | Female | <65 | I/II | Unknown | Unknown | SD |
| CHST12 | SNV | Missense_Mutation | novel | c.464N>A | p.Ser155Asn | p.S155N | Q9NRB3 | protein_coding | tolerated(0.91) | benign(0) | TCGA-A5-A2K7-01 | Endometrium | uterine corpus endometrioid carcinoma | Female | <65 | I/II | Chemotherapy | taxol | SD |
| Page: 1 2 3 4 5 6 |
Top |
Related drugs of malignant transformation related genes |
| Identification of chemicals and drugs interact with genes involved in malignant transfromation |
| (DGIdb 4.0) |
| Entrez ID | Symbol | Category | Interaction Types | Drug Claim Name | Drug Name | PMIDs |
| Page: 1 |

Copyright 2023-Present -The University of Texas Health Science Center at Houston |