
|
|||||
|
 | |
| |
| |
| |
| |
| |
|
Gene: CHRNA1 |
Gene summary for CHRNA1 |
| Gene information | Species | Human | Gene symbol | CHRNA1 | Gene ID | 1134 |
| Gene name | cholinergic receptor nicotinic alpha 1 subunit | |
| Gene Alias | ACHRA | |
| Cytomap | 2q31.1 | |
| Gene Type | protein-coding | GO ID | GO:0001508 | UniProtAcc | P02708 |
Top |
Malignant transformation analysis |
| Identification of the aberrant gene expression in precancerous and cancerous lesions by comparing the gene expression of stem-like cells in diseased tissues with normal stem cells |
| Entrez ID | Symbol | Replicates | Species | Organ | Tissue | Adj P-value | Log2FC | Malignancy |
| 1134 | CHRNA1 | C07 | Human | Oral cavity | OSCC | 2.70e-05 | 1.13e+00 | 0.2491 |
| 1134 | CHRNA1 | LP16 | Human | Oral cavity | LP | 5.05e-08 | 1.33e+00 | 0.1055 |
| 1134 | CHRNA1 | SYSMH5 | Human | Oral cavity | OSCC | 1.90e-02 | 4.96e-01 | 0.0647 |
| Page: 1 |
| Tissue | Expression Dynamics | Abbreviation |
| Oral Cavity | 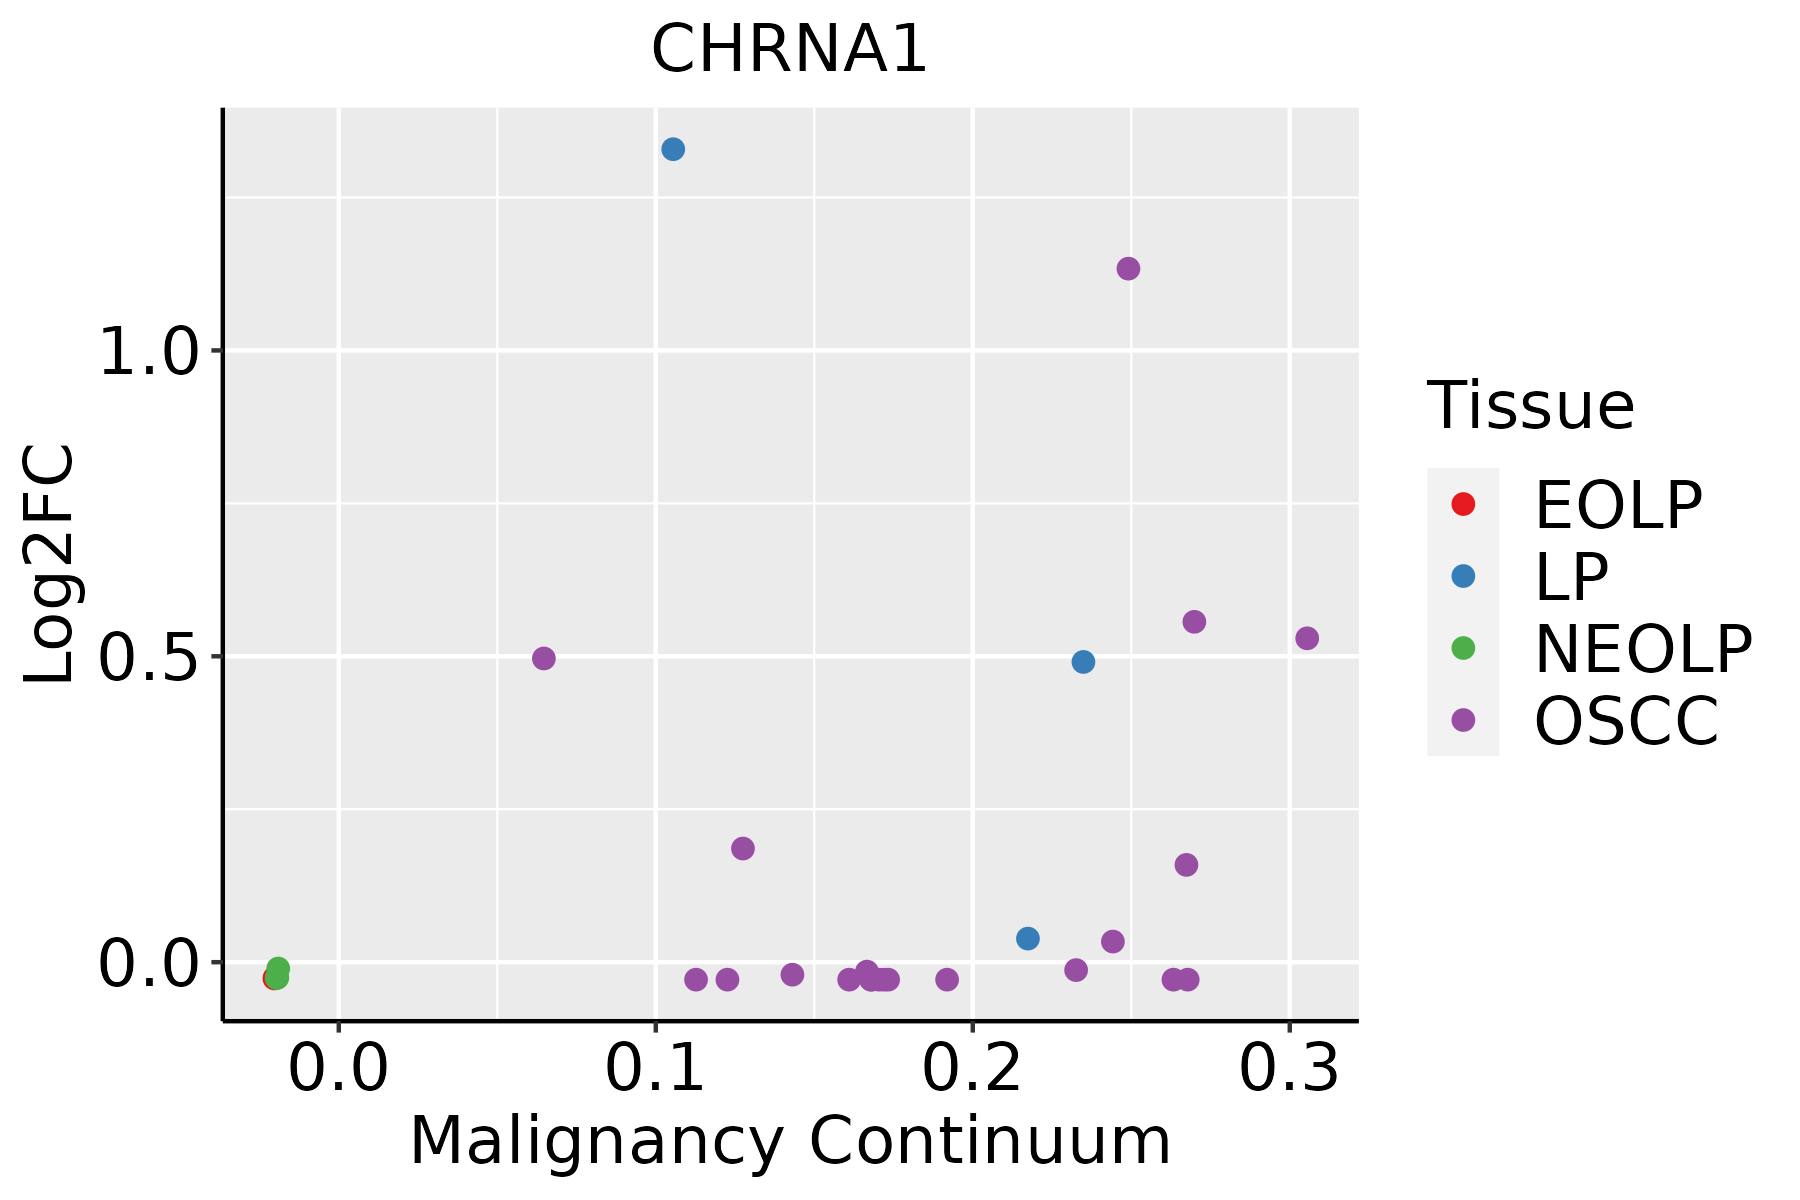 | EOLP: Erosive Oral lichen planus |
| LP: leukoplakia | ||
| NEOLP: Non-erosive oral lichen planus | ||
| OSCC: Oral squamous cell carcinoma |
| ∗log2FC in expression of this searched gene in stem-like cells from each diseased tissue sample relative to stem-like cells in normal samples in each tissue plotted against the malignancy continuum. Samples are colored based on if they are from different disease stage. |
Top |
Malignant transformation related pathway analysis |
| Find out the enriched GO biological processes and KEGG pathways involved in transition from healthy to precancer to cancer |
| Tissue | Disease Stage | Enriched GO biological Processes |
| Colorectum | AD |  |
| Colorectum | SER |  |
| Colorectum | MSS |  |
| Colorectum | MSI-H |  |
| Colorectum | FAP |  |
| ∗Top 15 enriched GO BP terms are showed in the bar plot of each disease state in each tissue. Each row represents a significant GO biological process which is colored according to the -log10(p.adjust). |
| Page: 1 2 3 4 5 6 7 8 9 |
| GO ID | Tissue | Disease Stage | Description | Gene Ratio | Bg Ratio | pvalue | p.adjust | Count |
| GO:00605378 | Oral cavity | OSCC | muscle tissue development | 185/7305 | 403/18723 | 2.60e-03 | 1.14e-02 | 185 |
| GO:00147067 | Oral cavity | OSCC | striated muscle tissue development | 174/7305 | 384/18723 | 6.45e-03 | 2.40e-02 | 174 |
| Page: 1 |
| Pathway ID | Tissue | Disease Stage | Description | Gene Ratio | Bg Ratio | pvalue | p.adjust | qvalue | Count |
| Page: 1 |
Top |
Cell-cell communication analysis |
| Identification of potential cell-cell interactions between two cell types and their ligand-receptor pairs for different disease states |
| Ligand | Receptor | LRpair | Pathway | Tissue | Disease Stage |
| SLURP1 | CHRNA1 | SLURP1_CHRNA1 | SLURP | Esophagus | ESCC |
| SLURP1 | CHRNA1 | SLURP1_CHRNA1 | SLURP | HNSCC | ADJ |
| Page: 1 |
Top |
Single-cell gene regulatory network inference analysis |
| Find out the significant the regulons (TFs) and the target genes of each regulon across cell types for different disease states |
| TF | Cell Type | Tissue | Disease Stage | Target Gene | RSS | Regulon Activity |
| ∗The dot plots of a searched regulon are shown for all cell subpopulations in each disease state of each tissue based on the regulon specific score inferred using pySCENIC and by calculating the average expression. |
| Page: 1 |
Top |
Somatic mutation of malignant transformation related genes |
| Annotation of somatic variants for genes involved in malignant transformation |
| Hugo Symbol | Variant Class | Variant Classification | dbSNP RS | HGVSc | HGVSp | HGVSp Short | SWISSPROT | BIOTYPE | SIFT | PolyPhen | Tumor Sample Barcode | Tissue | Histology | Sex | Age | Stage | Therapy Types | Drugs | Outcome |
| CHRNA1 | SNV | Missense_Mutation | c.232N>A | p.Gln78Lys | p.Q78K | P02708 | protein_coding | deleterious(0) | probably_damaging(0.999) | TCGA-BH-A0HU-01 | Breast | breast invasive carcinoma | Female | <65 | I/II | Chemotherapy | docetaxel | SD | |
| CHRNA1 | SNV | Missense_Mutation | c.547N>C | p.Asp183His | p.D183H | P02708 | protein_coding | deleterious(0) | probably_damaging(1) | TCGA-D8-A1J8-01 | Breast | breast invasive carcinoma | Female | >=65 | I/II | Hormone Therapy | nolvadex | SD | |
| CHRNA1 | SNV | Missense_Mutation | novel | c.671A>T | p.Lys224Met | p.K224M | P02708 | protein_coding | tolerated(0.18) | possibly_damaging(0.771) | TCGA-LL-A441-01 | Breast | breast invasive carcinoma | Female | <65 | I/II | Chemotherapy | taxotere | CR |
| CHRNA1 | insertion | Frame_Shift_Ins | novel | c.525_526insTTGGTGGCGAGTG | p.Ile176LeufsTer12 | p.I176Lfs*12 | P02708 | protein_coding | TCGA-AO-A0JB-01 | Breast | breast invasive carcinoma | Female | <65 | III/IV | Chemotherapy | cyclophosphamide | SD | ||
| CHRNA1 | deletion | Frame_Shift_Del | rs768863116 | c.1154delN | p.Lys385ArgfsTer27 | p.K385Rfs*27 | P02708 | protein_coding | TCGA-EW-A2FV-01 | Breast | breast invasive carcinoma | Female | <65 | III/IV | Chemotherapy | docetaxel | SD | ||
| CHRNA1 | SNV | Missense_Mutation | c.1183N>A | p.Asp395Asn | p.D395N | P02708 | protein_coding | tolerated(0.19) | possibly_damaging(0.794) | TCGA-IR-A3LH-01 | Cervix | cervical & endocervical cancer | Female | <65 | I/II | Chemotherapy | cisplatin | CR | |
| CHRNA1 | SNV | Missense_Mutation | c.567N>C | p.Met189Ile | p.M189I | P02708 | protein_coding | deleterious(0.01) | probably_damaging(0.998) | TCGA-JW-A5VL-01 | Cervix | cervical & endocervical cancer | Female | <65 | I/II | Unknown | Unknown | SD | |
| CHRNA1 | SNV | Missense_Mutation | rs372104868 | c.1408N>A | p.Val470Met | p.V470M | P02708 | protein_coding | deleterious(0.01) | probably_damaging(0.951) | TCGA-ZJ-AAXF-01 | Cervix | cervical & endocervical cancer | Female | <65 | I/II | Unknown | Unknown | SD |
| CHRNA1 | SNV | Missense_Mutation | novel | c.893N>C | p.Leu298Ser | p.L298S | P02708 | protein_coding | deleterious(0) | probably_damaging(1) | TCGA-AA-3494-01 | Colorectum | colon adenocarcinoma | Male | <65 | III/IV | Chemotherapy | folinic | PR |
| CHRNA1 | SNV | Missense_Mutation | c.1087G>A | p.Asp363Asn | p.D363N | P02708 | protein_coding | tolerated(0.36) | benign(0.009) | TCGA-AA-A00N-01 | Colorectum | colon adenocarcinoma | Male | >=65 | I/II | Unknown | Unknown | PD |
| Page: 1 2 3 4 5 6 7 8 |
Top |
Related drugs of malignant transformation related genes |
| Identification of chemicals and drugs interact with genes involved in malignant transfromation |
| (DGIdb 4.0) |
| Entrez ID | Symbol | Category | Interaction Types | Drug Claim Name | Drug Name | PMIDs |
| 1134 | CHRNA1 | DRUGGABLE GENOME, ION CHANNEL, CELL SURFACE | antagonist | CHEMBL1200641 | CISATRACURIUM BESYLATE | |
| 1134 | CHRNA1 | DRUGGABLE GENOME, ION CHANNEL, CELL SURFACE | agonist | 178100830 | SUXAMETHONIUM | |
| 1134 | CHRNA1 | DRUGGABLE GENOME, ION CHANNEL, CELL SURFACE | antagonist | CHEMBL984 | MIVACURIUM CHLORIDE | |
| 1134 | CHRNA1 | DRUGGABLE GENOME, ION CHANNEL, CELL SURFACE | antagonist | 178100827 | PANCURONIUM | |
| 1134 | CHRNA1 | DRUGGABLE GENOME, ION CHANNEL, CELL SURFACE | antagonist | 178100790 | ||
| 1134 | CHRNA1 | DRUGGABLE GENOME, ION CHANNEL, CELL SURFACE | Decamethonium | DECAMETHONIUM | ||
| 1134 | CHRNA1 | DRUGGABLE GENOME, ION CHANNEL, CELL SURFACE | blocker | 135650296 | GALLAMINE | |
| 1134 | CHRNA1 | DRUGGABLE GENOME, ION CHANNEL, CELL SURFACE | antagonist | CHEMBL1237099 | DOXACURIUM CHLORIDE | |
| 1134 | CHRNA1 | DRUGGABLE GENOME, ION CHANNEL, CELL SURFACE | antagonist | CHEMBL1200993 | GALLAMINE TRIETHIODIDE | |
| 1134 | CHRNA1 | DRUGGABLE GENOME, ION CHANNEL, CELL SURFACE | antagonist | CHEMBL1739 | METOCURINE IODIDE |
| Page: 1 2 3 |

Copyright 2023-Present -The University of Texas Health Science Center at Houston |