
|
|||||
|
 | |
| |
| |
| |
| |
| |
|
Gene: CHRM3 |
Gene summary for CHRM3 |
| Gene information | Species | Human | Gene symbol | CHRM3 | Gene ID | 1131 |
| Gene name | cholinergic receptor muscarinic 3 | |
| Gene Alias | EGBRS | |
| Cytomap | 1q43 | |
| Gene Type | protein-coding | GO ID | GO:0003008 | UniProtAcc | A0A024R3S2 |
Top |
Malignant transformation analysis |
| Identification of the aberrant gene expression in precancerous and cancerous lesions by comparing the gene expression of stem-like cells in diseased tissues with normal stem cells |
| Entrez ID | Symbol | Replicates | Species | Organ | Tissue | Adj P-value | Log2FC | Malignancy |
| 1131 | CHRM3 | HTA11_3410_2000001011 | Human | Colorectum | AD | 1.02e-03 | -3.69e-01 | 0.0155 |
| 1131 | CHRM3 | HTA11_2487_2000001011 | Human | Colorectum | SER | 1.61e-08 | -6.79e-01 | -0.1808 |
| 1131 | CHRM3 | HTA11_78_2000001011 | Human | Colorectum | AD | 8.78e-11 | -7.07e-01 | -0.1088 |
| 1131 | CHRM3 | HTA11_411_2000001011 | Human | Colorectum | SER | 1.08e-02 | -9.46e-01 | -0.2602 |
| 1131 | CHRM3 | HTA11_2112_2000001011 | Human | Colorectum | SER | 1.96e-02 | -8.16e-01 | -0.2196 |
| 1131 | CHRM3 | HTA11_3361_2000001011 | Human | Colorectum | AD | 6.66e-20 | -9.31e-01 | -0.1207 |
| 1131 | CHRM3 | HTA11_83_2000001011 | Human | Colorectum | SER | 5.76e-13 | -8.45e-01 | -0.1526 |
| 1131 | CHRM3 | HTA11_696_2000001011 | Human | Colorectum | AD | 4.66e-06 | -3.98e-01 | -0.1464 |
| 1131 | CHRM3 | HTA11_866_2000001011 | Human | Colorectum | AD | 8.46e-08 | -4.65e-01 | -0.1001 |
| 1131 | CHRM3 | HTA11_5212_2000001011 | Human | Colorectum | AD | 1.21e-08 | -9.81e-01 | -0.2061 |
| 1131 | CHRM3 | HTA11_546_2000001011 | Human | Colorectum | AD | 6.44e-03 | -4.82e-01 | -0.0842 |
| 1131 | CHRM3 | HTA11_9341_2000001011 | Human | Colorectum | SER | 2.73e-05 | -8.72e-01 | -0.00410000000000005 |
| 1131 | CHRM3 | HTA11_8622_2000001021 | Human | Colorectum | SER | 2.73e-02 | -6.63e-01 | 0.0528 |
| 1131 | CHRM3 | HTA11_6801_2000001011 | Human | Colorectum | SER | 2.68e-03 | -7.71e-01 | 0.0171 |
| 1131 | CHRM3 | HTA11_10711_2000001011 | Human | Colorectum | AD | 2.73e-04 | -5.27e-01 | 0.0338 |
| 1131 | CHRM3 | HTA11_7696_3000711011 | Human | Colorectum | AD | 5.67e-07 | -4.28e-01 | 0.0674 |
| 1131 | CHRM3 | HTA11_11156_2000001011 | Human | Colorectum | AD | 3.95e-02 | -5.43e-01 | 0.0397 |
| 1131 | CHRM3 | HTA11_6818_2000001021 | Human | Colorectum | AD | 4.65e-03 | 5.79e-01 | 0.0588 |
| 1131 | CHRM3 | HTA11_99999970781_79442 | Human | Colorectum | MSS | 7.00e-23 | -6.38e-01 | 0.294 |
| 1131 | CHRM3 | HTA11_99999965062_69753 | Human | Colorectum | MSI-H | 1.99e-22 | 1.44e+00 | 0.3487 |
| Page: 1 2 3 4 5 |
| Tissue | Expression Dynamics | Abbreviation |
| Colorectum (GSE201348) |  | FAP: Familial adenomatous polyposis |
| CRC: Colorectal cancer | ||
| Colorectum (HTA11) |  | AD: Adenomas |
| SER: Sessile serrated lesions | ||
| MSI-H: Microsatellite-high colorectal cancer | ||
| MSS: Microsatellite stable colorectal cancer | ||
| Esophagus | 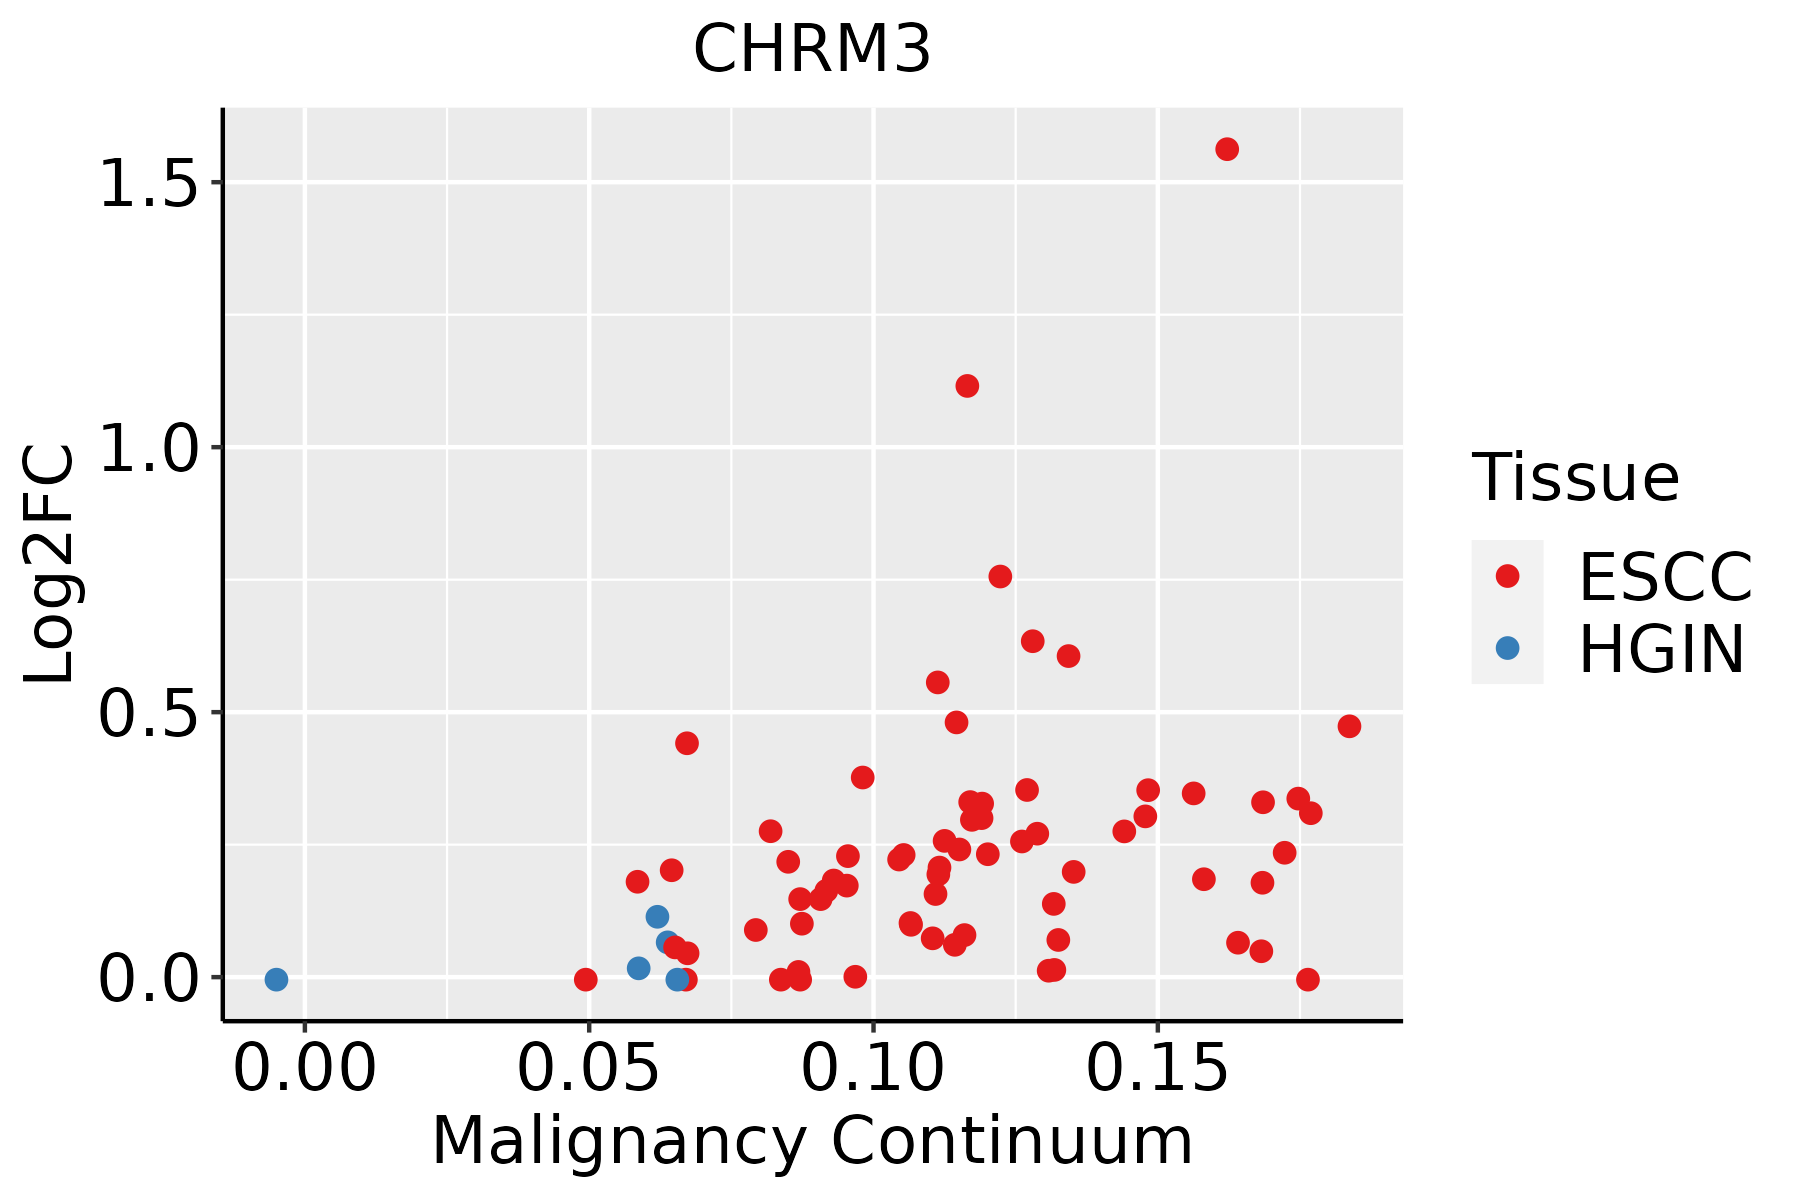 | ESCC: Esophageal squamous cell carcinoma |
| HGIN: High-grade intraepithelial neoplasias | ||
| LGIN: Low-grade intraepithelial neoplasias |
| ∗log2FC in expression of this searched gene in stem-like cells from each diseased tissue sample relative to stem-like cells in normal samples in each tissue plotted against the malignancy continuum. Samples are colored based on if they are from different disease stage. |
Top |
Malignant transformation related pathway analysis |
| Find out the enriched GO biological processes and KEGG pathways involved in transition from healthy to precancer to cancer |
| Tissue | Disease Stage | Enriched GO biological Processes |
| Colorectum | AD |  |
| Colorectum | SER |  |
| Colorectum | MSS |  |
| Colorectum | MSI-H |  |
| Colorectum | FAP |  |
| ∗Top 15 enriched GO BP terms are showed in the bar plot of each disease state in each tissue. Each row represents a significant GO biological process which is colored according to the -log10(p.adjust). |
| Page: 1 2 3 4 5 6 7 8 9 |
| GO ID | Tissue | Disease Stage | Description | Gene Ratio | Bg Ratio | pvalue | p.adjust | Count |
| GO:0050878 | Colorectum | AD | regulation of body fluid levels | 108/3918 | 379/18723 | 2.54e-04 | 3.20e-03 | 108 |
| GO:0007589 | Colorectum | AD | body fluid secretion | 33/3918 | 93/18723 | 8.26e-04 | 8.13e-03 | 33 |
| GO:0090257 | Colorectum | AD | regulation of muscle system process | 73/3918 | 252/18723 | 1.46e-03 | 1.24e-02 | 73 |
| GO:00902571 | Colorectum | SER | regulation of muscle system process | 60/2897 | 252/18723 | 3.28e-04 | 5.22e-03 | 60 |
| GO:0022600 | Colorectum | SER | digestive system process | 29/2897 | 104/18723 | 8.57e-04 | 1.05e-02 | 29 |
| GO:00508781 | Colorectum | SER | regulation of body fluid levels | 81/2897 | 379/18723 | 1.28e-03 | 1.43e-02 | 81 |
| GO:00075891 | Colorectum | SER | body fluid secretion | 26/2897 | 93/18723 | 1.49e-03 | 1.60e-02 | 26 |
| GO:0003012 | Colorectum | SER | muscle system process | 92/2897 | 452/18723 | 2.98e-03 | 2.63e-02 | 92 |
| GO:0032941 | Colorectum | SER | secretion by tissue | 13/2897 | 38/18723 | 3.40e-03 | 2.90e-02 | 13 |
| GO:0032409 | Colorectum | SER | regulation of transporter activity | 65/2897 | 310/18723 | 5.71e-03 | 4.19e-02 | 65 |
| GO:00508782 | Colorectum | MSS | regulation of body fluid levels | 99/3467 | 379/18723 | 1.40e-04 | 2.07e-03 | 99 |
| GO:00902572 | Colorectum | MSS | regulation of muscle system process | 66/3467 | 252/18723 | 1.55e-03 | 1.41e-02 | 66 |
| GO:00324091 | Colorectum | MSS | regulation of transporter activity | 78/3467 | 310/18723 | 2.09e-03 | 1.78e-02 | 78 |
| GO:00075892 | Colorectum | MSS | body fluid secretion | 29/3467 | 93/18723 | 2.21e-03 | 1.84e-02 | 29 |
| GO:0022898 | Colorectum | MSS | regulation of transmembrane transporter activity | 70/3467 | 278/18723 | 3.36e-03 | 2.54e-02 | 70 |
| GO:00226001 | Colorectum | MSS | digestive system process | 31/3467 | 104/18723 | 3.46e-03 | 2.59e-02 | 31 |
| GO:00030121 | Colorectum | MSS | muscle system process | 105/3467 | 452/18723 | 6.39e-03 | 4.26e-02 | 105 |
| GO:0032412 | Colorectum | MSS | regulation of ion transmembrane transporter activity | 66/3467 | 267/18723 | 6.72e-03 | 4.38e-02 | 66 |
| GO:0006937 | Colorectum | MSI-H | regulation of muscle contraction | 24/1319 | 169/18723 | 7.87e-04 | 1.46e-02 | 24 |
| GO:00902573 | Colorectum | MSI-H | regulation of muscle system process | 31/1319 | 252/18723 | 1.74e-03 | 2.52e-02 | 31 |
| Page: 1 2 3 |
| Pathway ID | Tissue | Disease Stage | Description | Gene Ratio | Bg Ratio | pvalue | p.adjust | qvalue | Count |
| hsa05010 | Colorectum | AD | Alzheimer disease | 174/2092 | 384/8465 | 1.82e-19 | 9.26e-18 | 5.91e-18 | 174 |
| hsa05022 | Colorectum | AD | Pathways of neurodegeneration - multiple diseases | 201/2092 | 476/8465 | 4.54e-18 | 1.27e-16 | 8.09e-17 | 201 |
| hsa04810 | Colorectum | AD | Regulation of actin cytoskeleton | 75/2092 | 229/8465 | 3.36e-03 | 1.76e-02 | 1.12e-02 | 75 |
| hsa04971 | Colorectum | AD | Gastric acid secretion | 29/2092 | 76/8465 | 6.25e-03 | 2.68e-02 | 1.71e-02 | 29 |
| hsa04972 | Colorectum | AD | Pancreatic secretion | 36/2092 | 102/8465 | 1.06e-02 | 3.98e-02 | 2.54e-02 | 36 |
| hsa050101 | Colorectum | AD | Alzheimer disease | 174/2092 | 384/8465 | 1.82e-19 | 9.26e-18 | 5.91e-18 | 174 |
| hsa050221 | Colorectum | AD | Pathways of neurodegeneration - multiple diseases | 201/2092 | 476/8465 | 4.54e-18 | 1.27e-16 | 8.09e-17 | 201 |
| hsa048101 | Colorectum | AD | Regulation of actin cytoskeleton | 75/2092 | 229/8465 | 3.36e-03 | 1.76e-02 | 1.12e-02 | 75 |
| hsa049711 | Colorectum | AD | Gastric acid secretion | 29/2092 | 76/8465 | 6.25e-03 | 2.68e-02 | 1.71e-02 | 29 |
| hsa049721 | Colorectum | AD | Pancreatic secretion | 36/2092 | 102/8465 | 1.06e-02 | 3.98e-02 | 2.54e-02 | 36 |
| hsa050102 | Colorectum | SER | Alzheimer disease | 146/1580 | 384/8465 | 6.52e-20 | 2.40e-18 | 1.75e-18 | 146 |
| hsa050222 | Colorectum | SER | Pathways of neurodegeneration - multiple diseases | 168/1580 | 476/8465 | 6.23e-19 | 2.07e-17 | 1.50e-17 | 168 |
| hsa049712 | Colorectum | SER | Gastric acid secretion | 27/1580 | 76/8465 | 3.65e-04 | 3.27e-03 | 2.38e-03 | 27 |
| hsa048102 | Colorectum | SER | Regulation of actin cytoskeleton | 60/1580 | 229/8465 | 2.74e-03 | 2.02e-02 | 1.47e-02 | 60 |
| hsa049722 | Colorectum | SER | Pancreatic secretion | 30/1580 | 102/8465 | 5.41e-03 | 3.28e-02 | 2.38e-02 | 30 |
| hsa050103 | Colorectum | SER | Alzheimer disease | 146/1580 | 384/8465 | 6.52e-20 | 2.40e-18 | 1.75e-18 | 146 |
| hsa050223 | Colorectum | SER | Pathways of neurodegeneration - multiple diseases | 168/1580 | 476/8465 | 6.23e-19 | 2.07e-17 | 1.50e-17 | 168 |
| hsa049713 | Colorectum | SER | Gastric acid secretion | 27/1580 | 76/8465 | 3.65e-04 | 3.27e-03 | 2.38e-03 | 27 |
| hsa048103 | Colorectum | SER | Regulation of actin cytoskeleton | 60/1580 | 229/8465 | 2.74e-03 | 2.02e-02 | 1.47e-02 | 60 |
| hsa049723 | Colorectum | SER | Pancreatic secretion | 30/1580 | 102/8465 | 5.41e-03 | 3.28e-02 | 2.38e-02 | 30 |
| Page: 1 2 3 4 |
Top |
Cell-cell communication analysis |
| Identification of potential cell-cell interactions between two cell types and their ligand-receptor pairs for different disease states |
| Ligand | Receptor | LRpair | Pathway | Tissue | Disease Stage |
| Page: 1 |
Top |
Single-cell gene regulatory network inference analysis |
| Find out the significant the regulons (TFs) and the target genes of each regulon across cell types for different disease states |
| TF | Cell Type | Tissue | Disease Stage | Target Gene | RSS | Regulon Activity |
| ∗The dot plots of a searched regulon are shown for all cell subpopulations in each disease state of each tissue based on the regulon specific score inferred using pySCENIC and by calculating the average expression. |
| Page: 1 |
Top |
Somatic mutation of malignant transformation related genes |
| Annotation of somatic variants for genes involved in malignant transformation |
| Hugo Symbol | Variant Class | Variant Classification | dbSNP RS | HGVSc | HGVSp | HGVSp Short | SWISSPROT | BIOTYPE | SIFT | PolyPhen | Tumor Sample Barcode | Tissue | Histology | Sex | Age | Stage | Therapy Types | Drugs | Outcome |
| CHRM3 | SNV | Missense_Mutation | rs201639396 | c.928N>T | p.Arg310Cys | p.R310C | P20309 | protein_coding | tolerated(0.13) | benign(0.01) | TCGA-A8-A08G-01 | Breast | breast invasive carcinoma | Female | <65 | I/II | Chemotherapy | 5-fluorouracil | CR |
| CHRM3 | SNV | Missense_Mutation | rs201042655 | c.100G>A | p.Val34Ile | p.V34I | P20309 | protein_coding | tolerated_low_confidence(0.4) | benign(0) | TCGA-AN-A046-01 | Breast | breast invasive carcinoma | Female | >=65 | I/II | Unknown | Unknown | SD |
| CHRM3 | SNV | Missense_Mutation | rs776861962 | c.377C>T | p.Thr126Met | p.T126M | P20309 | protein_coding | deleterious(0) | probably_damaging(1) | TCGA-BH-A18G-01 | Breast | breast invasive carcinoma | Female | >=65 | I/II | Unknown | Unknown | SD |
| CHRM3 | SNV | Missense_Mutation | c.352G>A | p.Gly118Arg | p.G118R | P20309 | protein_coding | deleterious(0) | probably_damaging(1) | TCGA-E2-A15I-01 | Breast | breast invasive carcinoma | Female | <65 | I/II | Hormone Therapy | tamoxiphen | SD | |
| CHRM3 | SNV | Missense_Mutation | c.249N>G | p.Ile83Met | p.I83M | P20309 | protein_coding | deleterious(0) | probably_damaging(0.957) | TCGA-Q1-A5R2-01 | Cervix | cervical & endocervical cancer | Female | <65 | I/II | Chemotherapy | cisplatin | PR | |
| CHRM3 | SNV | Missense_Mutation | c.1622N>A | p.Pro541His | p.P541H | P20309 | protein_coding | deleterious(0) | probably_damaging(1) | TCGA-Q1-A5R2-01 | Cervix | cervical & endocervical cancer | Female | <65 | I/II | Chemotherapy | cisplatin | PR | |
| CHRM3 | SNV | Missense_Mutation | rs145638222 | c.1240N>A | p.Val414Met | p.V414M | P20309 | protein_coding | tolerated(0.14) | benign(0.003) | TCGA-Q1-A6DT-01 | Cervix | cervical & endocervical cancer | Female | <65 | I/II | Unknown | Unknown | PD |
| CHRM3 | SNV | Missense_Mutation | c.781C>T | p.Arg261Cys | p.R261C | P20309 | protein_coding | deleterious(0) | probably_damaging(1) | TCGA-AA-3864-01 | Colorectum | colon adenocarcinoma | Male | >=65 | I/II | Unknown | Unknown | SD | |
| CHRM3 | SNV | Missense_Mutation | c.200N>G | p.Gln67Arg | p.Q67R | P20309 | protein_coding | deleterious(0) | possibly_damaging(0.778) | TCGA-AA-A01R-01 | Colorectum | colon adenocarcinoma | Male | <65 | III/IV | Chemotherapy | 5-fluorouracil | PD | |
| CHRM3 | SNV | Missense_Mutation | c.535A>G | p.Lys179Glu | p.K179E | P20309 | protein_coding | deleterious(0) | probably_damaging(1) | TCGA-AD-6901-01 | Colorectum | colon adenocarcinoma | Male | >=65 | I/II | Chemotherapy | xeloda | PD |
| Page: 1 2 3 4 5 6 7 8 9 10 11 12 13 14 15 16 |
Top |
Related drugs of malignant transformation related genes |
| Identification of chemicals and drugs interact with genes involved in malignant transfromation |
| (DGIdb 4.0) |
| Entrez ID | Symbol | Category | Interaction Types | Drug Claim Name | Drug Name | PMIDs |
| 1131 | CHRM3 | DRUGGABLE GENOME, G PROTEIN COUPLED RECEPTOR | agonist | 135652666 | ARECOLINE | |
| 1131 | CHRM3 | DRUGGABLE GENOME, G PROTEIN COUPLED RECEPTOR | antagonist | 385612230 | ||
| 1131 | CHRM3 | DRUGGABLE GENOME, G PROTEIN COUPLED RECEPTOR | LAS-34273 | ACLIDINIUM BROMIDE | ||
| 1131 | CHRM3 | DRUGGABLE GENOME, G PROTEIN COUPLED RECEPTOR | antagonist | CHEMBL1201027 | GLYCOPYRROLATE | |
| 1131 | CHRM3 | DRUGGABLE GENOME, G PROTEIN COUPLED RECEPTOR | agonist | CHEMBL1184 | ACETYLCHOLINE CHLORIDE | |
| 1131 | CHRM3 | DRUGGABLE GENOME, G PROTEIN COUPLED RECEPTOR | antagonist | 135652751 | ||
| 1131 | CHRM3 | DRUGGABLE GENOME, G PROTEIN COUPLED RECEPTOR | antagonist | CHEMBL1201024 | METHSCOPOLAMINE BROMIDE | |
| 1131 | CHRM3 | DRUGGABLE GENOME, G PROTEIN COUPLED RECEPTOR | SOLIFENACIN | SOLIFENACIN | ||
| 1131 | CHRM3 | DRUGGABLE GENOME, G PROTEIN COUPLED RECEPTOR | antagonist | CHEMBL1578 | ANISOTROPINE METHYLBROMIDE | |
| 1131 | CHRM3 | DRUGGABLE GENOME, G PROTEIN COUPLED RECEPTOR | allosteric modulator | 135652725 | VINCAMINE |
| Page: 1 2 3 4 5 6 7 8 9 10 11 12 13 14 15 16 17 18 19 20 |

Copyright 2023-Present -The University of Texas Health Science Center at Houston |