
|
|||||
|
 | |
| |
| |
| |
| |
| |
|
Gene: CHRDL2 |
Gene summary for CHRDL2 |
| Gene information | Species | Human | Gene symbol | CHRDL2 | Gene ID | 25884 |
| Gene name | chordin like 2 | |
| Gene Alias | BNF1 | |
| Cytomap | 11q13.4 | |
| Gene Type | protein-coding | GO ID | GO:0001501 | UniProtAcc | Q6WN34 |
Top |
Malignant transformation analysis |
| Identification of the aberrant gene expression in precancerous and cancerous lesions by comparing the gene expression of stem-like cells in diseased tissues with normal stem cells |
| Entrez ID | Symbol | Replicates | Species | Organ | Tissue | Adj P-value | Log2FC | Malignancy |
| 25884 | CHRDL2 | HCC1_Meng | Human | Liver | HCC | 1.83e-15 | 3.91e-02 | 0.0246 |
| 25884 | CHRDL2 | S027 | Human | Liver | HCC | 4.69e-23 | 1.53e+00 | 0.2446 |
| 25884 | CHRDL2 | S028 | Human | Liver | HCC | 1.12e-35 | 1.38e+00 | 0.2503 |
| 25884 | CHRDL2 | S029 | Human | Liver | HCC | 8.92e-41 | 1.71e+00 | 0.2581 |
| 25884 | CHRDL2 | C07 | Human | Oral cavity | OSCC | 4.72e-06 | 2.41e+00 | 0.2491 |
| 25884 | CHRDL2 | LP16 | Human | Oral cavity | LP | 1.90e-02 | 1.11e+00 | 0.1055 |
| Page: 1 |
| Tissue | Expression Dynamics | Abbreviation |
| Liver | 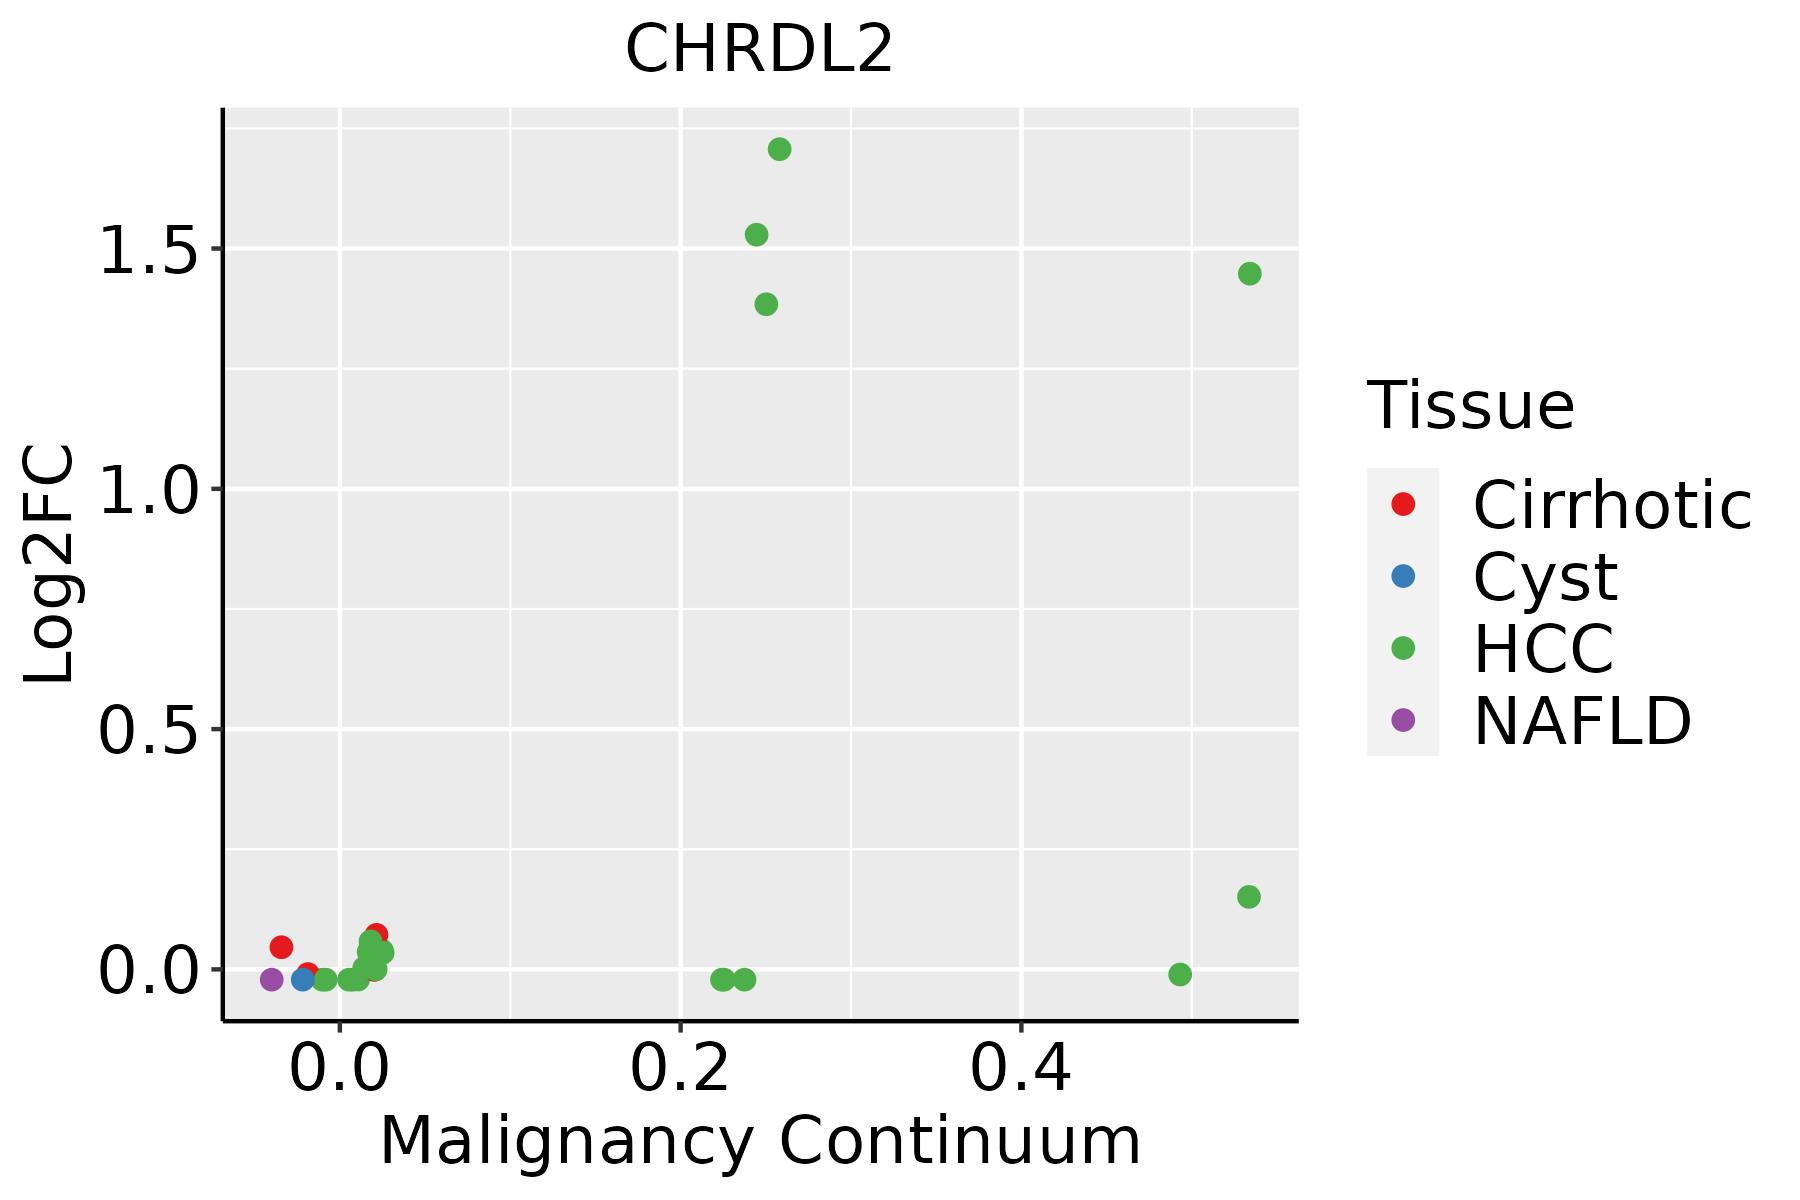 | HCC: Hepatocellular carcinoma |
| NAFLD: Non-alcoholic fatty liver disease | ||
| Oral Cavity | 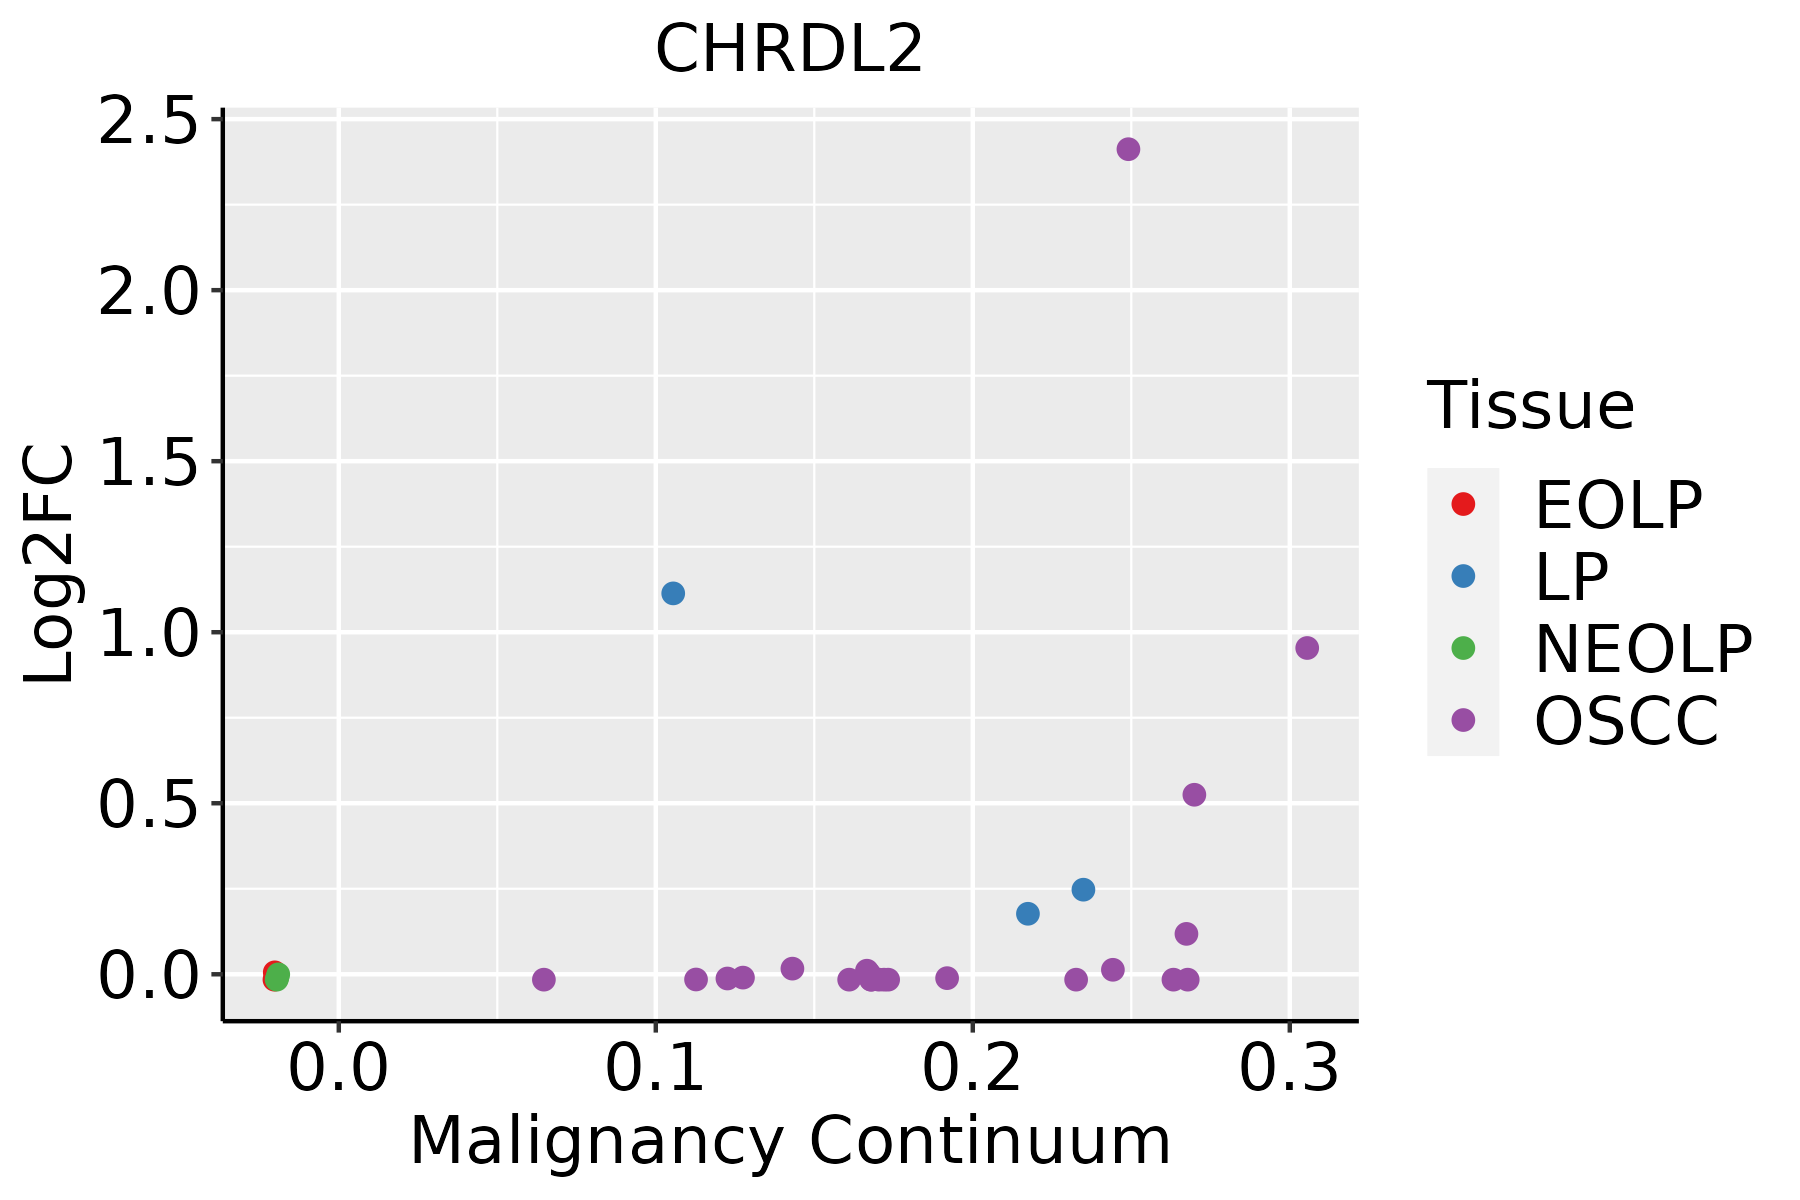 | EOLP: Erosive Oral lichen planus |
| LP: leukoplakia | ||
| NEOLP: Non-erosive oral lichen planus | ||
| OSCC: Oral squamous cell carcinoma |
| ∗log2FC in expression of this searched gene in stem-like cells from each diseased tissue sample relative to stem-like cells in normal samples in each tissue plotted against the malignancy continuum. Samples are colored based on if they are from different disease stage. |
Top |
Malignant transformation related pathway analysis |
| Find out the enriched GO biological processes and KEGG pathways involved in transition from healthy to precancer to cancer |
| Tissue | Disease Stage | Enriched GO biological Processes |
| Colorectum | AD |  |
| Colorectum | SER |  |
| Colorectum | MSS |  |
| Colorectum | MSI-H |  |
| Colorectum | FAP |  |
| ∗Top 15 enriched GO BP terms are showed in the bar plot of each disease state in each tissue. Each row represents a significant GO biological process which is colored according to the -log10(p.adjust). |
| Page: 1 2 3 4 5 6 7 8 9 |
| GO ID | Tissue | Disease Stage | Description | Gene Ratio | Bg Ratio | pvalue | p.adjust | Count |
| GO:000150310 | Oral cavity | OSCC | ossification | 203/7305 | 408/18723 | 5.54e-06 | 6.19e-05 | 203 |
| GO:000150315 | Oral cavity | LP | ossification | 123/4623 | 408/18723 | 6.55e-03 | 3.84e-02 | 123 |
| Page: 1 |
| Pathway ID | Tissue | Disease Stage | Description | Gene Ratio | Bg Ratio | pvalue | p.adjust | qvalue | Count |
| Page: 1 |
Top |
Cell-cell communication analysis |
| Identification of potential cell-cell interactions between two cell types and their ligand-receptor pairs for different disease states |
| Ligand | Receptor | LRpair | Pathway | Tissue | Disease Stage |
| Page: 1 |
Top |
Single-cell gene regulatory network inference analysis |
| Find out the significant the regulons (TFs) and the target genes of each regulon across cell types for different disease states |
| TF | Cell Type | Tissue | Disease Stage | Target Gene | RSS | Regulon Activity |
| ∗The dot plots of a searched regulon are shown for all cell subpopulations in each disease state of each tissue based on the regulon specific score inferred using pySCENIC and by calculating the average expression. |
| Page: 1 |
Top |
Somatic mutation of malignant transformation related genes |
| Annotation of somatic variants for genes involved in malignant transformation |
| Hugo Symbol | Variant Class | Variant Classification | dbSNP RS | HGVSc | HGVSp | HGVSp Short | SWISSPROT | BIOTYPE | SIFT | PolyPhen | Tumor Sample Barcode | Tissue | Histology | Sex | Age | Stage | Therapy Types | Drugs | Outcome |
| CHRDL2 | SNV | Missense_Mutation | novel | c.1169A>C | p.His390Pro | p.H390P | Q6WN34 | protein_coding | deleterious_low_confidence(0.04) | probably_damaging(0.991) | TCGA-BH-A0HL-01 | Breast | breast invasive carcinoma | Female | <65 | I/II | Chemotherapy | cyclophosphamide | SD |
| CHRDL2 | SNV | Missense_Mutation | rs764610716 | c.632C>T | p.Pro211Leu | p.P211L | Q6WN34 | protein_coding | tolerated(0.86) | benign(0.003) | TCGA-DG-A2KJ-01 | Cervix | cervical & endocervical cancer | Female | <65 | III/IV | Chemotherapy | cisplatin | SD |
| CHRDL2 | SNV | Missense_Mutation | novel | c.1018G>T | p.Val340Phe | p.V340F | Q6WN34 | protein_coding | deleterious(0.01) | possibly_damaging(0.806) | TCGA-DS-A1OC-01 | Cervix | cervical & endocervical cancer | Female | <65 | I/II | Chemotherapy | gemcitabine | SD |
| CHRDL2 | SNV | Missense_Mutation | rs189131085 | c.1176G>T | p.Gln392His | p.Q392H | Q6WN34 | protein_coding | tolerated_low_confidence(0.52) | probably_damaging(0.986) | TCGA-EA-A3HS-01 | Cervix | cervical & endocervical cancer | Female | <65 | I/II | Unknown | Unknown | SD |
| CHRDL2 | SNV | Missense_Mutation | rs766415152 | c.889N>A | p.Glu297Lys | p.E297K | Q6WN34 | protein_coding | tolerated(0.08) | benign(0.047) | TCGA-AA-3845-01 | Colorectum | colon adenocarcinoma | Female | >=65 | I/II | Unknown | Unknown | PD |
| CHRDL2 | SNV | Missense_Mutation | c.253G>C | p.Val85Leu | p.V85L | Q6WN34 | protein_coding | deleterious(0.01) | possibly_damaging(0.857) | TCGA-AA-A01P-01 | Colorectum | colon adenocarcinoma | Female | >=65 | III/IV | Unknown | Unknown | PD | |
| CHRDL2 | SNV | Missense_Mutation | c.1007G>T | p.Gly336Val | p.G336V | Q6WN34 | protein_coding | tolerated(0.42) | benign(0.28) | TCGA-AA-A022-01 | Colorectum | colon adenocarcinoma | Female | >=65 | I/II | Unknown | Unknown | SD | |
| CHRDL2 | SNV | Missense_Mutation | c.397N>T | p.Arg133Cys | p.R133C | Q6WN34 | protein_coding | deleterious(0) | probably_damaging(0.959) | TCGA-AD-6889-01 | Colorectum | colon adenocarcinoma | Male | >=65 | I/II | Chemotherapy | xeloda | PD | |
| CHRDL2 | SNV | Missense_Mutation | c.985N>G | p.Thr329Ala | p.T329A | Q6WN34 | protein_coding | tolerated(0.29) | benign(0) | TCGA-AU-6004-01 | Colorectum | colon adenocarcinoma | Female | >=65 | I/II | Unknown | Unknown | SD | |
| CHRDL2 | SNV | Missense_Mutation | novel | c.581N>C | p.Val194Ala | p.V194A | Q6WN34 | protein_coding | tolerated(0.37) | benign(0.005) | TCGA-AZ-6598-01 | Colorectum | colon adenocarcinoma | Female | >=65 | I/II | Unknown | Unknown | SD |
| Page: 1 2 3 4 |
Top |
Related drugs of malignant transformation related genes |
| Identification of chemicals and drugs interact with genes involved in malignant transfromation |
| (DGIdb 4.0) |
| Entrez ID | Symbol | Category | Interaction Types | Drug Claim Name | Drug Name | PMIDs |
| Page: 1 |

Copyright 2023-Present -The University of Texas Health Science Center at Houston |