
|
|||||
|
 | |
| |
| |
| |
| |
| |
|
Gene: CHRAC1 |
Gene summary for CHRAC1 |
| Gene information | Species | Human | Gene symbol | CHRAC1 | Gene ID | 54108 |
| Gene name | chromatin accessibility complex subunit 1 | |
| Gene Alias | CHARC1 | |
| Cytomap | 8q24.3 | |
| Gene Type | protein-coding | GO ID | GO:0006139 | UniProtAcc | Q9NRG0 |
Top |
Malignant transformation analysis |
| Identification of the aberrant gene expression in precancerous and cancerous lesions by comparing the gene expression of stem-like cells in diseased tissues with normal stem cells |
| Entrez ID | Symbol | Replicates | Species | Organ | Tissue | Adj P-value | Log2FC | Malignancy |
| 54108 | CHRAC1 | HTA11_3410_2000001011 | Human | Colorectum | AD | 1.08e-02 | 9.57e-02 | 0.0155 |
| 54108 | CHRAC1 | HTA11_2487_2000001011 | Human | Colorectum | SER | 9.02e-07 | 2.20e-01 | -0.1808 |
| 54108 | CHRAC1 | HTA11_1938_2000001011 | Human | Colorectum | AD | 1.22e-10 | 3.70e-01 | -0.0811 |
| 54108 | CHRAC1 | HTA11_78_2000001011 | Human | Colorectum | AD | 1.88e-06 | 1.86e-01 | -0.1088 |
| 54108 | CHRAC1 | HTA11_347_2000001011 | Human | Colorectum | AD | 1.27e-15 | 2.87e-01 | -0.1954 |
| 54108 | CHRAC1 | HTA11_411_2000001011 | Human | Colorectum | SER | 5.50e-04 | 3.56e-01 | -0.2602 |
| 54108 | CHRAC1 | HTA11_3361_2000001011 | Human | Colorectum | AD | 3.53e-02 | 2.34e-01 | -0.1207 |
| 54108 | CHRAC1 | HTA11_696_2000001011 | Human | Colorectum | AD | 9.32e-10 | 1.86e-01 | -0.1464 |
| 54108 | CHRAC1 | HTA11_866_2000001011 | Human | Colorectum | AD | 4.38e-06 | 1.40e-01 | -0.1001 |
| 54108 | CHRAC1 | HTA11_1391_2000001011 | Human | Colorectum | AD | 2.05e-09 | 2.44e-01 | -0.059 |
| 54108 | CHRAC1 | HTA11_866_3004761011 | Human | Colorectum | AD | 4.55e-07 | 1.71e-01 | 0.096 |
| 54108 | CHRAC1 | HTA11_7663_2000001011 | Human | Colorectum | SER | 2.60e-02 | 2.72e-01 | 0.0131 |
| 54108 | CHRAC1 | HTA11_6801_2000001011 | Human | Colorectum | SER | 3.66e-05 | 3.46e-01 | 0.0171 |
| 54108 | CHRAC1 | HTA11_7696_3000711011 | Human | Colorectum | AD | 4.07e-04 | 1.02e-01 | 0.0674 |
| 54108 | CHRAC1 | HTA11_99999970781_79442 | Human | Colorectum | MSS | 9.63e-08 | 1.68e-01 | 0.294 |
| 54108 | CHRAC1 | HTA11_99999965062_69753 | Human | Colorectum | MSI-H | 3.63e-04 | 4.73e-01 | 0.3487 |
| 54108 | CHRAC1 | HTA11_99999965104_69814 | Human | Colorectum | MSS | 1.06e-05 | 2.45e-01 | 0.281 |
| 54108 | CHRAC1 | HTA11_99999971662_82457 | Human | Colorectum | MSS | 2.67e-20 | 3.90e-01 | 0.3859 |
| 54108 | CHRAC1 | HTA11_99999974143_84620 | Human | Colorectum | MSS | 1.71e-02 | 9.23e-02 | 0.3005 |
| 54108 | CHRAC1 | LZE2T | Human | Esophagus | ESCC | 5.53e-05 | 5.41e-01 | 0.082 |
| Page: 1 2 3 4 5 6 7 |
| Tissue | Expression Dynamics | Abbreviation |
| Colorectum (GSE201348) |  | FAP: Familial adenomatous polyposis |
| CRC: Colorectal cancer | ||
| Colorectum (HTA11) |  | AD: Adenomas |
| SER: Sessile serrated lesions | ||
| MSI-H: Microsatellite-high colorectal cancer | ||
| MSS: Microsatellite stable colorectal cancer | ||
| Esophagus | 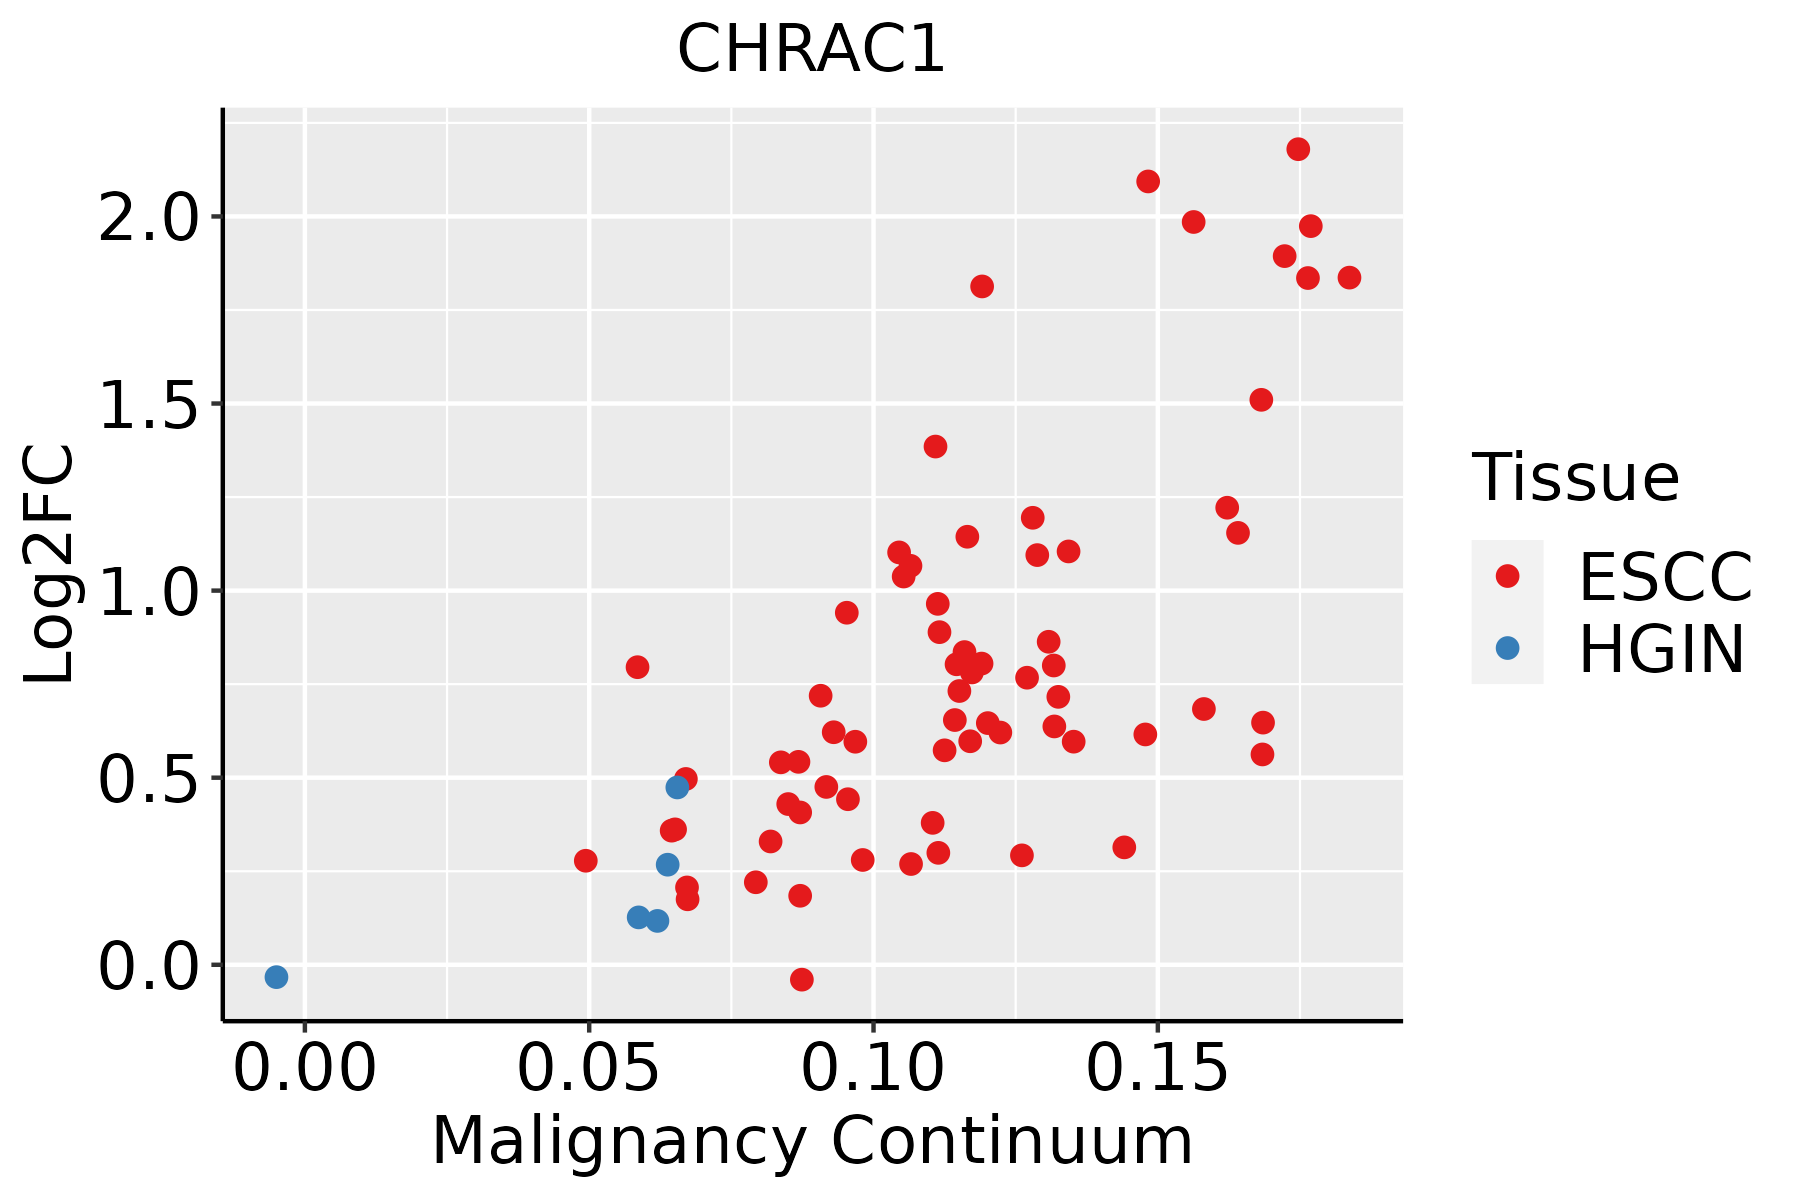 | ESCC: Esophageal squamous cell carcinoma |
| HGIN: High-grade intraepithelial neoplasias | ||
| LGIN: Low-grade intraepithelial neoplasias | ||
| Liver | 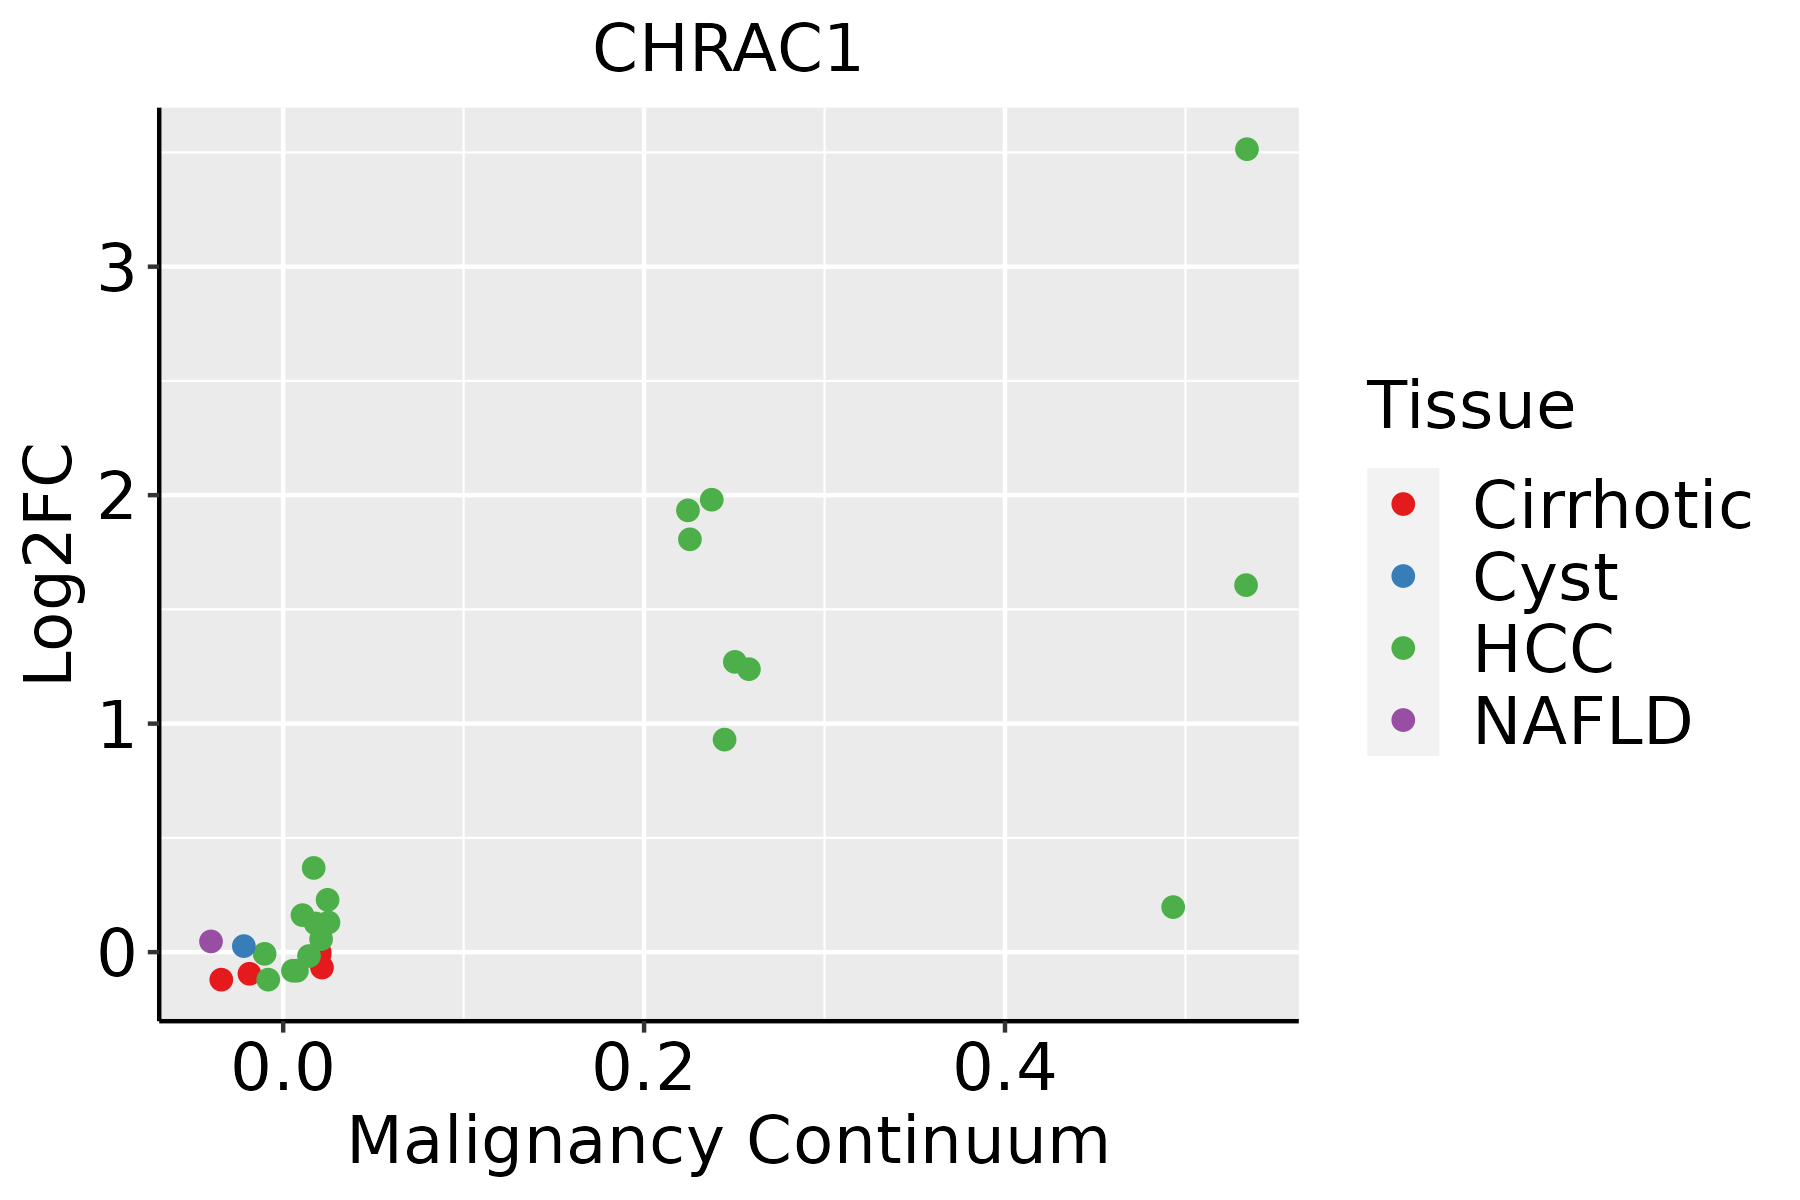 | HCC: Hepatocellular carcinoma |
| NAFLD: Non-alcoholic fatty liver disease | ||
| Oral Cavity | 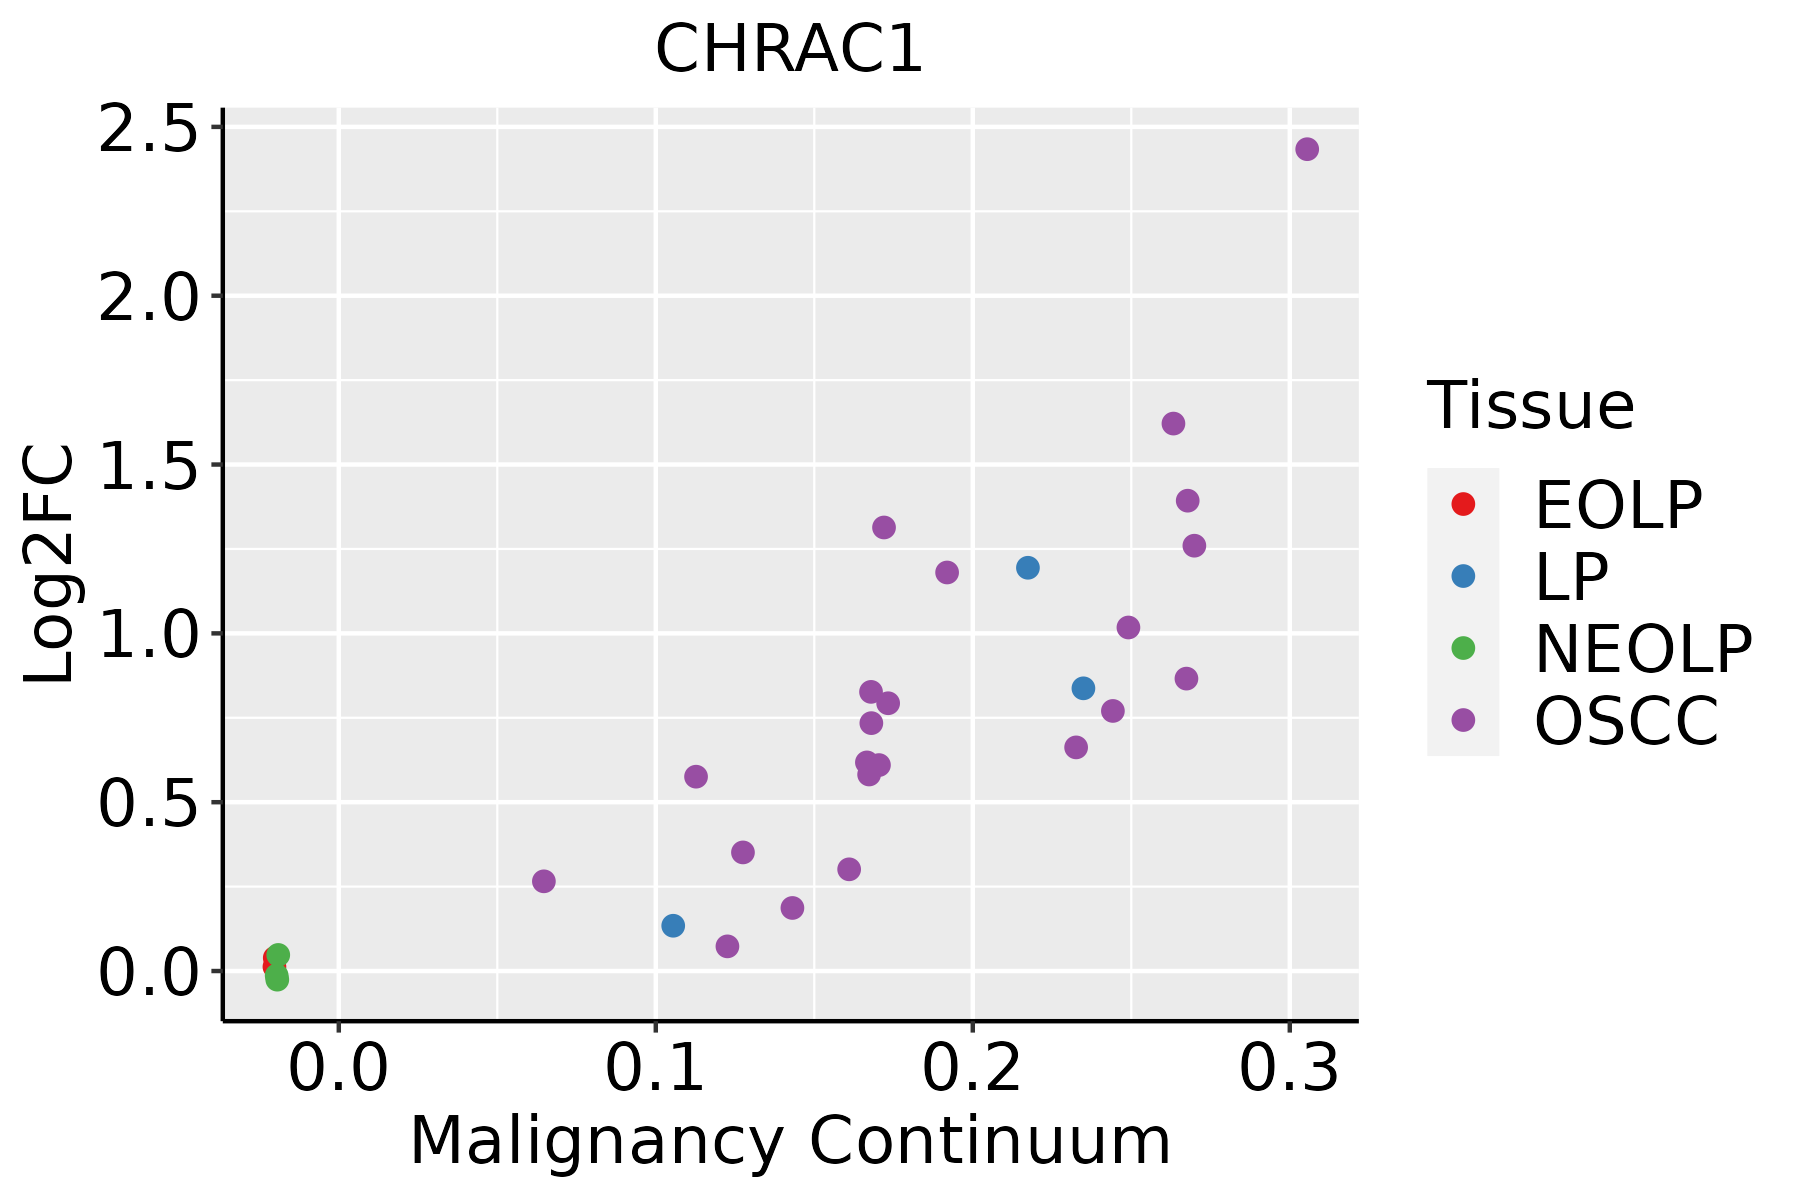 | EOLP: Erosive Oral lichen planus |
| LP: leukoplakia | ||
| NEOLP: Non-erosive oral lichen planus | ||
| OSCC: Oral squamous cell carcinoma | ||
| Skin | 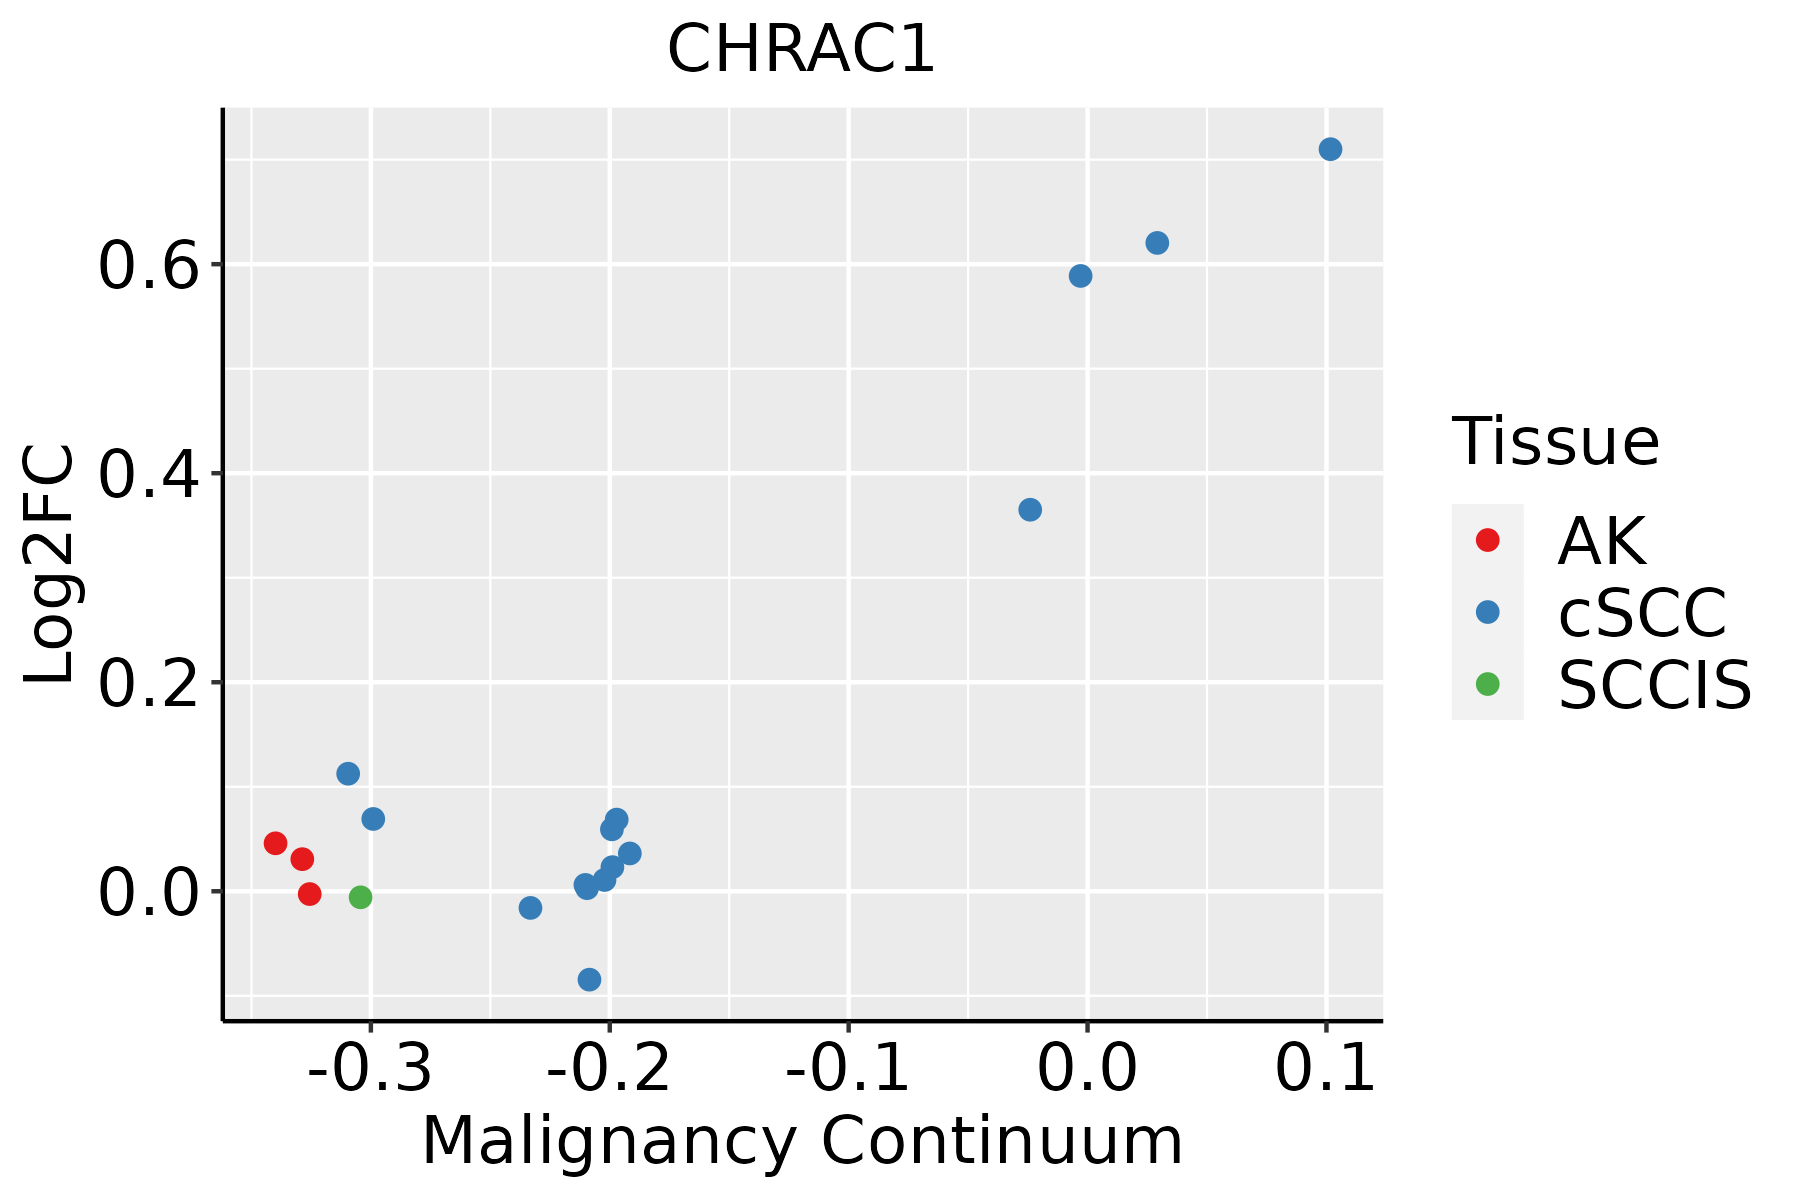 | AK: Actinic keratosis |
| cSCC: Cutaneous squamous cell carcinoma | ||
| SCCIS:squamous cell carcinoma in situ | ||
| Thyroid | 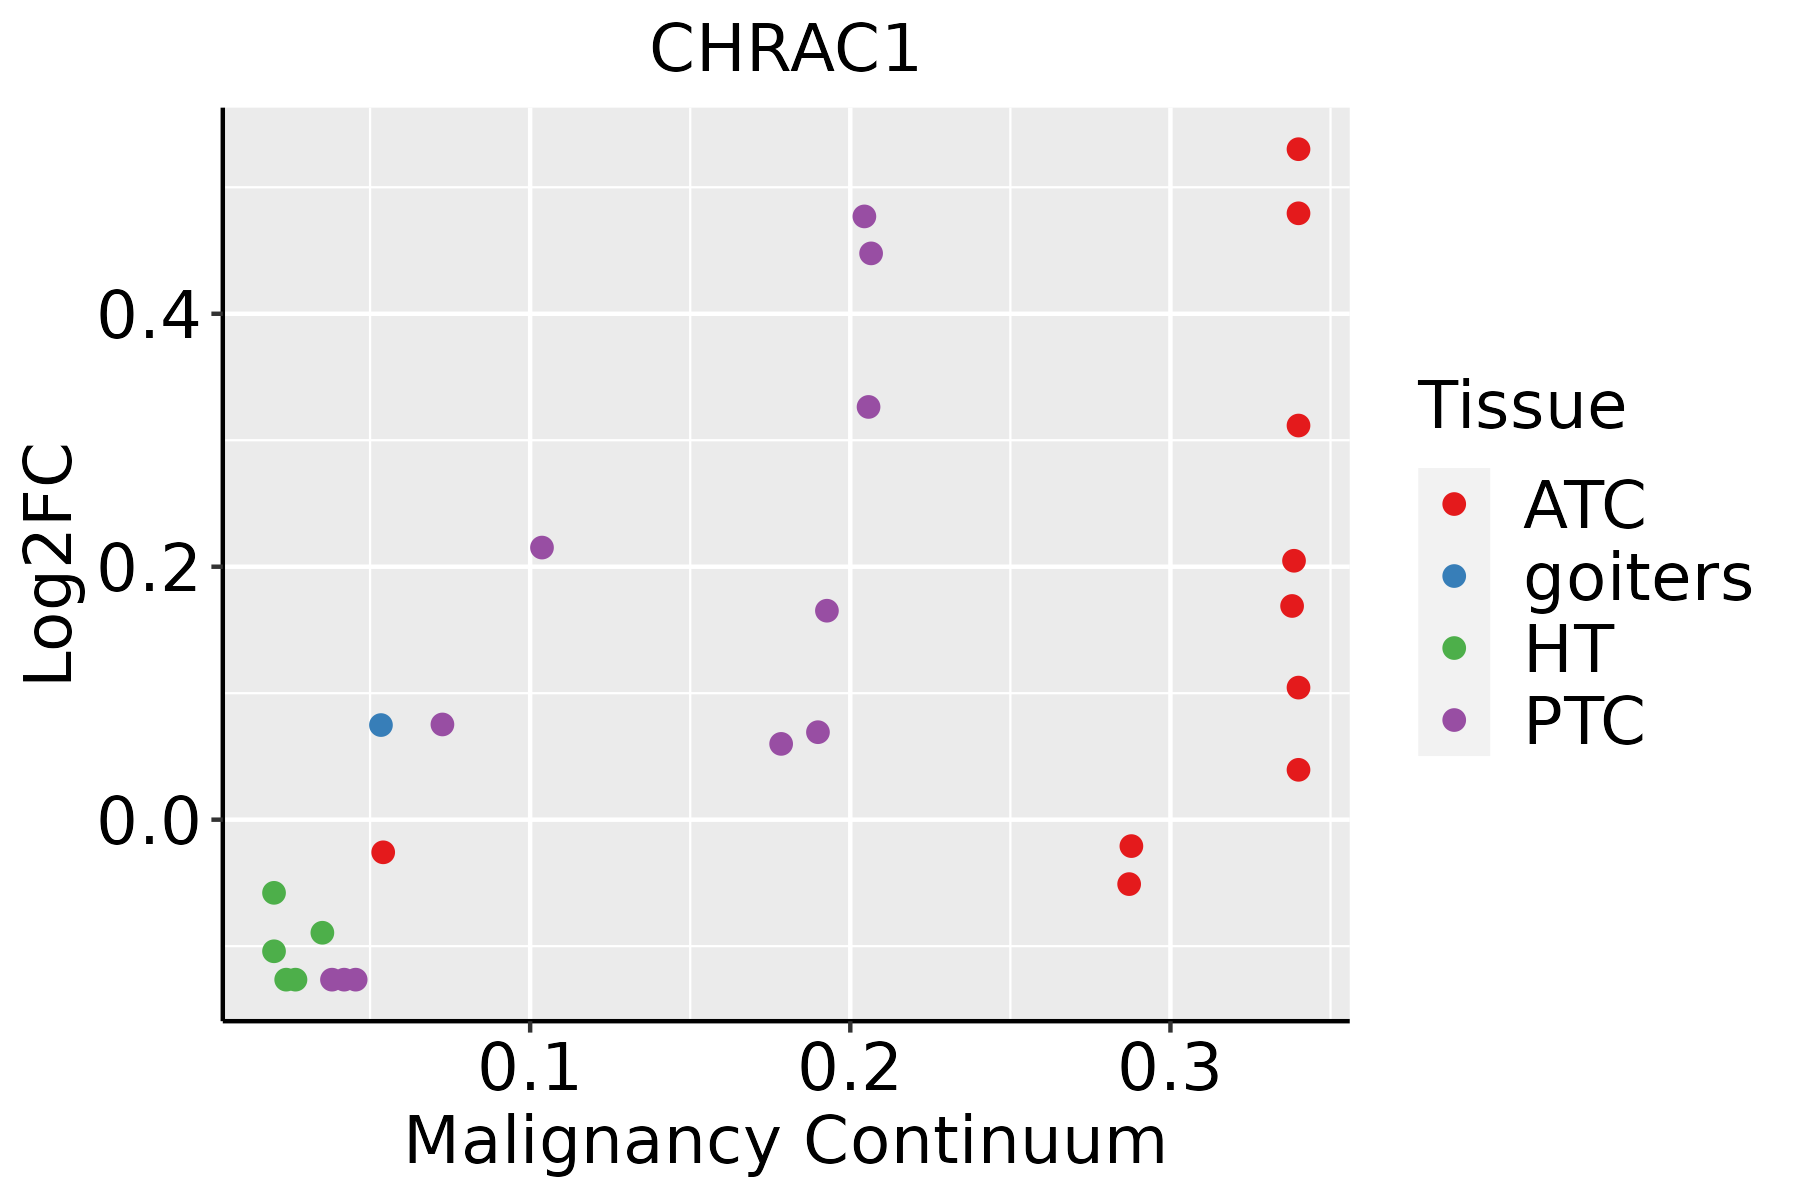 | ATC: Anaplastic thyroid cancer |
| HT: Hashimoto's thyroiditis | ||
| PTC: Papillary thyroid cancer |
| ∗log2FC in expression of this searched gene in stem-like cells from each diseased tissue sample relative to stem-like cells in normal samples in each tissue plotted against the malignancy continuum. Samples are colored based on if they are from different disease stage. |
Top |
Malignant transformation related pathway analysis |
| Find out the enriched GO biological processes and KEGG pathways involved in transition from healthy to precancer to cancer |
| Tissue | Disease Stage | Enriched GO biological Processes |
| Colorectum | AD |  |
| Colorectum | SER |  |
| Colorectum | MSS |  |
| Colorectum | MSI-H |  |
| Colorectum | FAP |  |
| ∗Top 15 enriched GO BP terms are showed in the bar plot of each disease state in each tissue. Each row represents a significant GO biological process which is colored according to the -log10(p.adjust). |
| Page: 1 2 3 4 5 6 7 8 9 |
| GO ID | Tissue | Disease Stage | Description | Gene Ratio | Bg Ratio | pvalue | p.adjust | Count |
| GO:0006325 | Colorectum | AD | chromatin organization | 119/3918 | 409/18723 | 4.85e-05 | 8.33e-04 | 119 |
| GO:0071897 | Colorectum | AD | DNA biosynthetic process | 55/3918 | 180/18723 | 1.46e-03 | 1.24e-02 | 55 |
| GO:0006338 | Colorectum | AD | chromatin remodeling | 70/3918 | 255/18723 | 7.44e-03 | 4.53e-02 | 70 |
| GO:00063251 | Colorectum | SER | chromatin organization | 89/2897 | 409/18723 | 4.15e-04 | 6.17e-03 | 89 |
| GO:00718971 | Colorectum | SER | DNA biosynthetic process | 43/2897 | 180/18723 | 1.99e-03 | 1.98e-02 | 43 |
| GO:00063252 | Colorectum | MSS | chromatin organization | 107/3467 | 409/18723 | 7.22e-05 | 1.21e-03 | 107 |
| GO:00718972 | Colorectum | MSS | DNA biosynthetic process | 50/3467 | 180/18723 | 1.45e-03 | 1.35e-02 | 50 |
| GO:00718973 | Colorectum | MSI-H | DNA biosynthetic process | 26/1319 | 180/18723 | 3.73e-04 | 8.56e-03 | 26 |
| GO:007189716 | Esophagus | ESCC | DNA biosynthetic process | 127/8552 | 180/18723 | 1.04e-11 | 3.85e-10 | 127 |
| GO:000632517 | Esophagus | ESCC | chromatin organization | 240/8552 | 409/18723 | 6.52e-08 | 1.14e-06 | 240 |
| GO:00718975 | Liver | HCC | DNA biosynthetic process | 99/7958 | 180/18723 | 4.66e-04 | 3.08e-03 | 99 |
| GO:000632511 | Liver | HCC | chromatin organization | 206/7958 | 409/18723 | 7.23e-04 | 4.41e-03 | 206 |
| GO:00718979 | Oral cavity | OSCC | DNA biosynthetic process | 106/7305 | 180/18723 | 4.86e-08 | 8.95e-07 | 106 |
| GO:000632510 | Oral cavity | OSCC | chromatin organization | 190/7305 | 409/18723 | 1.17e-03 | 5.97e-03 | 190 |
| GO:007189715 | Oral cavity | LP | DNA biosynthetic process | 71/4623 | 180/18723 | 8.04e-06 | 1.52e-04 | 71 |
| GO:000632519 | Skin | cSCC | chromatin organization | 147/4864 | 409/18723 | 4.41e-06 | 6.52e-05 | 147 |
| GO:007189718 | Skin | cSCC | DNA biosynthetic process | 74/4864 | 180/18723 | 6.33e-06 | 8.92e-05 | 74 |
| GO:000633812 | Skin | cSCC | chromatin remodeling | 94/4864 | 255/18723 | 7.58e-05 | 7.26e-04 | 94 |
| GO:000632520 | Thyroid | PTC | chromatin organization | 183/5968 | 409/18723 | 2.55e-08 | 5.70e-07 | 183 |
| GO:0071897110 | Thyroid | PTC | DNA biosynthetic process | 82/5968 | 180/18723 | 7.98e-05 | 6.81e-04 | 82 |
| Page: 1 2 |
| Pathway ID | Tissue | Disease Stage | Description | Gene Ratio | Bg Ratio | pvalue | p.adjust | qvalue | Count |
| Page: 1 |
Top |
Cell-cell communication analysis |
| Identification of potential cell-cell interactions between two cell types and their ligand-receptor pairs for different disease states |
| Ligand | Receptor | LRpair | Pathway | Tissue | Disease Stage |
| Page: 1 |
Top |
Single-cell gene regulatory network inference analysis |
| Find out the significant the regulons (TFs) and the target genes of each regulon across cell types for different disease states |
| TF | Cell Type | Tissue | Disease Stage | Target Gene | RSS | Regulon Activity |
| ∗The dot plots of a searched regulon are shown for all cell subpopulations in each disease state of each tissue based on the regulon specific score inferred using pySCENIC and by calculating the average expression. |
| Page: 1 |
Top |
Somatic mutation of malignant transformation related genes |
| Annotation of somatic variants for genes involved in malignant transformation |
| Hugo Symbol | Variant Class | Variant Classification | dbSNP RS | HGVSc | HGVSp | HGVSp Short | SWISSPROT | BIOTYPE | SIFT | PolyPhen | Tumor Sample Barcode | Tissue | Histology | Sex | Age | Stage | Therapy Types | Drugs | Outcome |
| CHRAC1 | SNV | Missense_Mutation | c.367N>C | p.Glu123Gln | p.E123Q | Q9NRG0 | protein_coding | tolerated_low_confidence(0.25) | benign(0.001) | TCGA-EK-A3GK-01 | Cervix | cervical & endocervical cancer | Female | <65 | I/II | Unknown | Unknown | SD | |
| CHRAC1 | SNV | Missense_Mutation | novel | c.80N>C | p.Ile27Thr | p.I27T | Q9NRG0 | protein_coding | deleterious(0.03) | probably_damaging(0.979) | TCGA-D5-6928-01 | Colorectum | colon adenocarcinoma | Male | >=65 | I/II | Unknown | Unknown | SD |
| CHRAC1 | insertion | Frame_Shift_Ins | novel | c.380_381insACACAGCAATGCACATT | p.Asp127GlufsTer17 | p.D127Efs*17 | Q9NRG0 | protein_coding | TCGA-AM-5820-01 | Colorectum | colon adenocarcinoma | Female | <65 | I/II | Unknown | Unknown | SD | ||
| CHRAC1 | SNV | Missense_Mutation | novel | c.121G>A | p.Ala41Thr | p.A41T | Q9NRG0 | protein_coding | deleterious(0.01) | possibly_damaging(0.626) | TCGA-A5-A1OF-01 | Endometrium | uterine corpus endometrioid carcinoma | Female | <65 | I/II | Unknown | Unknown | SD |
| CHRAC1 | SNV | Missense_Mutation | novel | c.351G>T | p.Glu117Asp | p.E117D | Q9NRG0 | protein_coding | tolerated(0.41) | benign(0) | TCGA-AJ-A5DW-01 | Endometrium | uterine corpus endometrioid carcinoma | Female | <65 | I/II | Unknown | Unknown | SD |
| CHRAC1 | SNV | Missense_Mutation | novel | c.359N>G | p.Asn120Ser | p.N120S | Q9NRG0 | protein_coding | tolerated(0.31) | benign(0) | TCGA-78-7146-01 | Lung | lung adenocarcinoma | Female | >=65 | III/IV | Unknown | Unknown | SD |
| CHRAC1 | SNV | Missense_Mutation | c.361N>C | p.Asp121His | p.D121H | Q9NRG0 | protein_coding | deleterious_low_confidence(0.03) | benign(0.102) | TCGA-F7-A624-01 | Oral cavity | head & neck squamous cell carcinoma | Male | >=65 | I/II | Unknown | Unknown | SD | |
| CHRAC1 | SNV | Missense_Mutation | c.361G>C | p.Asp121His | p.D121H | Q9NRG0 | protein_coding | deleterious_low_confidence(0.03) | benign(0.102) | TCGA-HC-8265-01 | Prostate | prostate adenocarcinoma | Male | >=65 | 8 | Unknown | Unknown | SD | |
| CHRAC1 | SNV | Missense_Mutation | c.215T>C | p.Leu72Pro | p.L72P | Q9NRG0 | protein_coding | deleterious(0) | probably_damaging(0.998) | TCGA-HU-A4GT-01 | Stomach | stomach adenocarcinoma | Female | >=65 | I/II | Chemotherapy | copolang | SD |
| Page: 1 |
Top |
Related drugs of malignant transformation related genes |
| Identification of chemicals and drugs interact with genes involved in malignant transfromation |
| (DGIdb 4.0) |
| Entrez ID | Symbol | Category | Interaction Types | Drug Claim Name | Drug Name | PMIDs |
| Page: 1 |

Copyright 2023-Present -The University of Texas Health Science Center at Houston |