
|
|||||
|
 | |
| |
| |
| |
| |
| |
|
Gene: CHPT1 |
Gene summary for CHPT1 |
| Gene information | Species | Human | Gene symbol | CHPT1 | Gene ID | 56994 |
| Gene name | choline phosphotransferase 1 | |
| Gene Alias | CPT | |
| Cytomap | 12q23.2 | |
| Gene Type | protein-coding | GO ID | GO:0001558 | UniProtAcc | Q8WUD6 |
Top |
Malignant transformation analysis |
| Identification of the aberrant gene expression in precancerous and cancerous lesions by comparing the gene expression of stem-like cells in diseased tissues with normal stem cells |
| Entrez ID | Symbol | Replicates | Species | Organ | Tissue | Adj P-value | Log2FC | Malignancy |
| 56994 | CHPT1 | GSM4909282 | Human | Breast | IDC | 3.44e-11 | 4.08e-01 | -0.0288 |
| 56994 | CHPT1 | GSM4909285 | Human | Breast | IDC | 1.34e-04 | -2.58e-01 | 0.21 |
| 56994 | CHPT1 | GSM4909290 | Human | Breast | IDC | 1.40e-08 | -4.18e-01 | 0.2096 |
| 56994 | CHPT1 | GSM4909291 | Human | Breast | IDC | 1.05e-14 | -5.27e-01 | 0.1753 |
| 56994 | CHPT1 | GSM4909292 | Human | Breast | IDC | 8.14e-04 | -5.63e-01 | 0.1236 |
| 56994 | CHPT1 | GSM4909293 | Human | Breast | IDC | 8.71e-20 | 5.62e-01 | 0.1581 |
| 56994 | CHPT1 | GSM4909294 | Human | Breast | IDC | 1.43e-08 | -4.04e-01 | 0.2022 |
| 56994 | CHPT1 | GSM4909296 | Human | Breast | IDC | 1.24e-06 | -3.69e-01 | 0.1524 |
| 56994 | CHPT1 | GSM4909297 | Human | Breast | IDC | 1.60e-12 | -4.00e-01 | 0.1517 |
| 56994 | CHPT1 | GSM4909301 | Human | Breast | IDC | 6.15e-10 | -3.92e-01 | 0.1577 |
| 56994 | CHPT1 | GSM4909304 | Human | Breast | IDC | 1.53e-35 | 6.68e-01 | 0.1636 |
| 56994 | CHPT1 | GSM4909307 | Human | Breast | IDC | 2.37e-07 | -4.21e-01 | 0.1569 |
| 56994 | CHPT1 | GSM4909308 | Human | Breast | IDC | 2.98e-11 | -4.16e-01 | 0.158 |
| 56994 | CHPT1 | GSM4909309 | Human | Breast | IDC | 1.18e-03 | -2.70e-01 | 0.0483 |
| 56994 | CHPT1 | GSM4909311 | Human | Breast | IDC | 2.93e-24 | -4.29e-01 | 0.1534 |
| 56994 | CHPT1 | GSM4909312 | Human | Breast | IDC | 2.23e-07 | -3.50e-01 | 0.1552 |
| 56994 | CHPT1 | GSM4909315 | Human | Breast | IDC | 1.36e-20 | -5.34e-01 | 0.21 |
| 56994 | CHPT1 | GSM4909316 | Human | Breast | IDC | 2.71e-08 | -5.41e-01 | 0.21 |
| 56994 | CHPT1 | GSM4909317 | Human | Breast | IDC | 1.15e-11 | -4.36e-01 | 0.1355 |
| 56994 | CHPT1 | GSM4909319 | Human | Breast | IDC | 2.69e-29 | -4.56e-01 | 0.1563 |
| Page: 1 2 3 4 5 6 7 8 9 |
| Tissue | Expression Dynamics | Abbreviation |
| Breast | 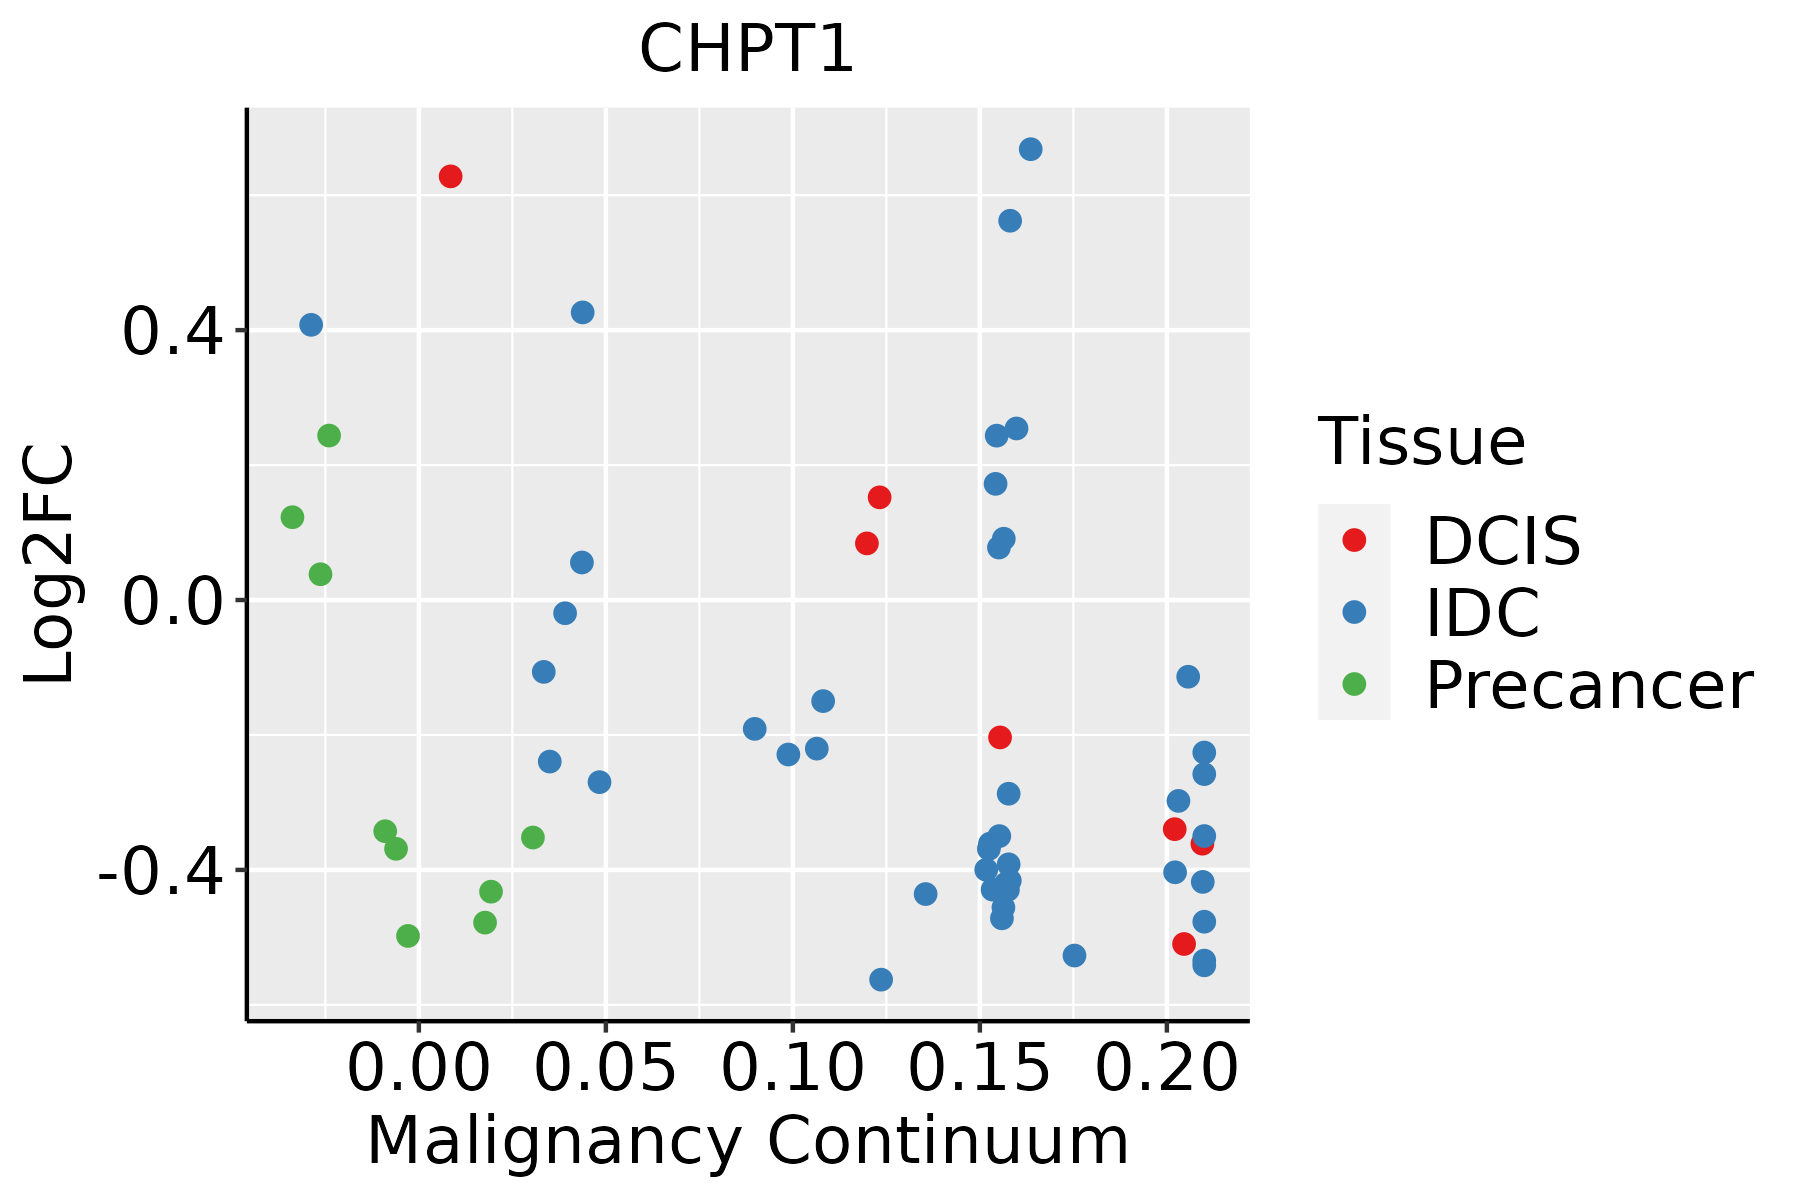 | IDC: Invasive ductal carcinoma |
| DCIS: Ductal carcinoma in situ | ||
| Precancer(BRCA1-mut): Precancerous lesion from BRCA1 mutation carriers | ||
| Colorectum (GSE201348) |  | FAP: Familial adenomatous polyposis |
| CRC: Colorectal cancer | ||
| Colorectum (HTA11) |  | AD: Adenomas |
| SER: Sessile serrated lesions | ||
| MSI-H: Microsatellite-high colorectal cancer | ||
| MSS: Microsatellite stable colorectal cancer | ||
| Esophagus | 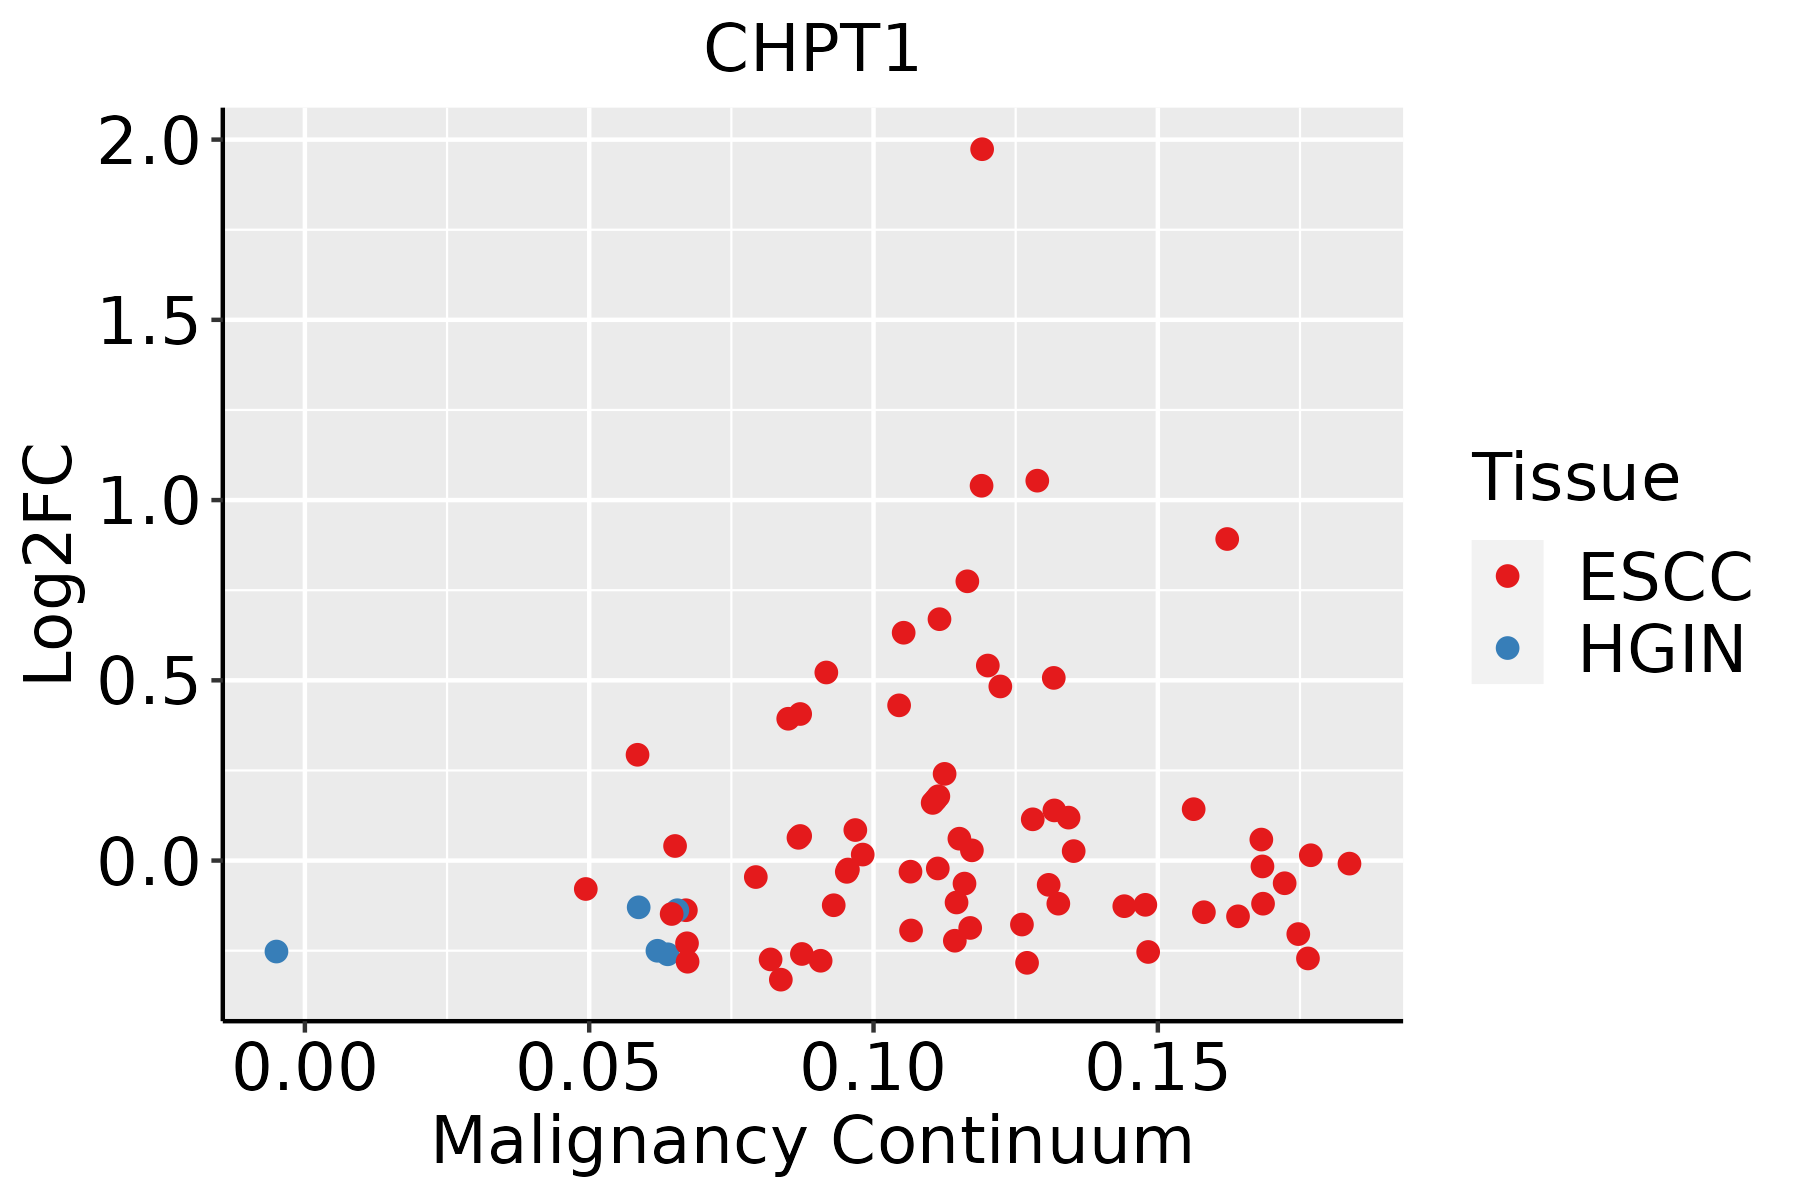 | ESCC: Esophageal squamous cell carcinoma |
| HGIN: High-grade intraepithelial neoplasias | ||
| LGIN: Low-grade intraepithelial neoplasias | ||
| Liver | 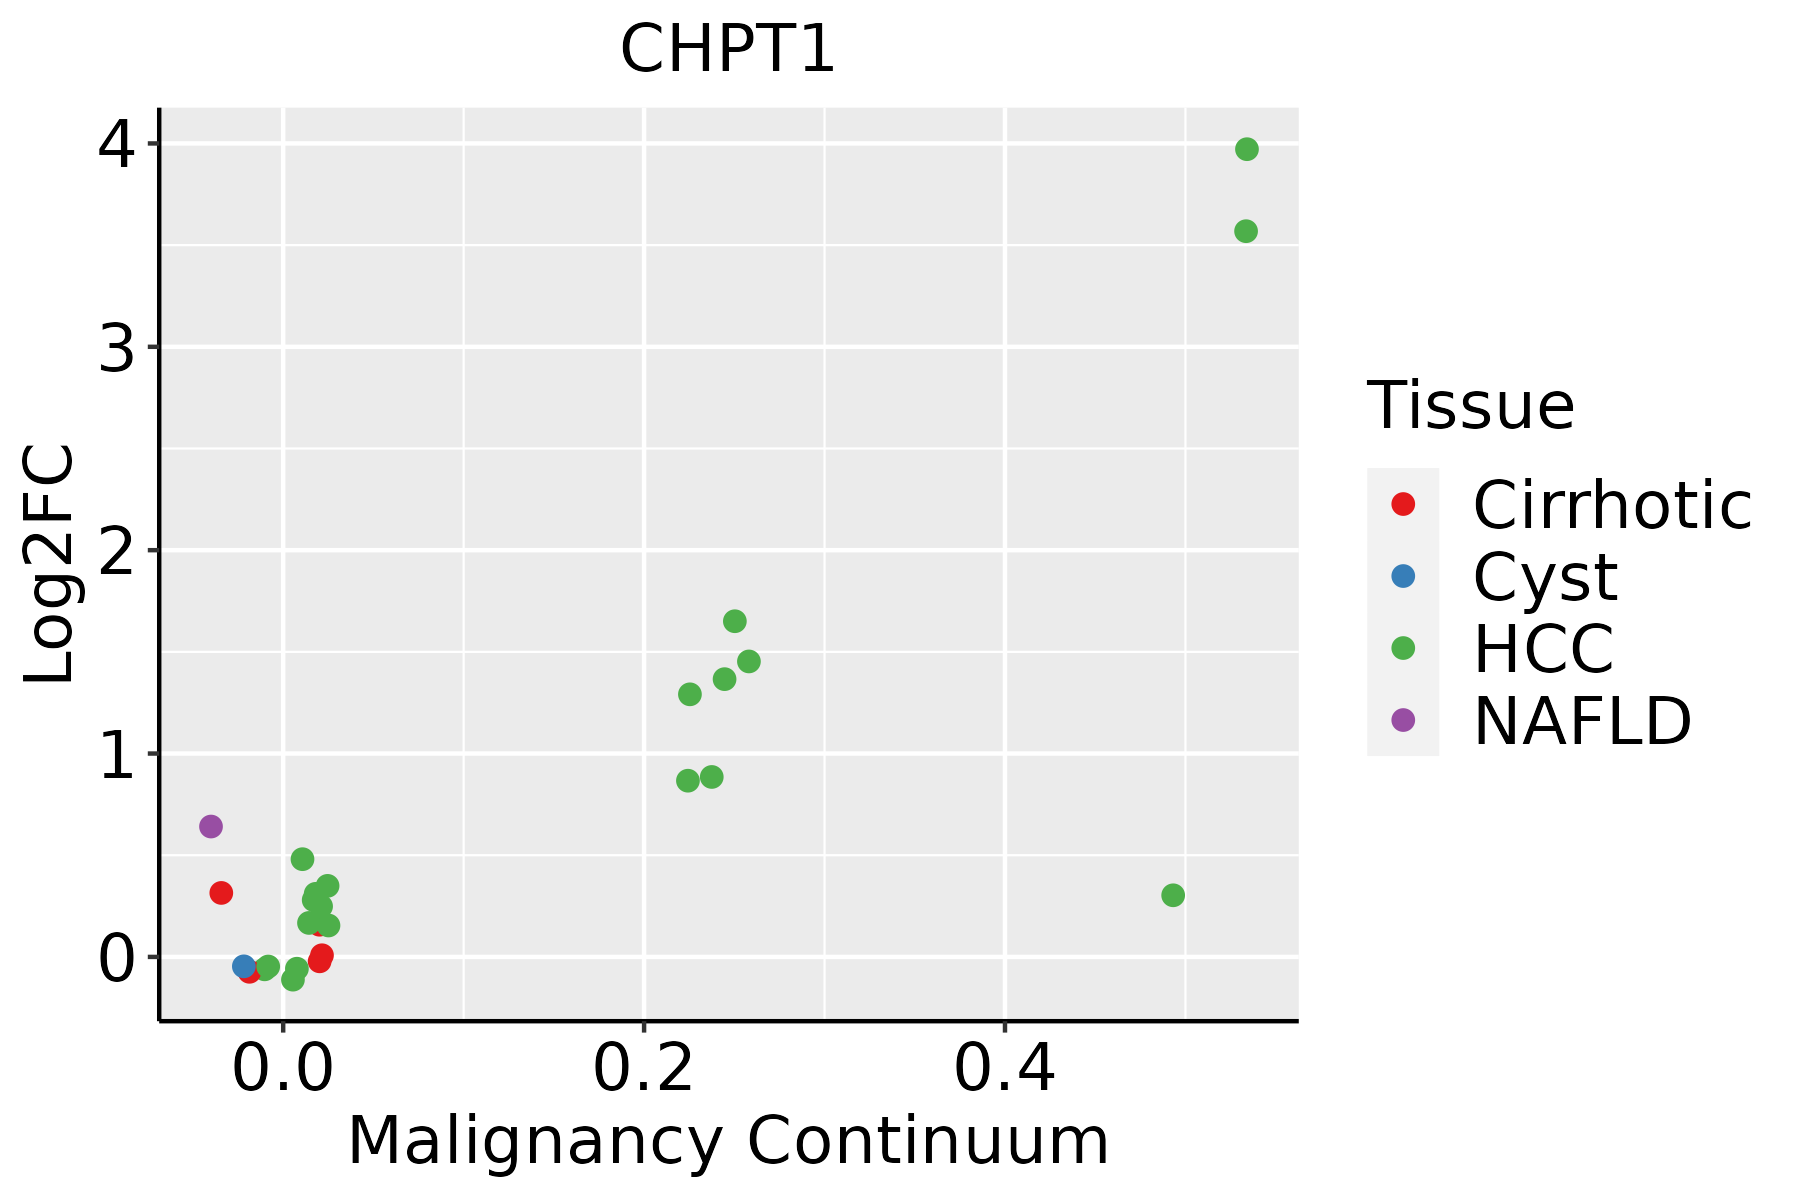 | HCC: Hepatocellular carcinoma |
| NAFLD: Non-alcoholic fatty liver disease | ||
| Lung |  | AAH: Atypical adenomatous hyperplasia |
| AIS: Adenocarcinoma in situ | ||
| IAC: Invasive lung adenocarcinoma | ||
| MIA: Minimally invasive adenocarcinoma | ||
| Oral Cavity |  | EOLP: Erosive Oral lichen planus |
| LP: leukoplakia | ||
| NEOLP: Non-erosive oral lichen planus | ||
| OSCC: Oral squamous cell carcinoma | ||
| Prostate |  | BPH: Benign Prostatic Hyperplasia |
| Thyroid |  | ATC: Anaplastic thyroid cancer |
| HT: Hashimoto's thyroiditis | ||
| PTC: Papillary thyroid cancer |
| ∗log2FC in expression of this searched gene in stem-like cells from each diseased tissue sample relative to stem-like cells in normal samples in each tissue plotted against the malignancy continuum. Samples are colored based on if they are from different disease stage. |
Top |
Malignant transformation related pathway analysis |
| Find out the enriched GO biological processes and KEGG pathways involved in transition from healthy to precancer to cancer |
| Tissue | Disease Stage | Enriched GO biological Processes |
| Colorectum | AD |  |
| Colorectum | SER |  |
| Colorectum | MSS |  |
| Colorectum | MSI-H |  |
| Colorectum | FAP |  |
| ∗Top 15 enriched GO BP terms are showed in the bar plot of each disease state in each tissue. Each row represents a significant GO biological process which is colored according to the -log10(p.adjust). |
| Page: 1 2 3 4 5 6 7 8 9 |
| GO ID | Tissue | Disease Stage | Description | Gene Ratio | Bg Ratio | pvalue | p.adjust | Count |
| GO:00160497 | Breast | Precancer | cell growth | 46/1080 | 482/18723 | 5.63e-04 | 7.16e-03 | 46 |
| GO:00015587 | Breast | Precancer | regulation of cell growth | 39/1080 | 414/18723 | 1.81e-03 | 1.78e-02 | 39 |
| GO:001604913 | Breast | IDC | cell growth | 56/1434 | 482/18723 | 1.16e-03 | 1.26e-02 | 56 |
| GO:000155813 | Breast | IDC | regulation of cell growth | 49/1434 | 414/18723 | 1.55e-03 | 1.55e-02 | 49 |
| GO:001604923 | Breast | DCIS | cell growth | 54/1390 | 482/18723 | 1.60e-03 | 1.59e-02 | 54 |
| GO:000155822 | Breast | DCIS | regulation of cell growth | 47/1390 | 414/18723 | 2.39e-03 | 2.16e-02 | 47 |
| GO:0016049 | Colorectum | AD | cell growth | 143/3918 | 482/18723 | 2.83e-06 | 8.09e-05 | 143 |
| GO:0001558 | Colorectum | AD | regulation of cell growth | 124/3918 | 414/18723 | 7.67e-06 | 1.86e-04 | 124 |
| GO:0018904 | Colorectum | AD | ether metabolic process | 14/3918 | 27/18723 | 3.72e-04 | 4.29e-03 | 14 |
| GO:0006662 | Colorectum | AD | glycerol ether metabolic process | 12/3918 | 22/18723 | 5.38e-04 | 5.74e-03 | 12 |
| GO:0046485 | Colorectum | AD | ether lipid metabolic process | 10/3918 | 20/18723 | 3.67e-03 | 2.60e-02 | 10 |
| GO:0006650 | Colorectum | AD | glycerophospholipid metabolic process | 83/3918 | 306/18723 | 5.40e-03 | 3.55e-02 | 83 |
| GO:0006644 | Colorectum | AD | phospholipid metabolic process | 101/3918 | 383/18723 | 5.80e-03 | 3.67e-02 | 101 |
| GO:0045017 | Colorectum | AD | glycerolipid biosynthetic process | 69/3918 | 252/18723 | 8.33e-03 | 4.88e-02 | 69 |
| GO:00015581 | Colorectum | SER | regulation of cell growth | 90/2897 | 414/18723 | 4.00e-04 | 6.02e-03 | 90 |
| GO:00160491 | Colorectum | SER | cell growth | 100/2897 | 482/18723 | 1.07e-03 | 1.24e-02 | 100 |
| GO:0046486 | Colorectum | SER | glycerolipid metabolic process | 82/2897 | 392/18723 | 2.26e-03 | 2.17e-02 | 82 |
| GO:00066621 | Colorectum | SER | glycerol ether metabolic process | 9/2897 | 22/18723 | 3.66e-03 | 3.06e-02 | 9 |
| GO:00066441 | Colorectum | SER | phospholipid metabolic process | 79/2897 | 383/18723 | 3.94e-03 | 3.24e-02 | 79 |
| GO:00450171 | Colorectum | SER | glycerolipid biosynthetic process | 55/2897 | 252/18723 | 4.47e-03 | 3.56e-02 | 55 |
| Page: 1 2 3 4 5 |
| Pathway ID | Tissue | Disease Stage | Description | Gene Ratio | Bg Ratio | pvalue | p.adjust | qvalue | Count |
| hsa05231 | Colorectum | MSS | Choline metabolism in cancer | 34/1875 | 98/8465 | 2.90e-03 | 1.39e-02 | 8.50e-03 | 34 |
| hsa052311 | Colorectum | MSS | Choline metabolism in cancer | 34/1875 | 98/8465 | 2.90e-03 | 1.39e-02 | 8.50e-03 | 34 |
| hsa052319 | Esophagus | ESCC | Choline metabolism in cancer | 61/4205 | 98/8465 | 7.97e-03 | 1.92e-02 | 9.84e-03 | 61 |
| hsa0523114 | Esophagus | ESCC | Choline metabolism in cancer | 61/4205 | 98/8465 | 7.97e-03 | 1.92e-02 | 9.84e-03 | 61 |
| hsa052316 | Liver | HCC | Choline metabolism in cancer | 57/4020 | 98/8465 | 2.14e-02 | 4.90e-02 | 2.72e-02 | 57 |
| hsa0523111 | Liver | HCC | Choline metabolism in cancer | 57/4020 | 98/8465 | 2.14e-02 | 4.90e-02 | 2.72e-02 | 57 |
| hsa0523121 | Lung | AIS | Choline metabolism in cancer | 23/961 | 98/8465 | 4.87e-04 | 4.39e-03 | 2.81e-03 | 23 |
| hsa0523131 | Lung | AIS | Choline metabolism in cancer | 23/961 | 98/8465 | 4.87e-04 | 4.39e-03 | 2.81e-03 | 23 |
| Page: 1 |
Top |
Cell-cell communication analysis |
| Identification of potential cell-cell interactions between two cell types and their ligand-receptor pairs for different disease states |
| Ligand | Receptor | LRpair | Pathway | Tissue | Disease Stage |
| Page: 1 |
Top |
Single-cell gene regulatory network inference analysis |
| Find out the significant the regulons (TFs) and the target genes of each regulon across cell types for different disease states |
| TF | Cell Type | Tissue | Disease Stage | Target Gene | RSS | Regulon Activity |
| ∗The dot plots of a searched regulon are shown for all cell subpopulations in each disease state of each tissue based on the regulon specific score inferred using pySCENIC and by calculating the average expression. |
| Page: 1 |
Top |
Somatic mutation of malignant transformation related genes |
| Annotation of somatic variants for genes involved in malignant transformation |
| Hugo Symbol | Variant Class | Variant Classification | dbSNP RS | HGVSc | HGVSp | HGVSp Short | SWISSPROT | BIOTYPE | SIFT | PolyPhen | Tumor Sample Barcode | Tissue | Histology | Sex | Age | Stage | Therapy Types | Drugs | Outcome |
| CHPT1 | SNV | Missense_Mutation | c.874N>C | p.Lys292Gln | p.K292Q | Q8WUD6 | protein_coding | tolerated(0.23) | benign(0.058) | TCGA-A2-A25E-01 | Breast | breast invasive carcinoma | Female | <65 | III/IV | Chemotherapy | cytoxan | PD | |
| CHPT1 | SNV | Missense_Mutation | c.677N>G | p.Ile226Ser | p.I226S | Q8WUD6 | protein_coding | tolerated(0.13) | benign(0.017) | TCGA-AC-A23H-01 | Breast | breast invasive carcinoma | Female | >=65 | I/II | Unknown | Unknown | PD | |
| CHPT1 | SNV | Missense_Mutation | c.1000C>G | p.Leu334Val | p.L334V | Q8WUD6 | protein_coding | deleterious(0.01) | possibly_damaging(0.844) | TCGA-E2-A1LG-01 | Breast | breast invasive carcinoma | Female | <65 | I/II | Chemotherapy | doxorubicin | SD | |
| CHPT1 | SNV | Missense_Mutation | c.356G>A | p.Arg119Lys | p.R119K | Q8WUD6 | protein_coding | deleterious(0) | probably_damaging(0.999) | TCGA-MA-AA3W-01 | Cervix | cervical & endocervical cancer | Female | <65 | I/II | Chemotherapy | cisplatin | CR | |
| CHPT1 | SNV | Missense_Mutation | novel | c.1040N>G | p.Glu347Gly | p.E347G | Q8WUD6 | protein_coding | deleterious(0) | probably_damaging(1) | TCGA-CA-6717-01 | Colorectum | colon adenocarcinoma | Male | <65 | I/II | Chemotherapy | oxaliplatin | CR |
| CHPT1 | SNV | Missense_Mutation | novel | c.1165N>A | p.Ala389Thr | p.A389T | Q8WUD6 | protein_coding | tolerated(0.13) | benign(0.035) | TCGA-AG-A002-01 | Colorectum | rectum adenocarcinoma | Male | <65 | I/II | Unknown | Unknown | SD |
| CHPT1 | SNV | Missense_Mutation | novel | c.956N>G | p.Lys319Arg | p.K319R | Q8WUD6 | protein_coding | tolerated(0.15) | possibly_damaging(0.523) | TCGA-F5-6814-01 | Colorectum | rectum adenocarcinoma | Male | <65 | I/II | Unknown | Unknown | SD |
| CHPT1 | insertion | Frame_Shift_Ins | rs781571380 | c.485dupT | p.Cys163LeufsTer31 | p.C163Lfs*31 | Q8WUD6 | protein_coding | TCGA-G4-6628-01 | Colorectum | colon adenocarcinoma | Male | >=65 | I/II | Unknown | Unknown | SD | ||
| CHPT1 | SNV | Missense_Mutation | novel | c.908G>A | p.Cys303Tyr | p.C303Y | Q8WUD6 | protein_coding | deleterious(0.02) | benign(0.065) | TCGA-A5-A0G2-01 | Endometrium | uterine corpus endometrioid carcinoma | Female | <65 | III/IV | Unknown | Unknown | SD |
| CHPT1 | SNV | Missense_Mutation | novel | c.389N>A | p.Leu130His | p.L130H | Q8WUD6 | protein_coding | deleterious(0) | probably_damaging(0.998) | TCGA-AJ-A3EK-01 | Endometrium | uterine corpus endometrioid carcinoma | Female | <65 | I/II | Chemotherapy | carboplatin | CR |
| Page: 1 2 3 |
Top |
Related drugs of malignant transformation related genes |
| Identification of chemicals and drugs interact with genes involved in malignant transfromation |
| (DGIdb 4.0) |
| Entrez ID | Symbol | Category | Interaction Types | Drug Claim Name | Drug Name | PMIDs |
| 56994 | CHPT1 | NA | lamivudine | LAMIVUDINE |
| Page: 1 |

Copyright 2023-Present -The University of Texas Health Science Center at Houston |