Schematic overview of the cellular and molecular mechanisms involved in the cancer progression, including the proposed cellular and molecular mechanisms in cancer cells trajectory. AT1: alveolar type 1 cells; AT2: alveolar type 2 cells; AAH: atypical adenomatous hyperplasia; AIS: adenocarcinoma in situ; MIA: minimally invasive adenocarcinoma; IA: invasive adenocarcinoma; EMT: epithelial-mesenchymal transition

Home

Download

Statistics

Help

Contact

Center for Computational Systems Medicine
leaf

Gene summary

leaf

Malignant transformation analysis

leaf

Malignant transformation related pathway analysis

leaf

Cell-cell communication analysis

leaf

Single-cell gene regulatory network inference analysis

leaf

Somatic mutation of malignant transformation related genes

leaf

Related drugs of malignant transformation related genes

Gene: CHP1

Gene summary for CHP1

check button Gene summary.

Gene informationSpeciesHuman
Gene symbol

CHP1

Gene ID

11261

Gene namecalcineurin like EF-hand protein 1
Gene AliasCHP
Cytomap15q15.1
Gene Typeprotein-coding
GO ID

GO:0000226

UniProtAcc

A0A024R9M9


Top

Malignant transformation analysis

check button Identification of the aberrant gene expression in precancerous and cancerous lesions by comparing the gene expression of stem-like cells in diseased tissues with normal stem cells
check button Malignant transformation involving gene list.
Entrez IDSymbolReplicatesSpeciesOrganTissueAdj P-valueLog2FCMalignancy
11261CHP1HTA11_2487_2000001011HumanColorectumSER1.25e-141.05e+00-0.1808
11261CHP1HTA11_1938_2000001011HumanColorectumAD5.03e-231.20e+00-0.0811
11261CHP1HTA11_78_2000001011HumanColorectumAD3.63e-151.16e+00-0.1088
11261CHP1HTA11_347_2000001011HumanColorectumAD5.05e-481.51e+00-0.1954
11261CHP1HTA11_411_2000001011HumanColorectumSER1.01e-081.19e+00-0.2602
11261CHP1HTA11_2112_2000001011HumanColorectumSER5.65e-051.02e+00-0.2196
11261CHP1HTA11_3361_2000001011HumanColorectumAD1.01e-057.53e-01-0.1207
11261CHP1HTA11_83_2000001011HumanColorectumSER6.51e-201.17e+00-0.1526
11261CHP1HTA11_696_2000001011HumanColorectumAD7.53e-198.81e-01-0.1464
11261CHP1HTA11_866_2000001011HumanColorectumAD1.29e-075.82e-01-0.1001
11261CHP1HTA11_1391_2000001011HumanColorectumAD3.21e-221.24e+00-0.059
11261CHP1HTA11_2992_2000001011HumanColorectumSER1.66e-091.12e+00-0.1706
11261CHP1HTA11_5212_2000001011HumanColorectumAD5.49e-191.34e+00-0.2061
11261CHP1HTA11_5216_2000001011HumanColorectumSER2.25e-051.12e+00-0.1462
11261CHP1HTA11_7862_2000001011HumanColorectumAD4.89e-036.70e-01-0.0179
11261CHP1HTA11_6801_2000001011HumanColorectumSER4.19e-037.88e-010.0171
11261CHP1HTA11_99999970781_79442HumanColorectumMSS2.87e-044.29e-010.294
11261CHP1HTA11_99999965062_69753HumanColorectumMSI-H1.07e-031.03e+000.3487
11261CHP1F007HumanColorectumFAP1.75e-09-5.24e-010.1176
11261CHP1A001-C-207HumanColorectumFAP7.17e-07-3.74e-010.1278
Page: 1 2 3 4 5 6 7 8 9 

check button Transcriptomic changes along malignancy continuum.
TissueExpression DynamicsAbbreviation
Colorectum (GSE201348)The image shows the transcriptomic changes along malignancy continuum.log2FC in expression of this searched gene in stem-like cells from each diseased tissue sample relative to stem-like cells in normal samples in each tissue plotted against the malignancy continuum. Samples are colored based on if they are from different disease stage.FAP: Familial adenomatous polyposis
CRC: Colorectal cancer
Colorectum (HTA11)The image shows the transcriptomic changes along malignancy continuum.log2FC in expression of this searched gene in stem-like cells from each diseased tissue sample relative to stem-like cells in normal samples in each tissue plotted against the malignancy continuum. Samples are colored based on if they are from different disease stage.AD: Adenomas
SER: Sessile serrated lesions
MSI-H: Microsatellite-high colorectal cancer
MSS: Microsatellite stable colorectal cancer
EsophagusThe image shows the transcriptomic changes along malignancy continuum.log2FC in expression of this searched gene in stem-like cells from each diseased tissue sample relative to stem-like cells in normal samples in each tissue plotted against the malignancy continuum. Samples are colored based on if they are from different disease stage.
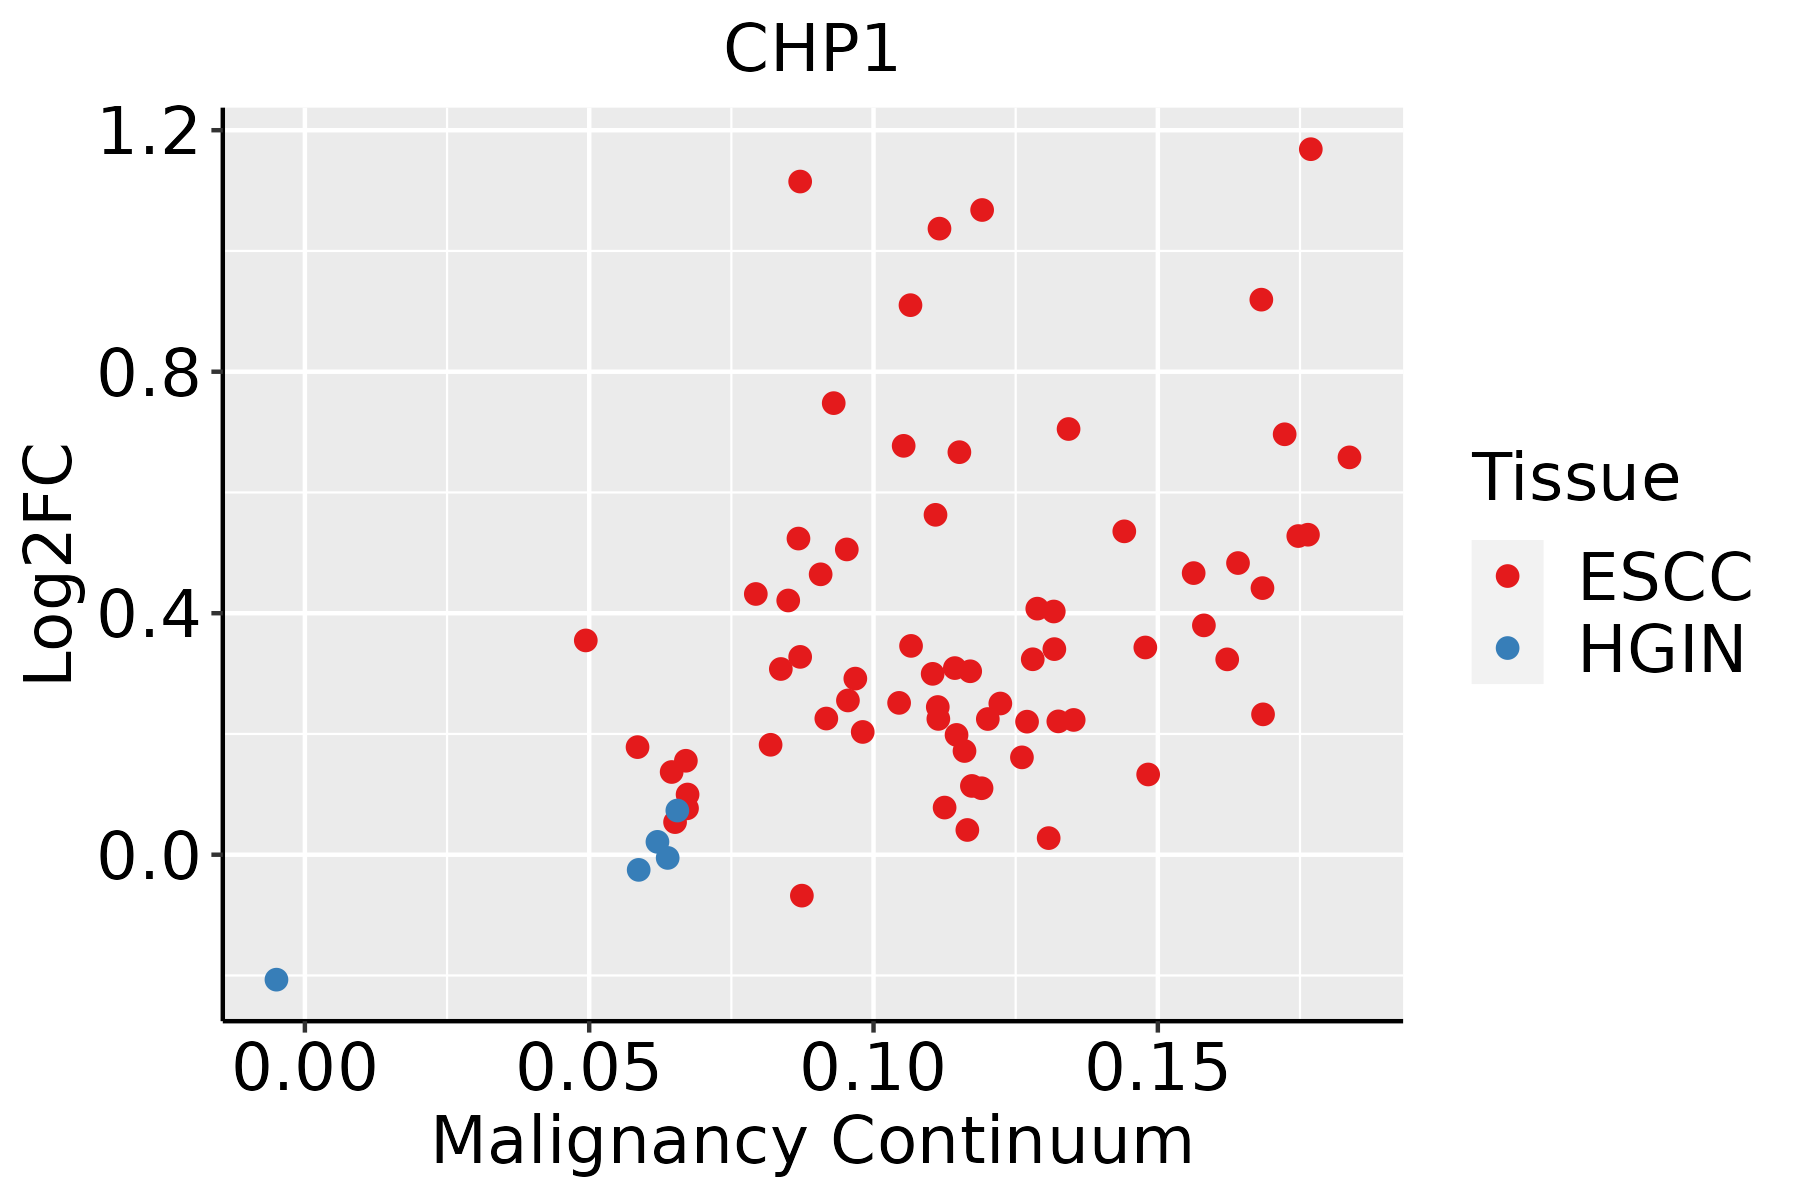
ESCC: Esophageal squamous cell carcinoma
HGIN: High-grade intraepithelial neoplasias
LGIN: Low-grade intraepithelial neoplasias
LiverThe image shows the transcriptomic changes along malignancy continuum.log2FC in expression of this searched gene in stem-like cells from each diseased tissue sample relative to stem-like cells in normal samples in each tissue plotted against the malignancy continuum. Samples are colored based on if they are from different disease stage.
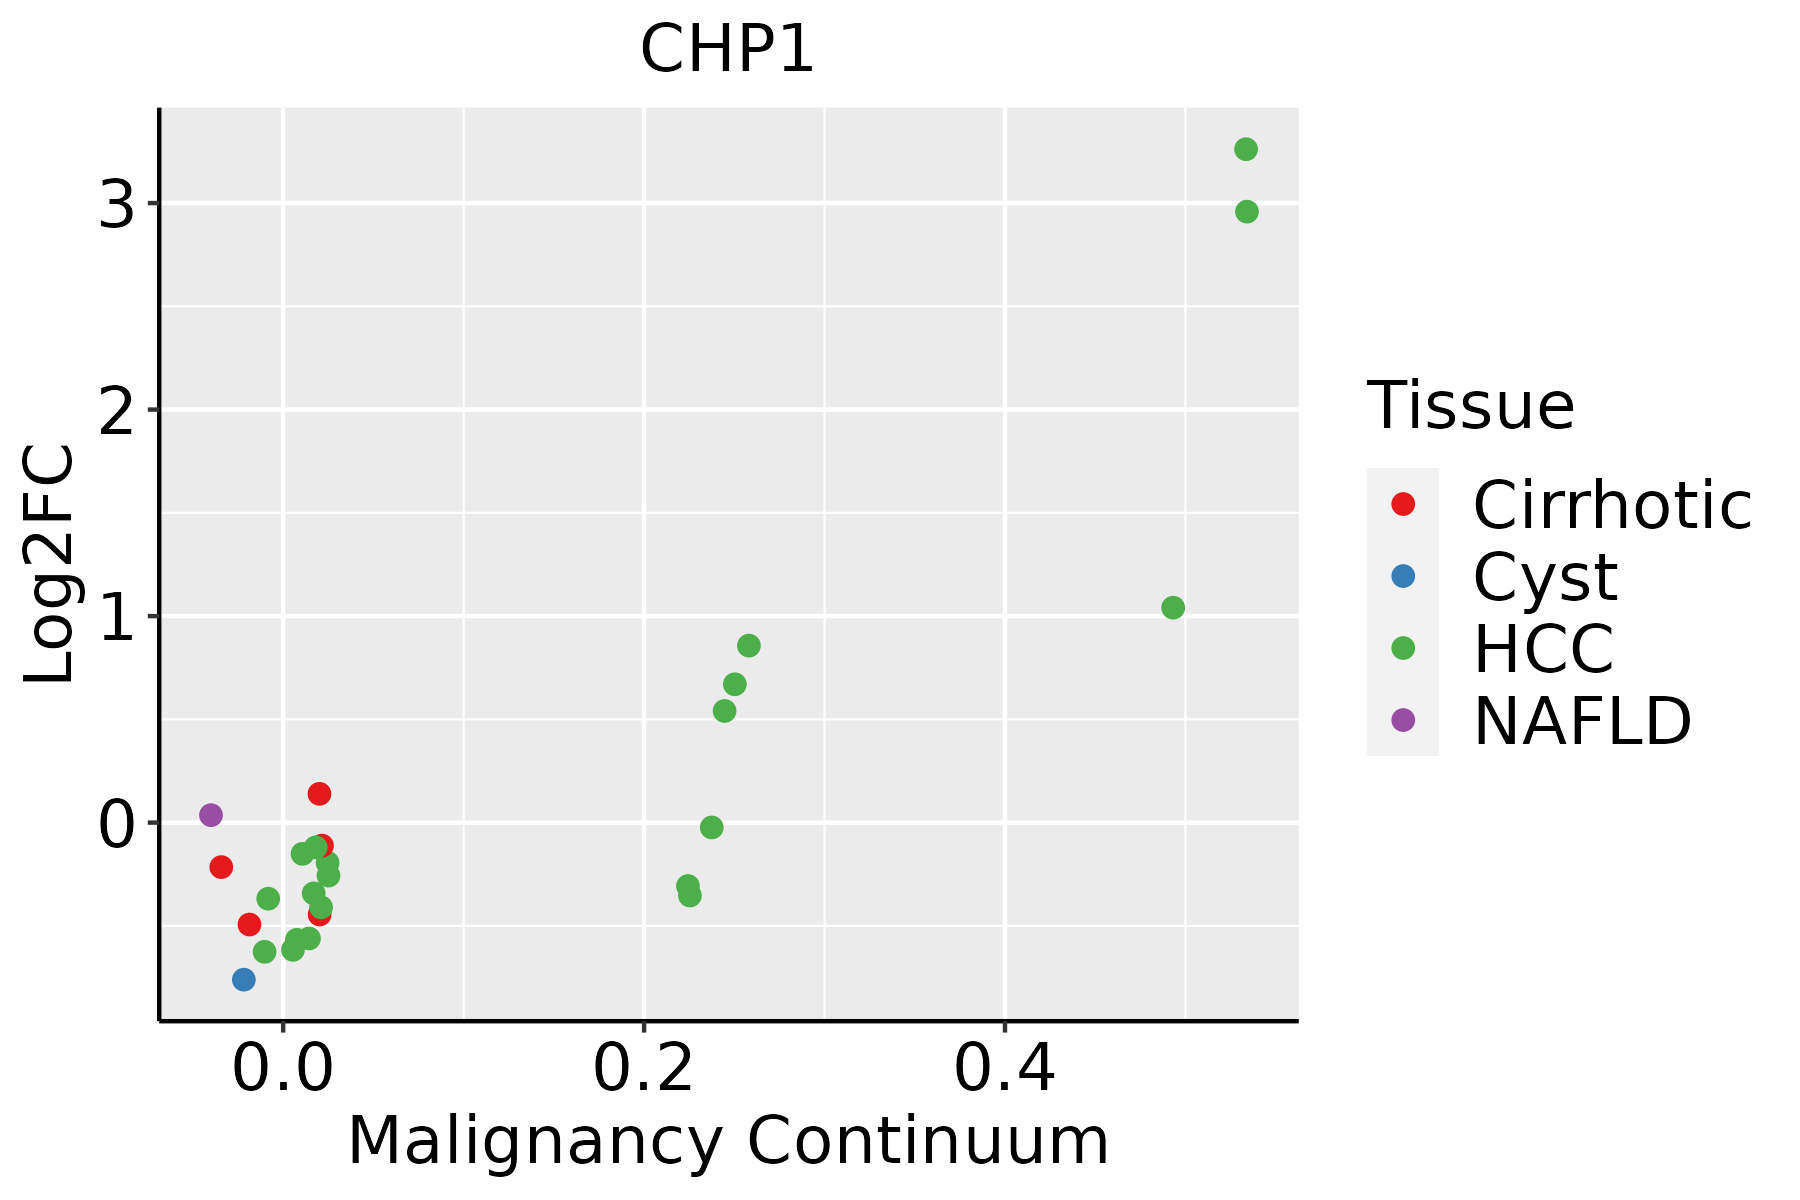
HCC: Hepatocellular carcinoma
NAFLD: Non-alcoholic fatty liver disease
Oral CavityThe image shows the transcriptomic changes along malignancy continuum.log2FC in expression of this searched gene in stem-like cells from each diseased tissue sample relative to stem-like cells in normal samples in each tissue plotted against the malignancy continuum. Samples are colored based on if they are from different disease stage.
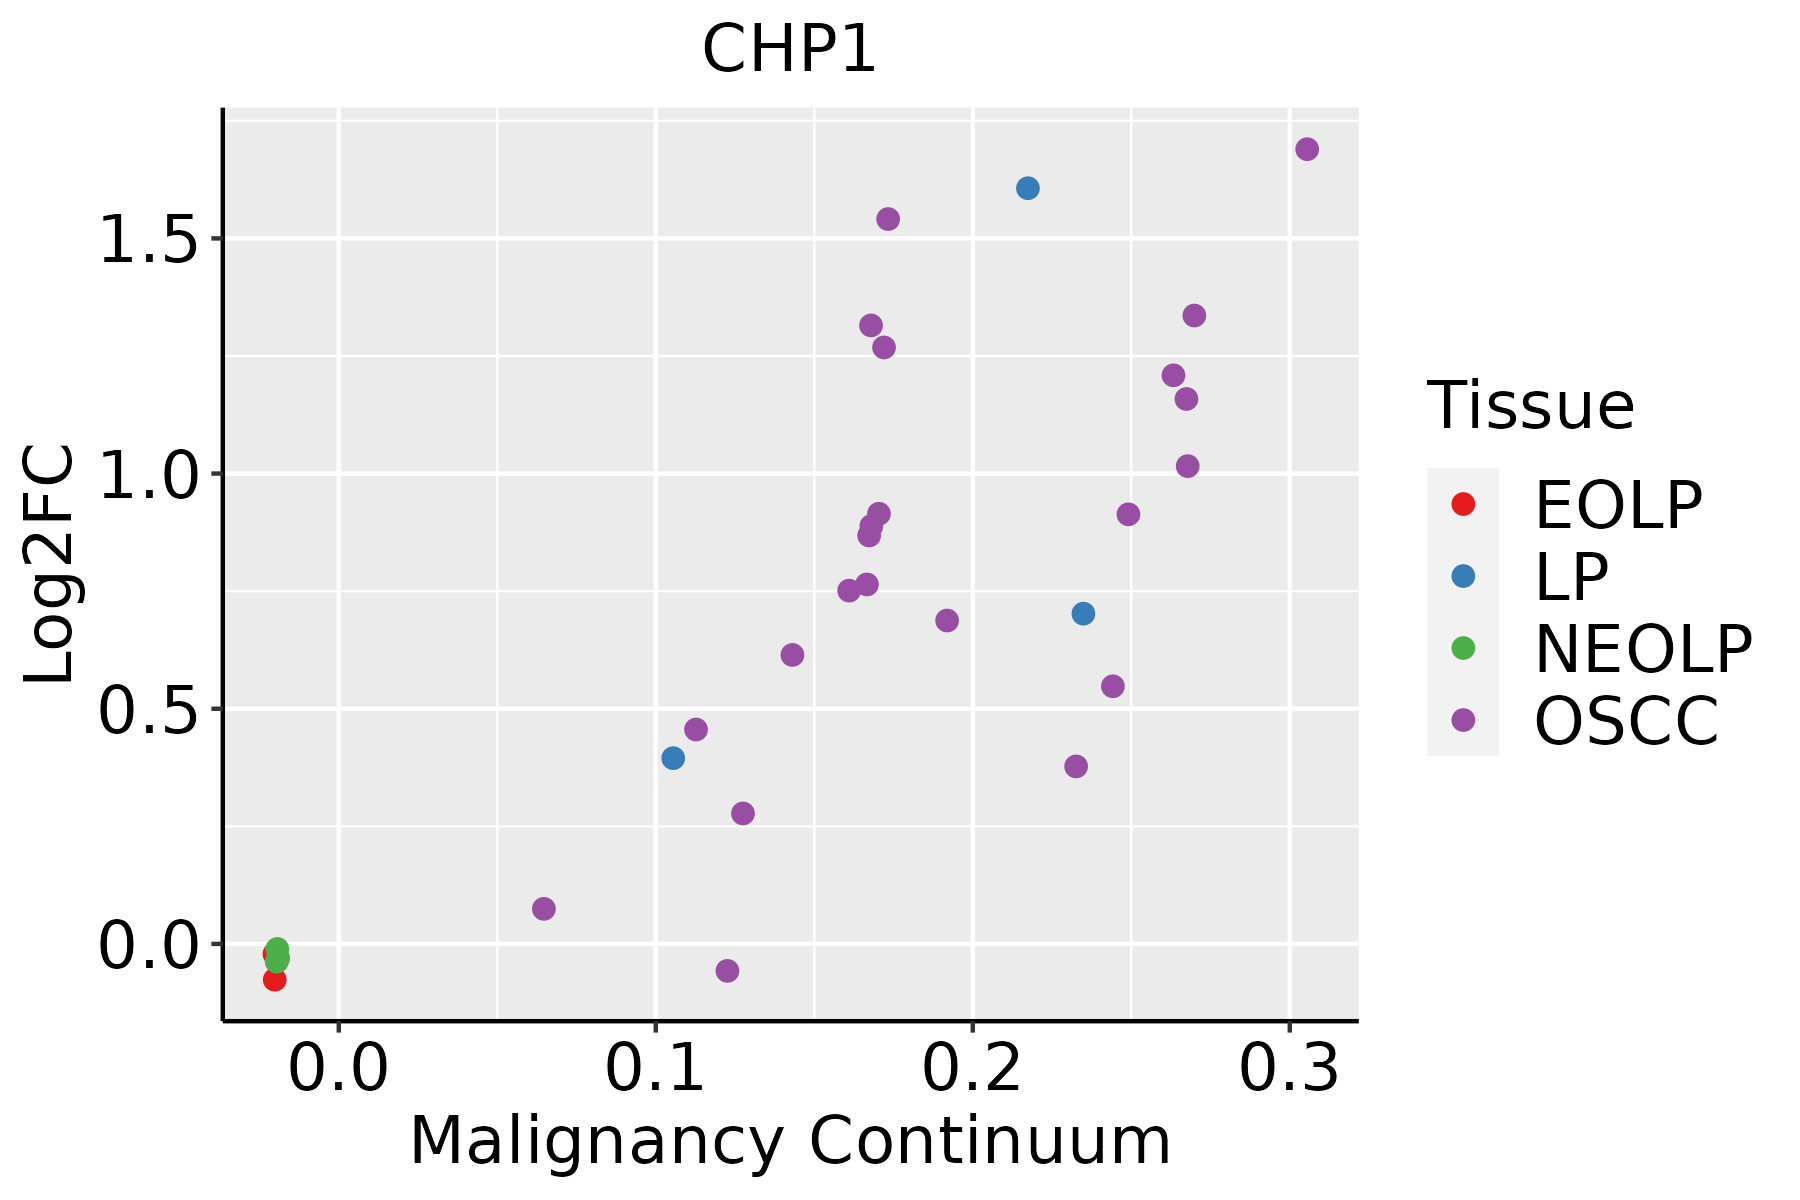
EOLP: Erosive Oral lichen planus
LP: leukoplakia
NEOLP: Non-erosive oral lichen planus
OSCC: Oral squamous cell carcinoma
SkinThe image shows the transcriptomic changes along malignancy continuum.log2FC in expression of this searched gene in stem-like cells from each diseased tissue sample relative to stem-like cells in normal samples in each tissue plotted against the malignancy continuum. Samples are colored based on if they are from different disease stage.AK: Actinic keratosis
cSCC: Cutaneous squamous cell carcinoma
SCCIS:squamous cell carcinoma in situ
ThyroidThe image shows the transcriptomic changes along malignancy continuum.log2FC in expression of this searched gene in stem-like cells from each diseased tissue sample relative to stem-like cells in normal samples in each tissue plotted against the malignancy continuum. Samples are colored based on if they are from different disease stage.
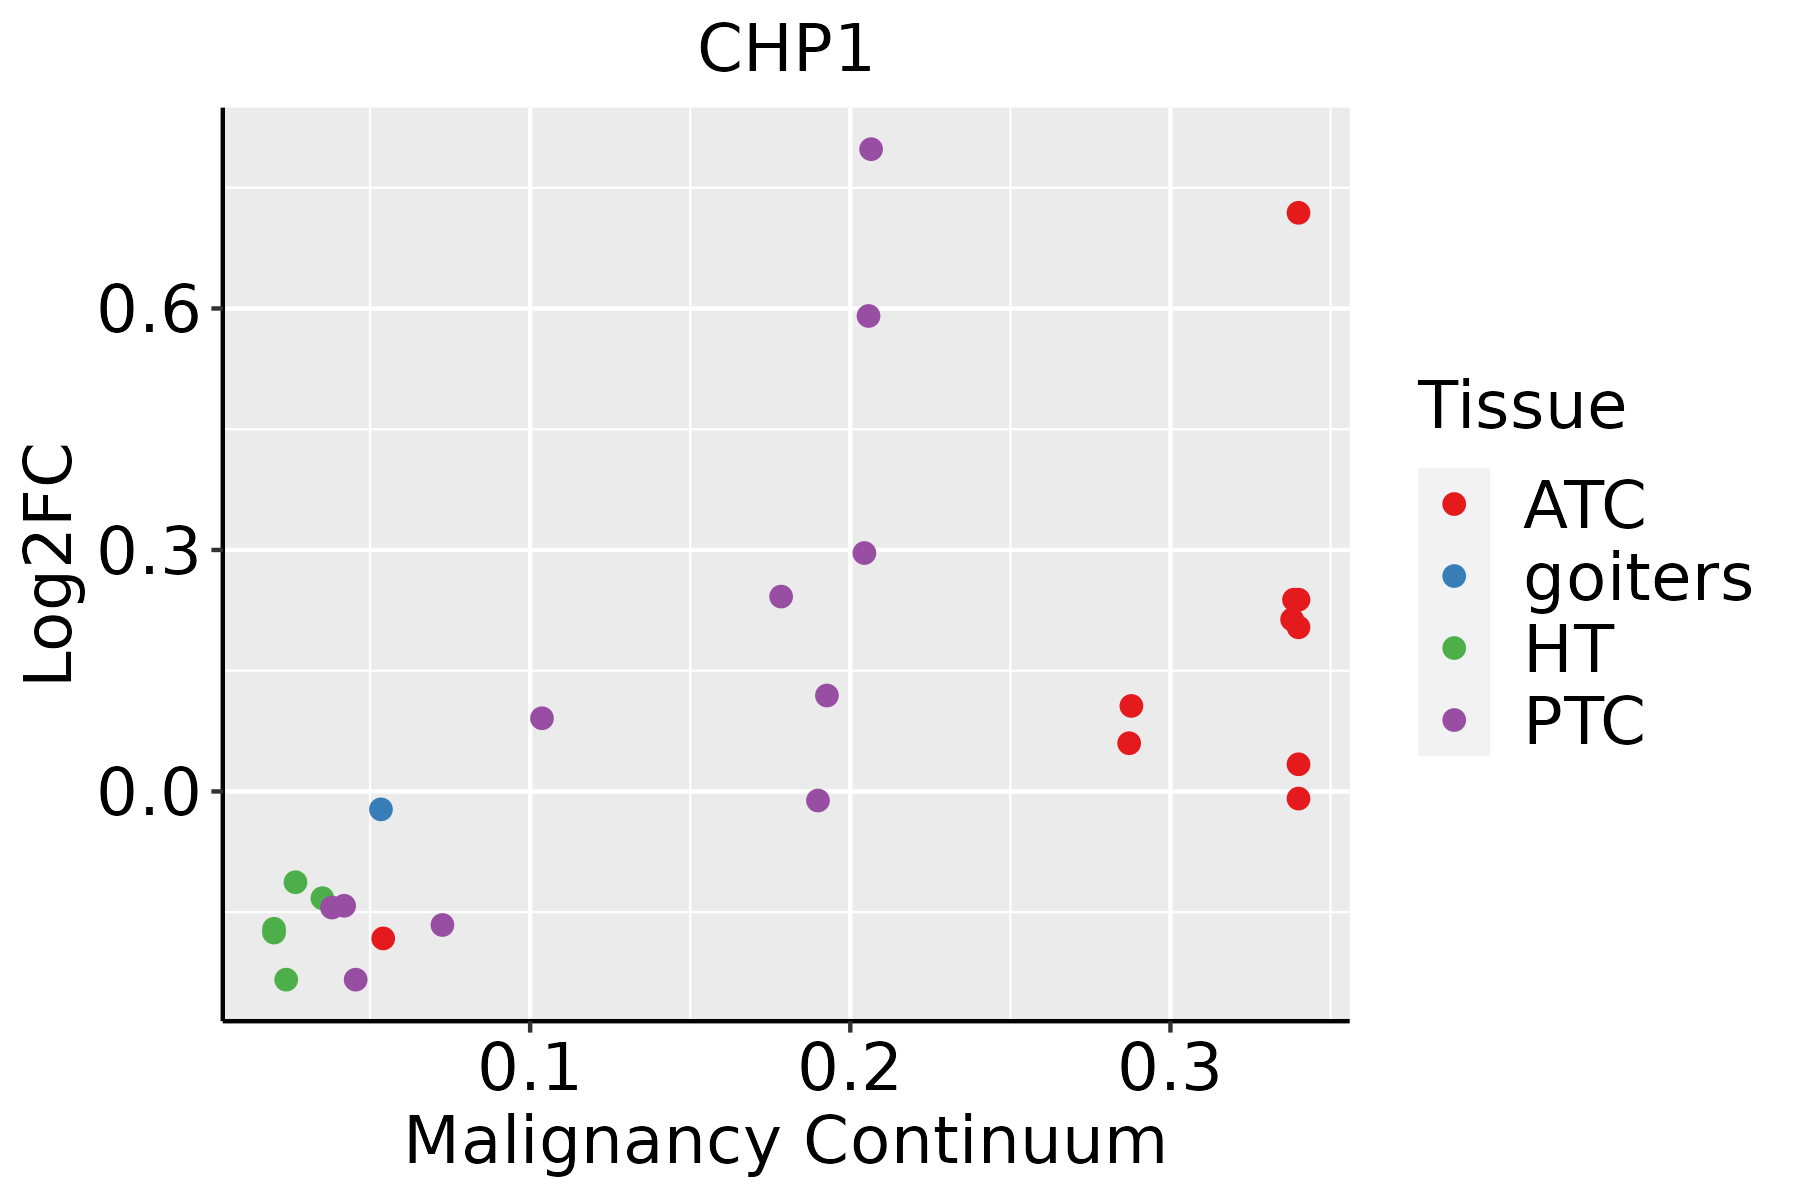
ATC: Anaplastic thyroid cancer
HT: Hashimoto's thyroiditis
PTC: Papillary thyroid cancer
∗log2FC in expression of this searched gene in stem-like cells from each diseased tissue sample relative to stem-like cells in normal samples in each tissue plotted against the malignancy continuum. Samples are colored based on if they are from different disease stage.

Top

Malignant transformation related pathway analysis

check buttonFind out the enriched GO biological processes and KEGG pathways involved in transition from healthy to precancer to cancer
check button Figure of enriched GO biological processes.
TissueDisease StageEnriched GO biological Processes
ColorectumADGO analysis - Figure of enriched GO biological processes: Top 15 enriched GO BP terms are showed in the bar plot of each disease state in each tissue. Each row represents a significant GO biological process which is colored according to the -log10(p.adjust).
ColorectumSERGO analysis - Figure of enriched GO biological processes: Top 15 enriched GO BP terms are showed in the bar plot of each disease state in each tissue. Each row represents a significant GO biological process which is colored according to the -log10(p.adjust).
ColorectumMSSGO analysis - Figure of enriched GO biological processes: Top 15 enriched GO BP terms are showed in the bar plot of each disease state in each tissue. Each row represents a significant GO biological process which is colored according to the -log10(p.adjust).
ColorectumMSI-HGO analysis - Figure of enriched GO biological processes: Top 15 enriched GO BP terms are showed in the bar plot of each disease state in each tissue. Each row represents a significant GO biological process which is colored according to the -log10(p.adjust).
ColorectumFAPGO analysis - Figure of enriched GO biological processes: Top 15 enriched GO BP terms are showed in the bar plot of each disease state in each tissue. Each row represents a significant GO biological process which is colored according to the -log10(p.adjust).
∗Top 15 enriched GO BP terms are showed in the bar plot of each disease state in each tissue. Each row represents a significant GO biological process which is colored according to the -log10(p.adjust).
Page: 1 2 3 4 5 6 7 8 9 

check button Enriched GO biological processes.
GO IDTissueDisease StageDescriptionGene RatioBg Ratiopvaluep.adjustCount
GO:1903829ColorectumADpositive regulation of cellular protein localization110/3918276/187234.58e-138.44e-11110
GO:0072594ColorectumADestablishment of protein localization to organelle148/3918422/187237.95e-121.04e-09148
GO:0090150ColorectumADestablishment of protein localization to membrane100/3918260/187236.01e-116.33e-09100
GO:1905475ColorectumADregulation of protein localization to membrane73/3918175/187233.37e-102.93e-0873
GO:0031647ColorectumADregulation of protein stability108/3918298/187236.33e-105.08e-08108
GO:1902600ColorectumADproton transmembrane transport66/3918157/187231.59e-091.17e-0766
GO:1904951ColorectumADpositive regulation of establishment of protein localization112/3918319/187232.55e-091.80e-07112
GO:0051656ColorectumADestablishment of organelle localization131/3918390/187233.00e-092.06e-07131
GO:0051222ColorectumADpositive regulation of protein transport106/3918303/187238.45e-095.08e-07106
GO:0050821ColorectumADprotein stabilization73/3918191/187233.02e-081.64e-0673
GO:1903320ColorectumADregulation of protein modification by small protein conjugation or removal86/3918242/187239.43e-084.65e-0686
GO:0006913ColorectumADnucleocytoplasmic transport102/3918301/187231.00e-074.85e-06102
GO:0051169ColorectumADnuclear transport102/3918301/187231.00e-074.85e-06102
GO:0006605ColorectumADprotein targeting105/3918314/187231.39e-076.44e-06105
GO:1905477ColorectumADpositive regulation of protein localization to membrane46/3918106/187231.47e-076.64e-0646
GO:0016050ColorectumADvesicle organization101/3918300/187231.65e-077.17e-06101
GO:1900180ColorectumADregulation of protein localization to nucleus55/3918136/187231.70e-077.34e-0655
GO:0090316ColorectumADpositive regulation of intracellular protein transport62/3918160/187231.82e-077.79e-0662
GO:0032388ColorectumADpositive regulation of intracellular transport74/3918202/187231.83e-077.80e-0674
GO:0032386ColorectumADregulation of intracellular transport109/3918337/187235.33e-071.95e-05109
Page: 1 2 3 4 5 6 7 8 9 10 11 12 13 14 15 16 17 18 19 20 21 22 23 24 25 26 27 28 29 30 31 32 33 34 35 36 37 38 39 40 41 42 43 44 45 46 47 48 49 50 51 52 53 

check button Enriched KEGG pathways.
Pathway IDTissueDisease StageDescriptionGene RatioBg Ratiopvaluep.adjustqvalueCount
Page: 1 

Top

Cell-cell communication analysis

check buttonIdentification of potential cell-cell interactions between two cell types and their ligand-receptor pairs for different disease states
LigandReceptorLRpairPathwayTissueDisease Stage
Page: 1 

Top

Single-cell gene regulatory network inference analysis

check buttonFind out the significant the regulons (TFs) and the target genes of each regulon across cell types for different disease states
TFCell TypeTissueDisease StageTarget GeneRSSRegulon Activity
∗The dot plots of a searched regulon are shown for all cell subpopulations in each disease state of each tissue based on the regulon specific score inferred using pySCENIC and by calculating the average expression.
Page: 1 

Top

Somatic mutation of malignant transformation related genes

check buttonAnnotation of somatic variants for genes involved in malignant transformation
Hugo SymbolVariant ClassVariant ClassificationdbSNP RSHGVScHGVSpHGVSp ShortSWISSPROTBIOTYPESIFTPolyPhenTumor Sample BarcodeTissueHistologySexAgeStageTherapy TypesDrugsOutcome
CHP1SNVMissense_Mutationrs79101281c.466N>Ap.Ala156Thrp.A156TQ99653protein_codingtolerated(0.18)benign(0.025)TCGA-BH-A18G-01Breastbreast invasive carcinomaFemale>=65I/IIUnknownUnknownSD
CHP1deletionFrame_Shift_Delnovelc.298delNp.Asp101MetfsTer2p.D101Mfs*2Q99653protein_codingTCGA-D8-A27V-01Breastbreast invasive carcinomaFemale<65I/IIHormone TherapytamoxiphenSD
CHP1SNVMissense_Mutationc.73N>Tp.His25Tyrp.H25YQ99653protein_codingdeleterious(0.04)benign(0.068)TCGA-JW-A5VL-01Cervixcervical & endocervical cancerFemale<65I/IIUnknownUnknownSD
CHP1SNVMissense_Mutationnovelc.280N>Ap.Glu94Lysp.E94KQ99653protein_codingtolerated(0.58)benign(0.001)TCGA-ZJ-AAXT-01Cervixcervical & endocervical cancerFemale<65III/IVUnknownUnknownSD
CHP1SNVMissense_Mutationrs767999244c.254G>Ap.Arg85Glnp.R85QQ99653protein_codingtolerated(0.09)benign(0.154)TCGA-EI-6917-01Colorectumrectum adenocarcinomaMale<65III/IVChemotherapy5fluorouracil+oxaciplatina+l-folinianSD
CHP1SNVMissense_Mutationrs770704424c.419G>Ap.Arg140Hisp.R140HQ99653protein_codingtolerated(0.32)benign(0.006)TCGA-EI-6917-01Colorectumrectum adenocarcinomaMale<65III/IVChemotherapy5fluorouracil+oxaciplatina+l-folinianSD
CHP1SNVMissense_Mutationnovelc.580N>Ap.Leu194Ilep.L194IQ99653protein_codingdeleterious(0.02)probably_damaging(0.966)TCGA-A5-A0G2-01Endometriumuterine corpus endometrioid carcinomaFemale<65III/IVUnknownUnknownSD
CHP1SNVMissense_Mutationc.329G>Ap.Ser110Asnp.S110NQ99653protein_codingtolerated(0.09)benign(0.007)TCGA-A5-A0GP-01Endometriumuterine corpus endometrioid carcinomaFemale<65I/IIUnknownUnknownSD
CHP1SNVMissense_Mutationnovelc.580N>Ap.Leu194Ilep.L194IQ99653protein_codingdeleterious(0.02)probably_damaging(0.966)TCGA-B5-A1MR-01Endometriumuterine corpus endometrioid carcinomaFemale>=65III/IVUnknownUnknownSD
CHP1SNVMissense_Mutationc.292N>Gp.Lys98Glup.K98EQ99653protein_codingtolerated(0.35)benign(0)TCGA-BS-A0UJ-01Endometriumuterine corpus endometrioid carcinomaFemale>=65I/IIUnknownUnknownSD
Page: 1 2 

Top

Related drugs of malignant transformation related genes

check buttonIdentification of chemicals and drugs interact with genes involved in malignant transfromation
(DGIdb 4.0)
Entrez IDSymbolCategoryInteraction TypesDrug Claim NameDrug NamePMIDs
Page: 1