
|
|||||
|
 | |
| |
| |
| |
| |
| |
|
Gene: CHODL |
Gene summary for CHODL |
| Gene information | Species | Human | Gene symbol | CHODL | Gene ID | 140578 |
| Gene name | chondrolectin | |
| Gene Alias | C21orf68 | |
| Cytomap | 21q21.1 | |
| Gene Type | protein-coding | GO ID | GO:0000902 | UniProtAcc | Q9H9P2 |
Top |
Malignant transformation analysis |
| Identification of the aberrant gene expression in precancerous and cancerous lesions by comparing the gene expression of stem-like cells in diseased tissues with normal stem cells |
| Entrez ID | Symbol | Replicates | Species | Organ | Tissue | Adj P-value | Log2FC | Malignancy |
| 140578 | CHODL | CCI_3 | Human | Cervix | CC | 1.69e-22 | 1.30e+00 | 0.516 |
| 140578 | CHODL | LZE4T | Human | Esophagus | ESCC | 1.53e-07 | 3.77e-01 | 0.0811 |
| 140578 | CHODL | LZE7T | Human | Esophagus | ESCC | 5.91e-16 | 8.82e-01 | 0.0667 |
| 140578 | CHODL | P4T-E | Human | Esophagus | ESCC | 2.38e-08 | 3.08e-01 | 0.1323 |
| 140578 | CHODL | P9T-E | Human | Esophagus | ESCC | 1.92e-18 | 4.80e-01 | 0.1131 |
| 140578 | CHODL | P10T-E | Human | Esophagus | ESCC | 6.51e-47 | 8.80e-01 | 0.116 |
| 140578 | CHODL | P15T-E | Human | Esophagus | ESCC | 4.48e-29 | 6.74e-01 | 0.1149 |
| 140578 | CHODL | P20T-E | Human | Esophagus | ESCC | 6.27e-04 | 9.40e-02 | 0.1124 |
| 140578 | CHODL | P22T-E | Human | Esophagus | ESCC | 5.71e-30 | 5.90e-01 | 0.1236 |
| 140578 | CHODL | P27T-E | Human | Esophagus | ESCC | 6.52e-11 | 1.91e-01 | 0.1055 |
| 140578 | CHODL | P28T-E | Human | Esophagus | ESCC | 7.29e-10 | 2.03e-01 | 0.1149 |
| 140578 | CHODL | P30T-E | Human | Esophagus | ESCC | 5.51e-27 | 1.03e+00 | 0.137 |
| 140578 | CHODL | P31T-E | Human | Esophagus | ESCC | 6.63e-16 | 2.79e-01 | 0.1251 |
| 140578 | CHODL | P36T-E | Human | Esophagus | ESCC | 8.27e-03 | 8.74e-02 | 0.1187 |
| 140578 | CHODL | P39T-E | Human | Esophagus | ESCC | 7.88e-03 | 4.07e-02 | 0.0894 |
| 140578 | CHODL | P42T-E | Human | Esophagus | ESCC | 1.66e-08 | 2.84e-01 | 0.1175 |
| 140578 | CHODL | P48T-E | Human | Esophagus | ESCC | 4.73e-02 | 1.09e-01 | 0.0959 |
| 140578 | CHODL | P52T-E | Human | Esophagus | ESCC | 1.10e-03 | 6.06e-02 | 0.1555 |
| 140578 | CHODL | P62T-E | Human | Esophagus | ESCC | 5.96e-04 | 1.40e-01 | 0.1302 |
| 140578 | CHODL | P74T-E | Human | Esophagus | ESCC | 1.45e-05 | 2.93e-01 | 0.1479 |
| Page: 1 2 |
| Tissue | Expression Dynamics | Abbreviation |
| Cervix | 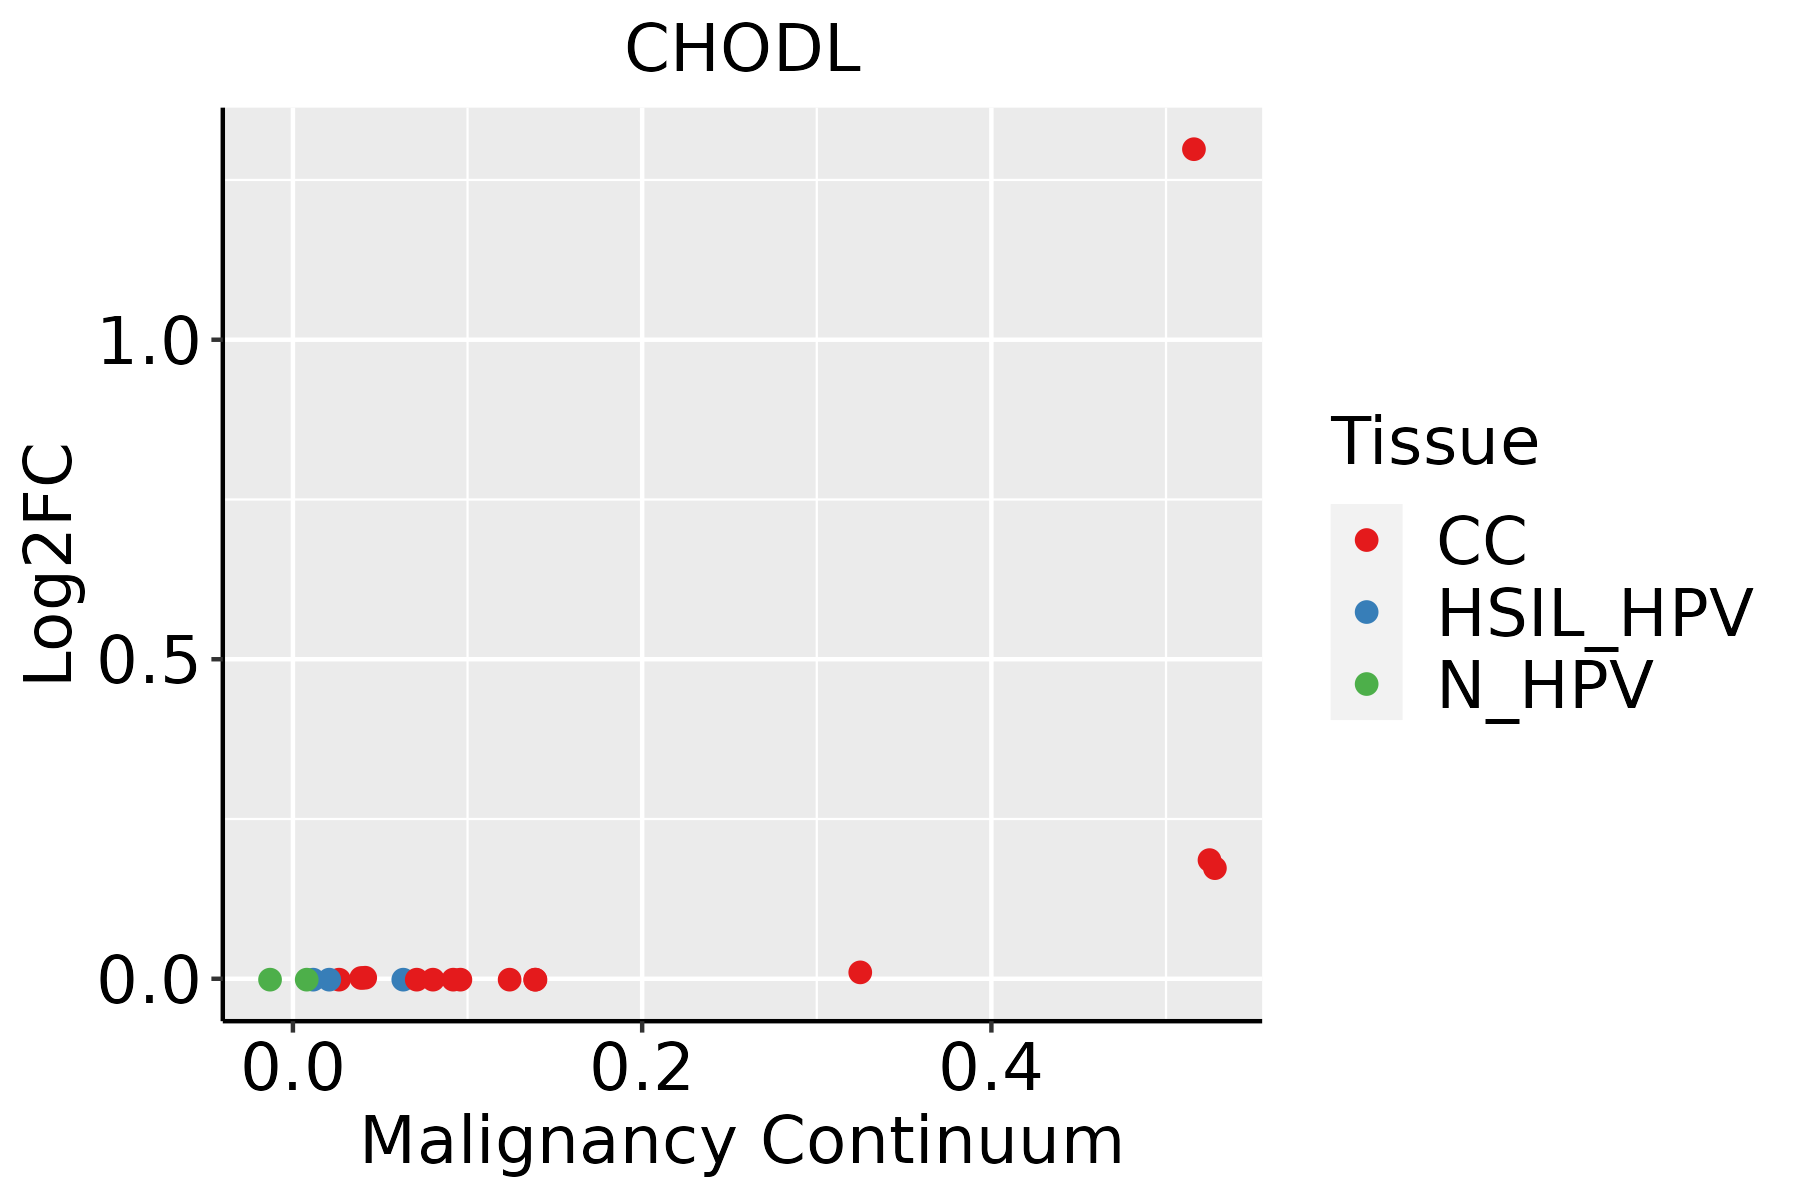 | CC: Cervix cancer |
| HSIL_HPV: HPV-infected high-grade squamous intraepithelial lesions | ||
| N_HPV: HPV-infected normal cervix | ||
| Esophagus | 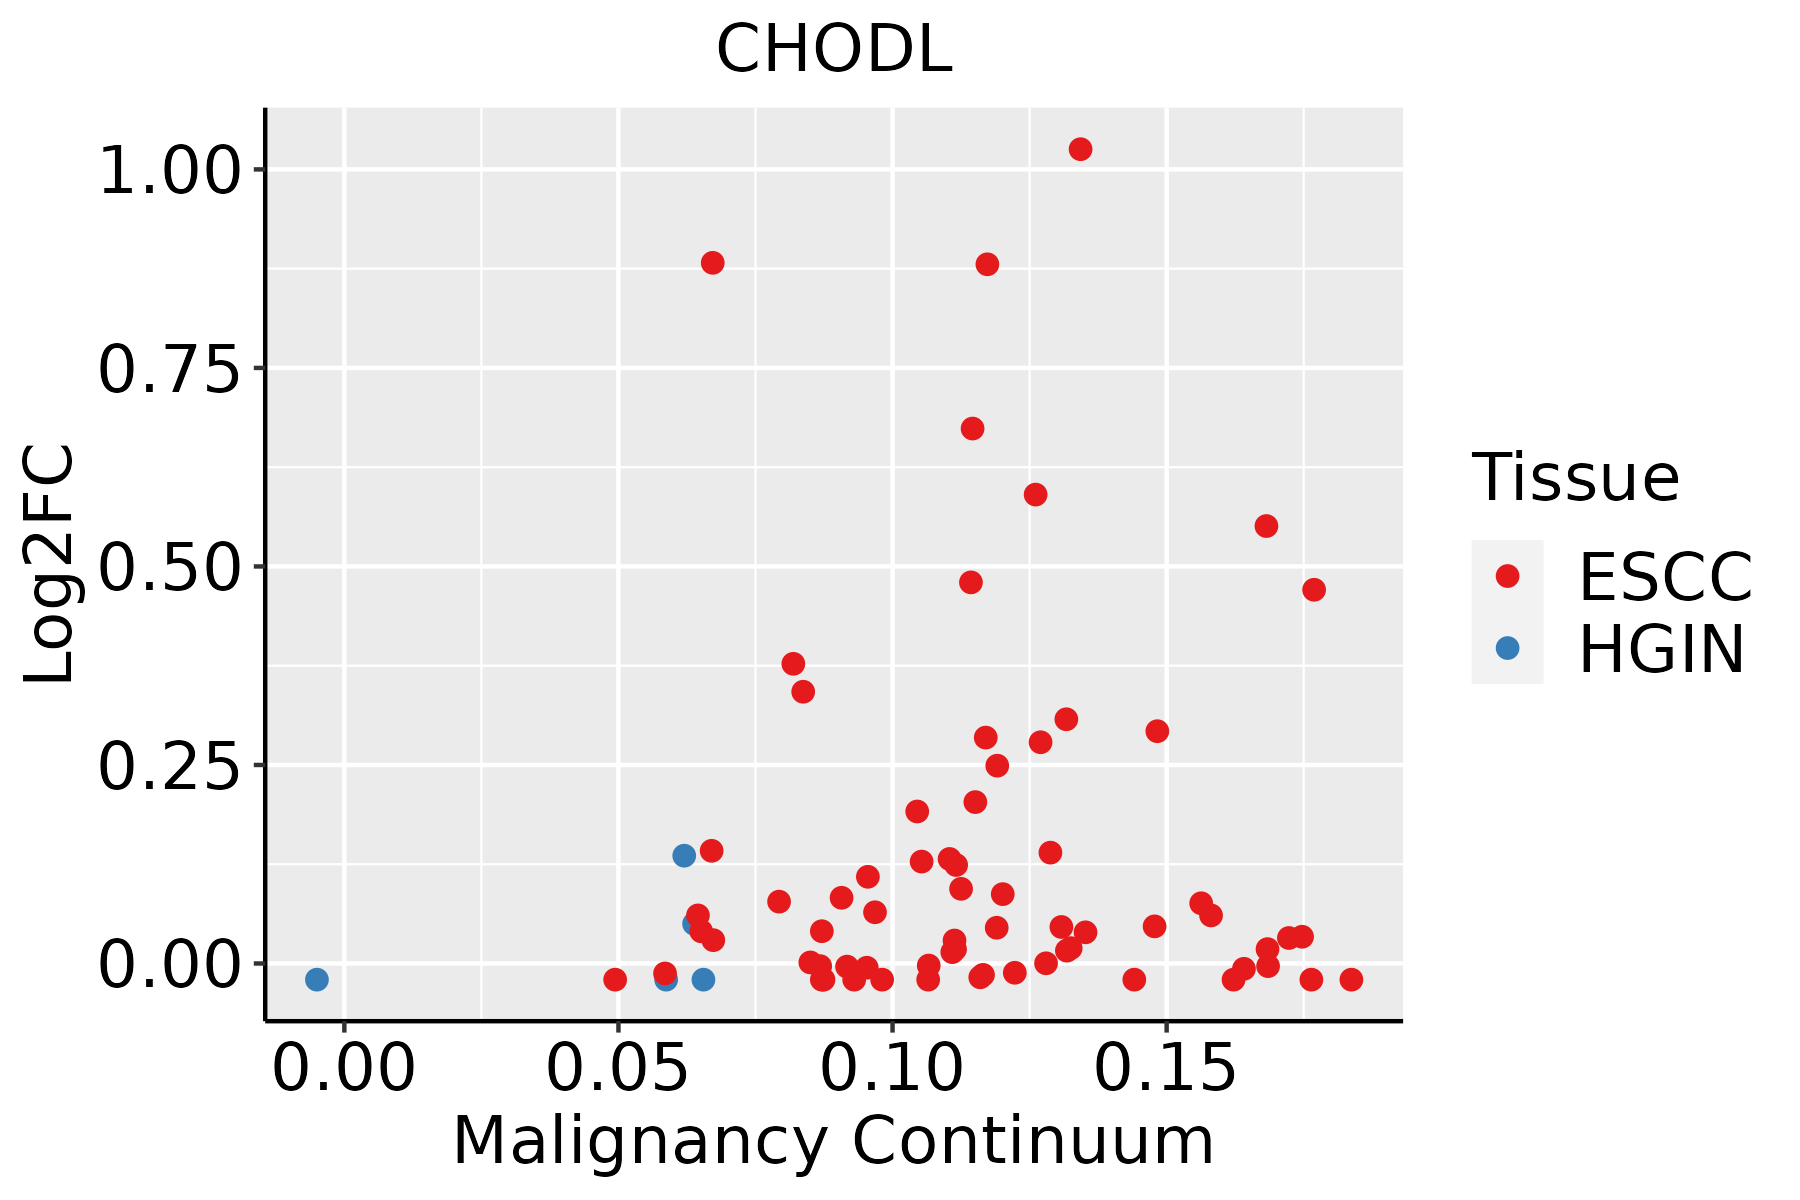 | ESCC: Esophageal squamous cell carcinoma |
| HGIN: High-grade intraepithelial neoplasias | ||
| LGIN: Low-grade intraepithelial neoplasias | ||
| Lung |  | AAH: Atypical adenomatous hyperplasia |
| AIS: Adenocarcinoma in situ | ||
| IAC: Invasive lung adenocarcinoma | ||
| MIA: Minimally invasive adenocarcinoma |
| ∗log2FC in expression of this searched gene in stem-like cells from each diseased tissue sample relative to stem-like cells in normal samples in each tissue plotted against the malignancy continuum. Samples are colored based on if they are from different disease stage. |
Top |
Malignant transformation related pathway analysis |
| Find out the enriched GO biological processes and KEGG pathways involved in transition from healthy to precancer to cancer |
| Tissue | Disease Stage | Enriched GO biological Processes |
| Colorectum | AD |  |
| Colorectum | SER |  |
| Colorectum | MSS |  |
| Colorectum | MSI-H |  |
| Colorectum | FAP |  |
| ∗Top 15 enriched GO BP terms are showed in the bar plot of each disease state in each tissue. Each row represents a significant GO biological process which is colored according to the -log10(p.adjust). |
| Page: 1 2 3 4 5 6 7 8 9 |
| GO ID | Tissue | Disease Stage | Description | Gene Ratio | Bg Ratio | pvalue | p.adjust | Count |
| GO:00109757 | Cervix | CC | regulation of neuron projection development | 88/2311 | 445/18723 | 4.26e-06 | 1.09e-04 | 88 |
| GO:00107206 | Cervix | CC | positive regulation of cell development | 64/2311 | 298/18723 | 5.69e-06 | 1.41e-04 | 64 |
| GO:00313467 | Cervix | CC | positive regulation of cell projection organization | 72/2311 | 353/18723 | 1.04e-05 | 2.32e-04 | 72 |
| GO:00615647 | Cervix | CC | axon development | 89/2311 | 467/18723 | 1.71e-05 | 3.27e-04 | 89 |
| GO:00074097 | Cervix | CC | axonogenesis | 78/2311 | 418/18723 | 1.14e-04 | 1.43e-03 | 78 |
| GO:00507705 | Cervix | CC | regulation of axonogenesis | 34/2311 | 154/18723 | 4.87e-04 | 4.76e-03 | 34 |
| GO:00519603 | Cervix | CC | regulation of nervous system development | 77/2311 | 443/18723 | 1.13e-03 | 9.30e-03 | 77 |
| GO:00507724 | Cervix | CC | positive regulation of axonogenesis | 20/2311 | 79/18723 | 1.19e-03 | 9.57e-03 | 20 |
| GO:00507676 | Cervix | CC | regulation of neurogenesis | 65/2311 | 364/18723 | 1.33e-03 | 1.05e-02 | 65 |
| GO:00507694 | Cervix | CC | positive regulation of neurogenesis | 43/2311 | 225/18723 | 2.25e-03 | 1.61e-02 | 43 |
| GO:00075173 | Cervix | CC | muscle organ development | 58/2311 | 327/18723 | 2.73e-03 | 1.85e-02 | 58 |
| GO:00519622 | Cervix | CC | positive regulation of nervous system development | 48/2311 | 272/18723 | 6.60e-03 | 3.65e-02 | 48 |
| GO:003134616 | Esophagus | ESCC | positive regulation of cell projection organization | 201/8552 | 353/18723 | 1.19e-05 | 1.11e-04 | 201 |
| GO:001072010 | Esophagus | ESCC | positive regulation of cell development | 172/8552 | 298/18723 | 1.74e-05 | 1.55e-04 | 172 |
| GO:005076710 | Esophagus | ESCC | regulation of neurogenesis | 203/8552 | 364/18723 | 6.10e-05 | 4.68e-04 | 203 |
| GO:00507697 | Esophagus | ESCC | positive regulation of neurogenesis | 131/8552 | 225/18723 | 9.71e-05 | 6.90e-04 | 131 |
| GO:006156415 | Esophagus | ESCC | axon development | 251/8552 | 467/18723 | 2.41e-04 | 1.49e-03 | 251 |
| GO:001097516 | Esophagus | ESCC | regulation of neuron projection development | 240/8552 | 445/18723 | 2.48e-04 | 1.53e-03 | 240 |
| GO:00519606 | Esophagus | ESCC | regulation of nervous system development | 237/8552 | 443/18723 | 5.02e-04 | 2.78e-03 | 237 |
| GO:00519625 | Esophagus | ESCC | positive regulation of nervous system development | 149/8552 | 272/18723 | 1.50e-03 | 7.06e-03 | 149 |
| Page: 1 2 |
| Pathway ID | Tissue | Disease Stage | Description | Gene Ratio | Bg Ratio | pvalue | p.adjust | qvalue | Count |
| Page: 1 |
Top |
Cell-cell communication analysis |
| Identification of potential cell-cell interactions between two cell types and their ligand-receptor pairs for different disease states |
| Ligand | Receptor | LRpair | Pathway | Tissue | Disease Stage |
| Page: 1 |
Top |
Single-cell gene regulatory network inference analysis |
| Find out the significant the regulons (TFs) and the target genes of each regulon across cell types for different disease states |
| TF | Cell Type | Tissue | Disease Stage | Target Gene | RSS | Regulon Activity |
| ∗The dot plots of a searched regulon are shown for all cell subpopulations in each disease state of each tissue based on the regulon specific score inferred using pySCENIC and by calculating the average expression. |
| Page: 1 |
Top |
Somatic mutation of malignant transformation related genes |
| Annotation of somatic variants for genes involved in malignant transformation |
| Hugo Symbol | Variant Class | Variant Classification | dbSNP RS | HGVSc | HGVSp | HGVSp Short | SWISSPROT | BIOTYPE | SIFT | PolyPhen | Tumor Sample Barcode | Tissue | Histology | Sex | Age | Stage | Therapy Types | Drugs | Outcome |
| CHODL | SNV | Missense_Mutation | rs780658002 | c.89N>G | p.Val30Gly | p.V30G | Q9H9P2 | protein_coding | deleterious(0) | benign(0.274) | TCGA-EW-A423-01 | Breast | breast invasive carcinoma | Female | >=65 | I/II | Hormone Therapy | anastrozole | SD |
| CHODL | SNV | Missense_Mutation | c.611A>C | p.Gln204Pro | p.Q204P | Q9H9P2 | protein_coding | tolerated(0.27) | benign(0.036) | TCGA-AA-3977-01 | Colorectum | colon adenocarcinoma | Male | >=65 | I/II | Unknown | Unknown | SD | |
| CHODL | SNV | Missense_Mutation | c.202N>A | p.Leu68Ile | p.L68I | Q9H9P2 | protein_coding | deleterious(0) | possibly_damaging(0.853) | TCGA-AA-A022-01 | Colorectum | colon adenocarcinoma | Female | >=65 | I/II | Unknown | Unknown | SD | |
| CHODL | SNV | Missense_Mutation | c.685N>G | p.Leu229Val | p.L229V | Q9H9P2 | protein_coding | deleterious(0) | probably_damaging(0.991) | TCGA-AD-6895-01 | Colorectum | colon adenocarcinoma | Male | >=65 | III/IV | Unknown | Unknown | SD | |
| CHODL | SNV | Missense_Mutation | novel | c.322N>T | p.Asp108Tyr | p.D108Y | Q9H9P2 | protein_coding | deleterious(0) | possibly_damaging(0.489) | TCGA-AZ-4315-01 | Colorectum | colon adenocarcinoma | Male | <65 | I/II | Unknown | Unknown | SD |
| CHODL | SNV | Missense_Mutation | c.146N>A | p.Ser49Tyr | p.S49Y | Q9H9P2 | protein_coding | deleterious(0.01) | possibly_damaging(0.486) | TCGA-CM-6167-01 | Colorectum | colon adenocarcinoma | Female | <65 | III/IV | Unknown | Unknown | SD | |
| CHODL | SNV | Missense_Mutation | novel | c.457N>T | p.Ala153Ser | p.A153S | Q9H9P2 | protein_coding | tolerated(0.06) | possibly_damaging(0.568) | TCGA-G4-6295-01 | Colorectum | colon adenocarcinoma | Female | >=65 | I/II | Unknown | Unknown | SD |
| CHODL | SNV | Missense_Mutation | c.289G>T | p.Gly97Cys | p.G97C | Q9H9P2 | protein_coding | deleterious(0) | probably_damaging(1) | TCGA-AG-A00C-01 | Colorectum | rectum adenocarcinoma | Female | <65 | III/IV | Chemotherapy | 5-fluorouracil | CR | |
| CHODL | SNV | Missense_Mutation | novel | c.475N>T | p.Gly159Cys | p.G159C | Q9H9P2 | protein_coding | deleterious(0) | probably_damaging(0.998) | TCGA-A5-A0G1-01 | Endometrium | uterine corpus endometrioid carcinoma | Female | >=65 | I/II | Unknown | Unknown | SD |
| CHODL | SNV | Missense_Mutation | novel | c.263C>T | p.Thr88Ile | p.T88I | Q9H9P2 | protein_coding | tolerated(0.16) | possibly_damaging(0.882) | TCGA-A5-A1OF-01 | Endometrium | uterine corpus endometrioid carcinoma | Female | <65 | I/II | Unknown | Unknown | SD |
| Page: 1 2 3 4 |
Top |
Related drugs of malignant transformation related genes |
| Identification of chemicals and drugs interact with genes involved in malignant transfromation |
| (DGIdb 4.0) |
| Entrez ID | Symbol | Category | Interaction Types | Drug Claim Name | Drug Name | PMIDs |
| Page: 1 |

Copyright 2023-Present -The University of Texas Health Science Center at Houston |