
|
|||||
|
 | |
| |
| |
| |
| |
| |
|
Gene: CHMP4C |
Gene summary for CHMP4C |
| Gene information | Species | Human | Gene symbol | CHMP4C | Gene ID | 92421 |
| Gene name | charged multivesicular body protein 4C | |
| Gene Alias | SNF7-3 | |
| Cytomap | 8q21.13 | |
| Gene Type | protein-coding | GO ID | GO:0000070 | UniProtAcc | Q96CF2 |
Top |
Malignant transformation analysis |
| Identification of the aberrant gene expression in precancerous and cancerous lesions by comparing the gene expression of stem-like cells in diseased tissues with normal stem cells |
| Entrez ID | Symbol | Replicates | Species | Organ | Tissue | Adj P-value | Log2FC | Malignancy |
| 92421 | CHMP4C | LZE4T | Human | Esophagus | ESCC | 1.96e-10 | 3.47e-01 | 0.0811 |
| 92421 | CHMP4C | LZE7T | Human | Esophagus | ESCC | 4.80e-03 | 1.73e-01 | 0.0667 |
| 92421 | CHMP4C | LZE8T | Human | Esophagus | ESCC | 8.81e-06 | 8.46e-02 | 0.067 |
| 92421 | CHMP4C | LZE20T | Human | Esophagus | ESCC | 7.17e-07 | 3.97e-01 | 0.0662 |
| 92421 | CHMP4C | LZE24T | Human | Esophagus | ESCC | 4.73e-12 | 3.74e-01 | 0.0596 |
| 92421 | CHMP4C | P1T-E | Human | Esophagus | ESCC | 4.20e-02 | 3.54e-01 | 0.0875 |
| 92421 | CHMP4C | P2T-E | Human | Esophagus | ESCC | 4.05e-12 | 3.64e-01 | 0.1177 |
| 92421 | CHMP4C | P4T-E | Human | Esophagus | ESCC | 8.39e-13 | 3.87e-01 | 0.1323 |
| 92421 | CHMP4C | P5T-E | Human | Esophagus | ESCC | 2.58e-12 | 2.71e-01 | 0.1327 |
| 92421 | CHMP4C | P8T-E | Human | Esophagus | ESCC | 1.20e-25 | 5.69e-01 | 0.0889 |
| 92421 | CHMP4C | P9T-E | Human | Esophagus | ESCC | 4.71e-08 | 1.21e-01 | 0.1131 |
| 92421 | CHMP4C | P10T-E | Human | Esophagus | ESCC | 1.72e-09 | 1.05e-01 | 0.116 |
| 92421 | CHMP4C | P11T-E | Human | Esophagus | ESCC | 1.77e-13 | 5.03e-01 | 0.1426 |
| 92421 | CHMP4C | P15T-E | Human | Esophagus | ESCC | 4.53e-02 | 6.97e-02 | 0.1149 |
| 92421 | CHMP4C | P16T-E | Human | Esophagus | ESCC | 9.45e-29 | 6.57e-01 | 0.1153 |
| 92421 | CHMP4C | P17T-E | Human | Esophagus | ESCC | 6.44e-07 | 4.54e-01 | 0.1278 |
| 92421 | CHMP4C | P20T-E | Human | Esophagus | ESCC | 1.98e-14 | 3.64e-01 | 0.1124 |
| 92421 | CHMP4C | P21T-E | Human | Esophagus | ESCC | 2.17e-05 | 3.24e-02 | 0.1617 |
| 92421 | CHMP4C | P22T-E | Human | Esophagus | ESCC | 1.12e-11 | 2.60e-01 | 0.1236 |
| 92421 | CHMP4C | P23T-E | Human | Esophagus | ESCC | 3.21e-19 | 7.08e-01 | 0.108 |
| Page: 1 2 3 4 5 |
| Tissue | Expression Dynamics | Abbreviation |
| Esophagus |  | ESCC: Esophageal squamous cell carcinoma |
| HGIN: High-grade intraepithelial neoplasias | ||
| LGIN: Low-grade intraepithelial neoplasias | ||
| Liver | 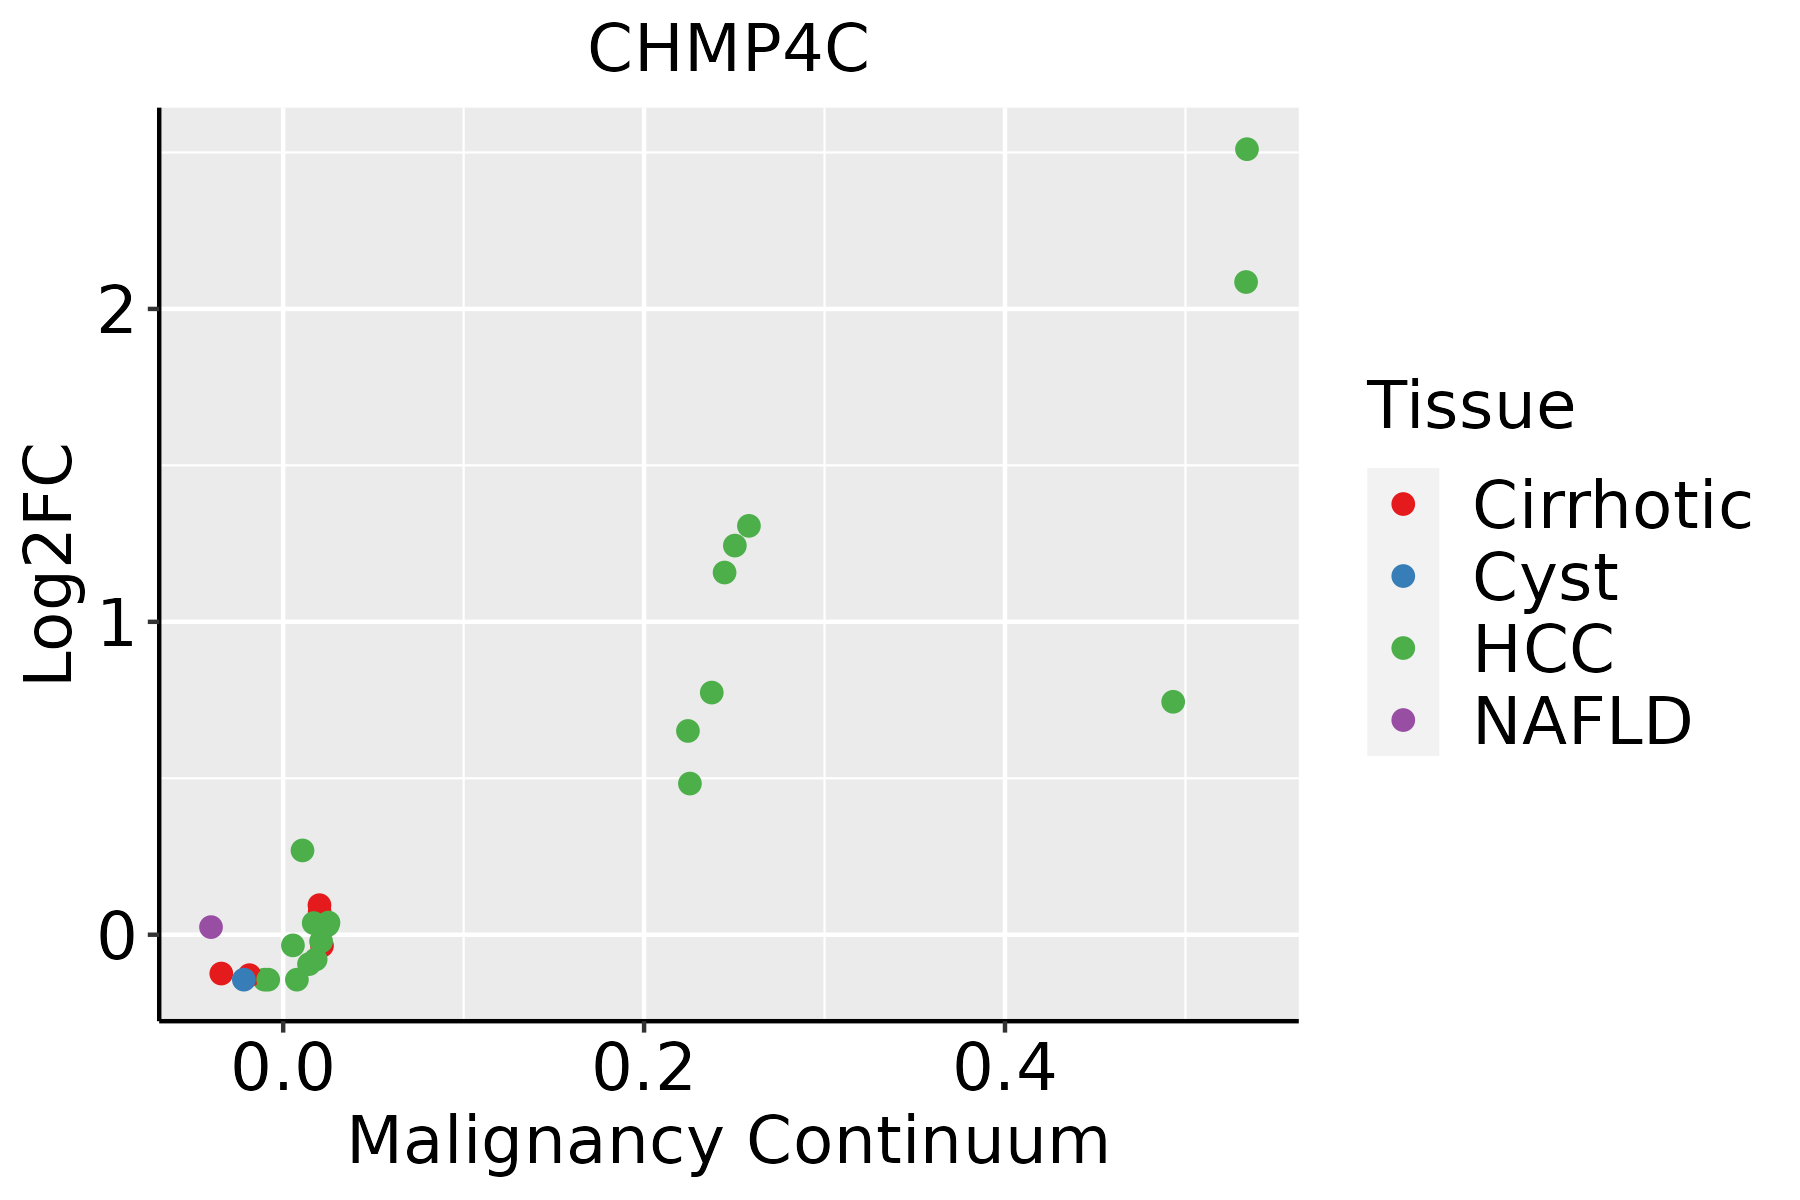 | HCC: Hepatocellular carcinoma |
| NAFLD: Non-alcoholic fatty liver disease | ||
| Oral Cavity |  | EOLP: Erosive Oral lichen planus |
| LP: leukoplakia | ||
| NEOLP: Non-erosive oral lichen planus | ||
| OSCC: Oral squamous cell carcinoma | ||
| Prostate | 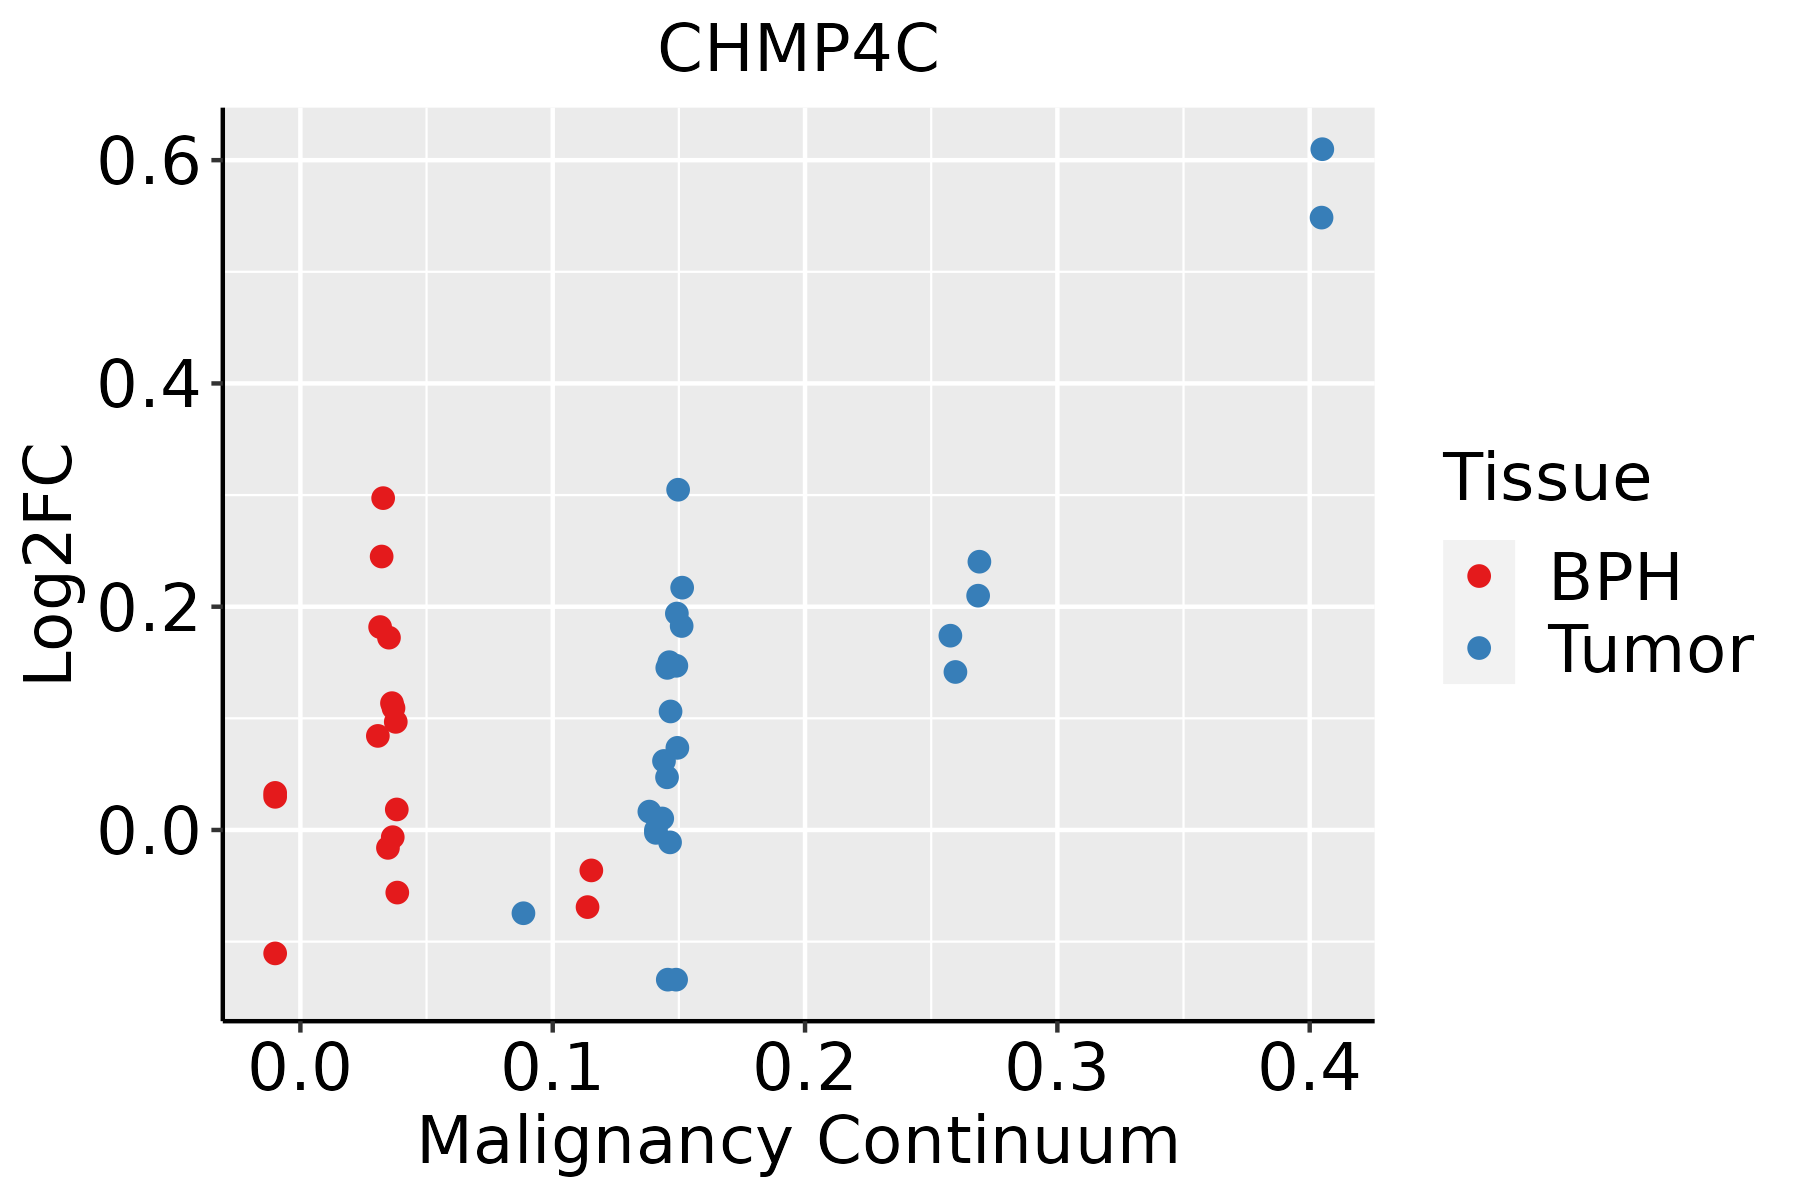 | BPH: Benign Prostatic Hyperplasia |
| Thyroid | 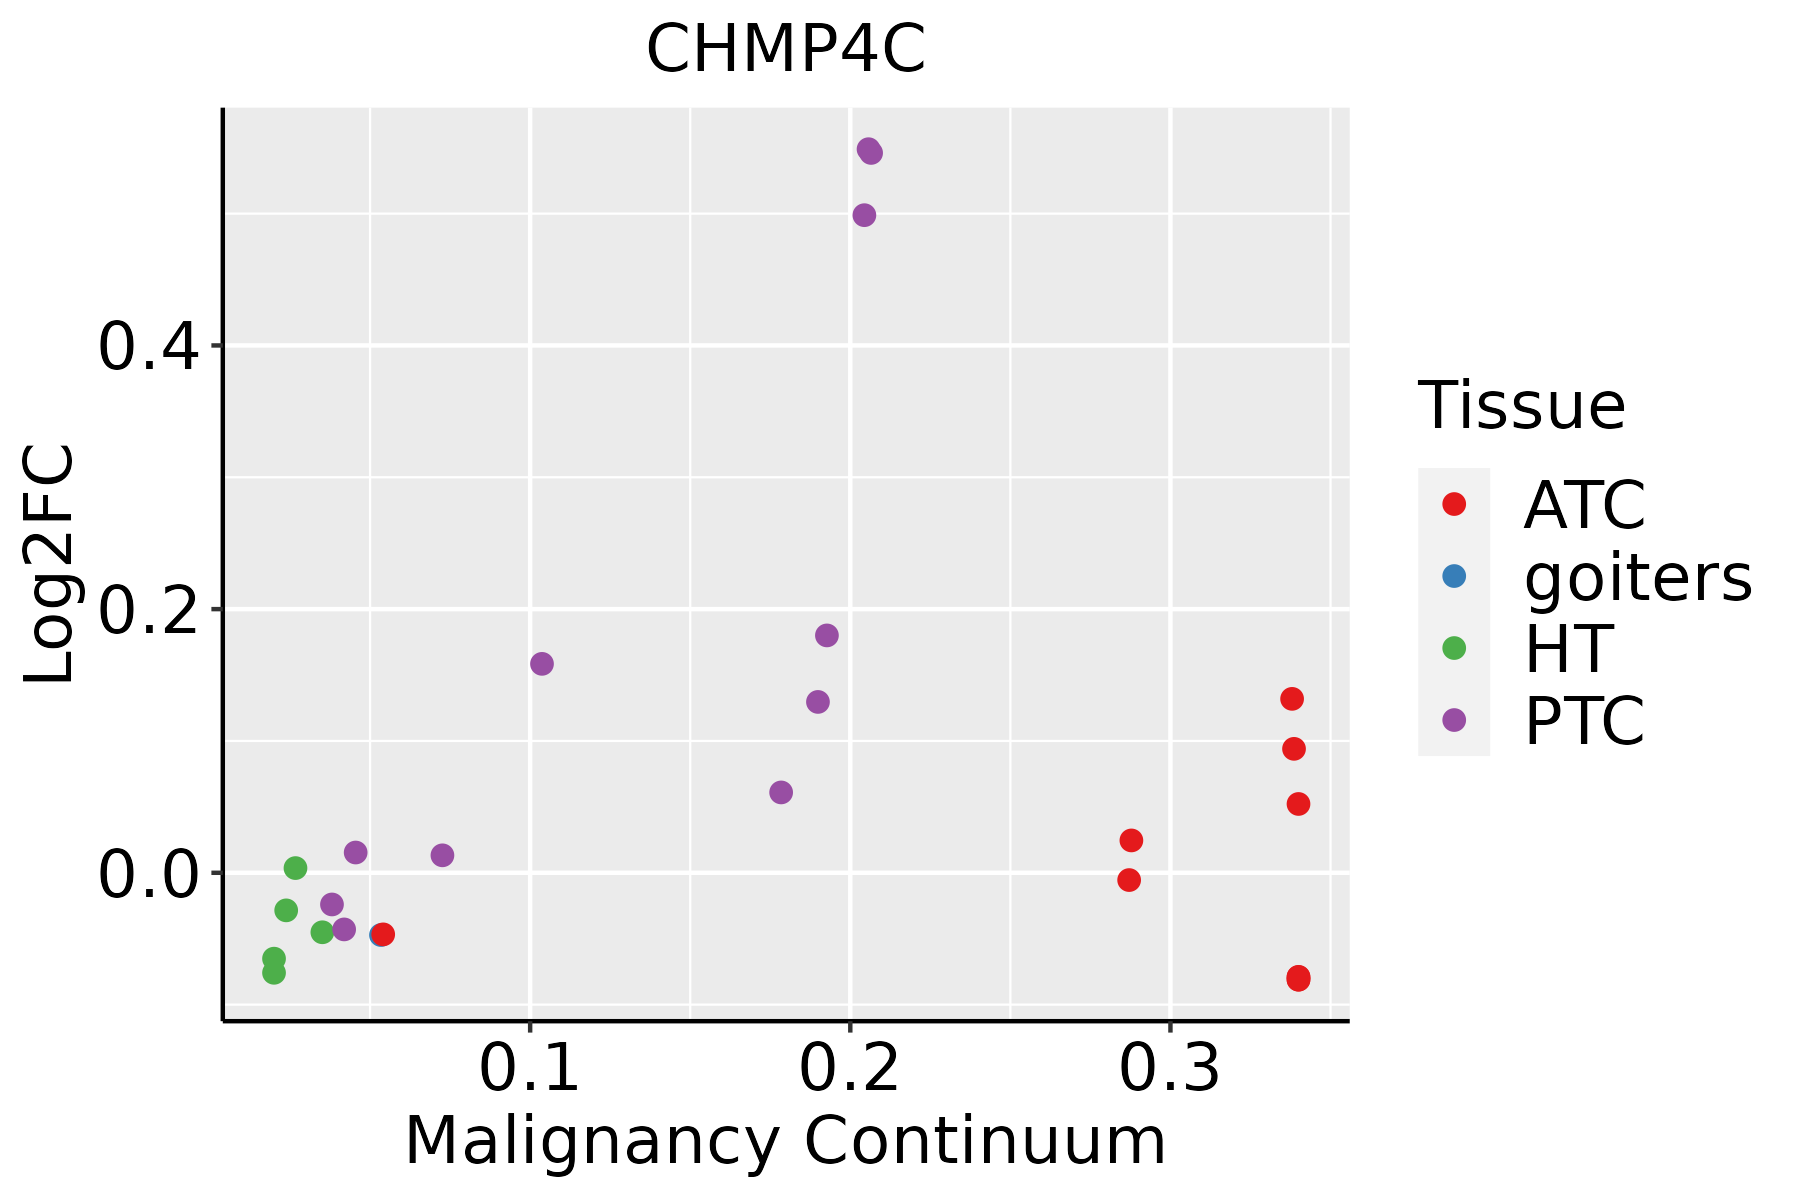 | ATC: Anaplastic thyroid cancer |
| HT: Hashimoto's thyroiditis | ||
| PTC: Papillary thyroid cancer |
| ∗log2FC in expression of this searched gene in stem-like cells from each diseased tissue sample relative to stem-like cells in normal samples in each tissue plotted against the malignancy continuum. Samples are colored based on if they are from different disease stage. |
Top |
Malignant transformation related pathway analysis |
| Find out the enriched GO biological processes and KEGG pathways involved in transition from healthy to precancer to cancer |
| Tissue | Disease Stage | Enriched GO biological Processes |
| Colorectum | AD |  |
| Colorectum | SER |  |
| Colorectum | MSS |  |
| Colorectum | MSI-H |  |
| Colorectum | FAP |  |
| ∗Top 15 enriched GO BP terms are showed in the bar plot of each disease state in each tissue. Each row represents a significant GO biological process which is colored according to the -log10(p.adjust). |
| Page: 1 2 3 4 5 6 7 8 9 |
| GO ID | Tissue | Disease Stage | Description | Gene Ratio | Bg Ratio | pvalue | p.adjust | Count |
| GO:0016032111 | Esophagus | ESCC | viral process | 301/8552 | 415/18723 | 3.34e-29 | 1.32e-26 | 301 |
| GO:014001414 | Esophagus | ESCC | mitotic nuclear division | 218/8552 | 287/18723 | 6.17e-26 | 1.78e-23 | 218 |
| GO:001623617 | Esophagus | ESCC | macroautophagy | 216/8552 | 291/18723 | 1.94e-23 | 4.57e-21 | 216 |
| GO:005165617 | Esophagus | ESCC | establishment of organelle localization | 273/8552 | 390/18723 | 9.13e-23 | 1.81e-20 | 273 |
| GO:000007011 | Esophagus | ESCC | mitotic sister chromatid segregation | 138/8552 | 168/18723 | 1.37e-22 | 2.63e-20 | 138 |
| GO:00008194 | Esophagus | ESCC | sister chromatid segregation | 157/8552 | 202/18723 | 8.41e-21 | 1.33e-18 | 157 |
| GO:0019058111 | Esophagus | ESCC | viral life cycle | 226/8552 | 317/18723 | 1.17e-20 | 1.76e-18 | 226 |
| GO:000705911 | Esophagus | ESCC | chromosome segregation | 238/8552 | 346/18723 | 1.72e-18 | 1.82e-16 | 238 |
| GO:001605014 | Esophagus | ESCC | vesicle organization | 211/8552 | 300/18723 | 2.85e-18 | 2.87e-16 | 211 |
| GO:004477216 | Esophagus | ESCC | mitotic cell cycle phase transition | 281/8552 | 424/18723 | 4.63e-18 | 4.45e-16 | 281 |
| GO:001619715 | Esophagus | ESCC | endosomal transport | 168/8552 | 230/18723 | 2.28e-17 | 1.93e-15 | 168 |
| GO:190285015 | Esophagus | ESCC | microtubule cytoskeleton organization involved in mitosis | 116/8552 | 147/18723 | 1.25e-16 | 9.91e-15 | 116 |
| GO:000734615 | Esophagus | ESCC | regulation of mitotic cell cycle | 293/8552 | 457/18723 | 8.00e-16 | 5.64e-14 | 293 |
| GO:000705214 | Esophagus | ESCC | mitotic spindle organization | 97/8552 | 120/18723 | 2.17e-15 | 1.33e-13 | 97 |
| GO:000703417 | Esophagus | ESCC | vacuolar transport | 119/8552 | 157/18723 | 1.16e-14 | 6.30e-13 | 119 |
| GO:000705114 | Esophagus | ESCC | spindle organization | 134/8552 | 184/18723 | 5.70e-14 | 2.87e-12 | 134 |
| GO:005131011 | Esophagus | ESCC | metaphase plate congression | 58/8552 | 65/18723 | 1.81e-13 | 8.63e-12 | 58 |
| GO:000708011 | Esophagus | ESCC | mitotic metaphase plate congression | 47/8552 | 50/18723 | 3.15e-13 | 1.47e-11 | 47 |
| GO:00482853 | Esophagus | ESCC | organelle fission | 301/8552 | 488/18723 | 4.64e-13 | 2.12e-11 | 301 |
| GO:00988133 | Esophagus | ESCC | nuclear chromosome segregation | 187/8552 | 281/18723 | 1.00e-12 | 4.36e-11 | 187 |
| Page: 1 2 3 4 5 6 7 8 9 10 11 12 13 14 15 16 17 18 19 20 21 22 23 24 25 26 |
| Pathway ID | Tissue | Disease Stage | Description | Gene Ratio | Bg Ratio | pvalue | p.adjust | qvalue | Count |
| hsa04144210 | Esophagus | ESCC | Endocytosis | 186/4205 | 251/8465 | 9.74e-16 | 4.66e-14 | 2.39e-14 | 186 |
| hsa0414437 | Esophagus | ESCC | Endocytosis | 186/4205 | 251/8465 | 9.74e-16 | 4.66e-14 | 2.39e-14 | 186 |
| hsa0414412 | Liver | Cirrhotic | Endocytosis | 119/2530 | 251/8465 | 2.33e-09 | 4.56e-08 | 2.81e-08 | 119 |
| hsa0414413 | Liver | Cirrhotic | Endocytosis | 119/2530 | 251/8465 | 2.33e-09 | 4.56e-08 | 2.81e-08 | 119 |
| hsa0414422 | Liver | HCC | Endocytosis | 178/4020 | 251/8465 | 2.03e-14 | 5.22e-13 | 2.91e-13 | 178 |
| hsa0414432 | Liver | HCC | Endocytosis | 178/4020 | 251/8465 | 2.03e-14 | 5.22e-13 | 2.91e-13 | 178 |
| hsa0414427 | Oral cavity | OSCC | Endocytosis | 174/3704 | 251/8465 | 9.42e-17 | 4.51e-15 | 2.29e-15 | 174 |
| hsa04144112 | Oral cavity | OSCC | Endocytosis | 174/3704 | 251/8465 | 9.42e-17 | 4.51e-15 | 2.29e-15 | 174 |
| hsa0414428 | Oral cavity | LP | Endocytosis | 121/2418 | 251/8465 | 1.89e-11 | 3.70e-10 | 2.38e-10 | 121 |
| hsa0421714 | Oral cavity | LP | Necroptosis | 59/2418 | 159/8465 | 1.15e-02 | 3.91e-02 | 2.52e-02 | 59 |
| hsa0414436 | Oral cavity | LP | Endocytosis | 121/2418 | 251/8465 | 1.89e-11 | 3.70e-10 | 2.38e-10 | 121 |
| hsa0421715 | Oral cavity | LP | Necroptosis | 59/2418 | 159/8465 | 1.15e-02 | 3.91e-02 | 2.52e-02 | 59 |
| hsa0414425 | Prostate | BPH | Endocytosis | 89/1718 | 251/8465 | 1.06e-08 | 1.29e-07 | 7.99e-08 | 89 |
| hsa0421712 | Prostate | BPH | Necroptosis | 45/1718 | 159/8465 | 9.23e-03 | 2.85e-02 | 1.76e-02 | 45 |
| hsa04144111 | Prostate | BPH | Endocytosis | 89/1718 | 251/8465 | 1.06e-08 | 1.29e-07 | 7.99e-08 | 89 |
| hsa0421713 | Prostate | BPH | Necroptosis | 45/1718 | 159/8465 | 9.23e-03 | 2.85e-02 | 1.76e-02 | 45 |
| hsa0414426 | Prostate | Tumor | Endocytosis | 92/1791 | 251/8465 | 7.83e-09 | 1.04e-07 | 6.43e-08 | 92 |
| hsa0421721 | Prostate | Tumor | Necroptosis | 46/1791 | 159/8465 | 1.20e-02 | 3.68e-02 | 2.28e-02 | 46 |
| hsa0414435 | Prostate | Tumor | Endocytosis | 92/1791 | 251/8465 | 7.83e-09 | 1.04e-07 | 6.43e-08 | 92 |
| hsa0421731 | Prostate | Tumor | Necroptosis | 46/1791 | 159/8465 | 1.20e-02 | 3.68e-02 | 2.28e-02 | 46 |
| Page: 1 |
Top |
Cell-cell communication analysis |
| Identification of potential cell-cell interactions between two cell types and their ligand-receptor pairs for different disease states |
| Ligand | Receptor | LRpair | Pathway | Tissue | Disease Stage |
| Page: 1 |
Top |
Single-cell gene regulatory network inference analysis |
| Find out the significant the regulons (TFs) and the target genes of each regulon across cell types for different disease states |
| TF | Cell Type | Tissue | Disease Stage | Target Gene | RSS | Regulon Activity |
| ∗The dot plots of a searched regulon are shown for all cell subpopulations in each disease state of each tissue based on the regulon specific score inferred using pySCENIC and by calculating the average expression. |
| Page: 1 |
Top |
Somatic mutation of malignant transformation related genes |
| Annotation of somatic variants for genes involved in malignant transformation |
| Hugo Symbol | Variant Class | Variant Classification | dbSNP RS | HGVSc | HGVSp | HGVSp Short | SWISSPROT | BIOTYPE | SIFT | PolyPhen | Tumor Sample Barcode | Tissue | Histology | Sex | Age | Stage | Therapy Types | Drugs | Outcome |
| CHMP4C | SNV | Missense_Mutation | rs757068214 | c.550N>T | p.Arg184Cys | p.R184C | Q96CF2 | protein_coding | deleterious(0.03) | possibly_damaging(0.849) | TCGA-D8-A1JM-01 | Breast | breast invasive carcinoma | Female | <65 | I/II | ChemotherapyHormone Therapy | doxorubicine | SD |
| CHMP4C | SNV | Missense_Mutation | novel | c.439N>C | p.Glu147Gln | p.E147Q | Q96CF2 | protein_coding | deleterious(0.03) | benign(0.285) | TCGA-DG-A2KJ-01 | Cervix | cervical & endocervical cancer | Female | <65 | III/IV | Chemotherapy | cisplatin | SD |
| CHMP4C | SNV | Missense_Mutation | rs755091245 | c.21C>A | p.Phe7Leu | p.F7L | Q96CF2 | protein_coding | tolerated(1) | benign(0) | TCGA-AA-A00N-01 | Colorectum | colon adenocarcinoma | Male | >=65 | I/II | Unknown | Unknown | PD |
| CHMP4C | SNV | Missense_Mutation | novel | c.356N>C | p.Val119Ala | p.V119A | Q96CF2 | protein_coding | tolerated(1) | benign(0.009) | TCGA-AZ-6605-01 | Colorectum | colon adenocarcinoma | Male | >=65 | III/IV | Chemotherapy | folfox | SD |
| CHMP4C | SNV | Missense_Mutation | c.409N>A | p.Glu137Lys | p.E137K | Q96CF2 | protein_coding | deleterious(0) | probably_damaging(0.973) | TCGA-CK-4951-01 | Colorectum | colon adenocarcinoma | Female | >=65 | I/II | Unknown | Unknown | PD | |
| CHMP4C | SNV | Missense_Mutation | novel | c.537N>T | p.Lys179Asn | p.K179N | Q96CF2 | protein_coding | tolerated(0.44) | benign(0.02) | TCGA-AG-A002-01 | Colorectum | rectum adenocarcinoma | Male | <65 | I/II | Unknown | Unknown | SD |
| CHMP4C | SNV | Missense_Mutation | rs142794802 | c.551G>A | p.Arg184His | p.R184H | Q96CF2 | protein_coding | tolerated(0.13) | benign(0.067) | TCGA-A5-A0G2-01 | Endometrium | uterine corpus endometrioid carcinoma | Female | <65 | III/IV | Unknown | Unknown | SD |
| CHMP4C | SNV | Missense_Mutation | novel | c.53N>T | p.Ala18Val | p.A18V | Q96CF2 | protein_coding | tolerated(0.19) | benign(0.01) | TCGA-AJ-A3BH-01 | Endometrium | uterine corpus endometrioid carcinoma | Female | Unknown | I/II | Unknown | Unknown | SD |
| CHMP4C | SNV | Missense_Mutation | rs562691343 | c.632N>A | p.Arg211Gln | p.R211Q | Q96CF2 | protein_coding | tolerated(0.25) | benign(0.019) | TCGA-AP-A0LM-01 | Endometrium | uterine corpus endometrioid carcinoma | Female | <65 | III/IV | Chemotherapy | cisplatin | SD |
| CHMP4C | SNV | Missense_Mutation | rs562691343 | c.632G>A | p.Arg211Gln | p.R211Q | Q96CF2 | protein_coding | tolerated(0.25) | benign(0.019) | TCGA-AP-A1DV-01 | Endometrium | uterine corpus endometrioid carcinoma | Female | <65 | I/II | Unknown | Unknown | SD |
| Page: 1 2 3 |
Top |
Related drugs of malignant transformation related genes |
| Identification of chemicals and drugs interact with genes involved in malignant transfromation |
| (DGIdb 4.0) |
| Entrez ID | Symbol | Category | Interaction Types | Drug Claim Name | Drug Name | PMIDs |
| Page: 1 |

Copyright 2023-Present -The University of Texas Health Science Center at Houston |