
|
|||||
|
 | |
| |
| |
| |
| |
| |
|
Gene: CHMP3 |
Gene summary for CHMP3 |
| Gene information | Species | Human | Gene symbol | CHMP3 | Gene ID | 51652 |
| Gene name | charged multivesicular body protein 3 | |
| Gene Alias | CGI-149 | |
| Cytomap | 2p11.2 | |
| Gene Type | protein-coding | GO ID | GO:0000226 | UniProtAcc | Q9Y3E7 |
Top |
Malignant transformation analysis |
| Identification of the aberrant gene expression in precancerous and cancerous lesions by comparing the gene expression of stem-like cells in diseased tissues with normal stem cells |
| Entrez ID | Symbol | Replicates | Species | Organ | Tissue | Adj P-value | Log2FC | Malignancy |
| 51652 | CHMP3 | HTA11_3410_2000001011 | Human | Colorectum | AD | 1.05e-34 | 7.46e-01 | 0.0155 |
| 51652 | CHMP3 | HTA11_2487_2000001011 | Human | Colorectum | SER | 8.00e-31 | 1.08e+00 | -0.1808 |
| 51652 | CHMP3 | HTA11_2951_2000001011 | Human | Colorectum | AD | 3.69e-05 | 6.60e-01 | 0.0216 |
| 51652 | CHMP3 | HTA11_1938_2000001011 | Human | Colorectum | AD | 3.72e-33 | 1.28e+00 | -0.0811 |
| 51652 | CHMP3 | HTA11_78_2000001011 | Human | Colorectum | AD | 4.39e-32 | 1.23e+00 | -0.1088 |
| 51652 | CHMP3 | HTA11_347_2000001011 | Human | Colorectum | AD | 3.07e-65 | 1.44e+00 | -0.1954 |
| 51652 | CHMP3 | HTA11_411_2000001011 | Human | Colorectum | SER | 1.06e-10 | 1.62e+00 | -0.2602 |
| 51652 | CHMP3 | HTA11_2112_2000001011 | Human | Colorectum | SER | 1.10e-10 | 1.14e+00 | -0.2196 |
| 51652 | CHMP3 | HTA11_3361_2000001011 | Human | Colorectum | AD | 5.00e-13 | 7.38e-01 | -0.1207 |
| 51652 | CHMP3 | HTA11_83_2000001011 | Human | Colorectum | SER | 4.73e-22 | 1.19e+00 | -0.1526 |
| 51652 | CHMP3 | HTA11_696_2000001011 | Human | Colorectum | AD | 1.06e-52 | 9.70e-01 | -0.1464 |
| 51652 | CHMP3 | HTA11_866_2000001011 | Human | Colorectum | AD | 1.05e-36 | 7.79e-01 | -0.1001 |
| 51652 | CHMP3 | HTA11_1391_2000001011 | Human | Colorectum | AD | 2.53e-38 | 1.20e+00 | -0.059 |
| 51652 | CHMP3 | HTA11_2992_2000001011 | Human | Colorectum | SER | 3.13e-21 | 1.28e+00 | -0.1706 |
| 51652 | CHMP3 | HTA11_5212_2000001011 | Human | Colorectum | AD | 1.27e-21 | 1.24e+00 | -0.2061 |
| 51652 | CHMP3 | HTA11_5216_2000001011 | Human | Colorectum | SER | 5.68e-14 | 1.01e+00 | -0.1462 |
| 51652 | CHMP3 | HTA11_546_2000001011 | Human | Colorectum | AD | 3.50e-17 | 9.44e-01 | -0.0842 |
| 51652 | CHMP3 | HTA11_9341_2000001011 | Human | Colorectum | SER | 4.60e-04 | 7.17e-01 | -0.00410000000000005 |
| 51652 | CHMP3 | HTA11_7862_2000001011 | Human | Colorectum | AD | 8.84e-11 | 7.75e-01 | -0.0179 |
| 51652 | CHMP3 | HTA11_866_3004761011 | Human | Colorectum | AD | 6.36e-24 | 8.07e-01 | 0.096 |
| Page: 1 2 3 4 5 6 7 8 9 10 |
| Tissue | Expression Dynamics | Abbreviation |
| Colorectum (GSE201348) | 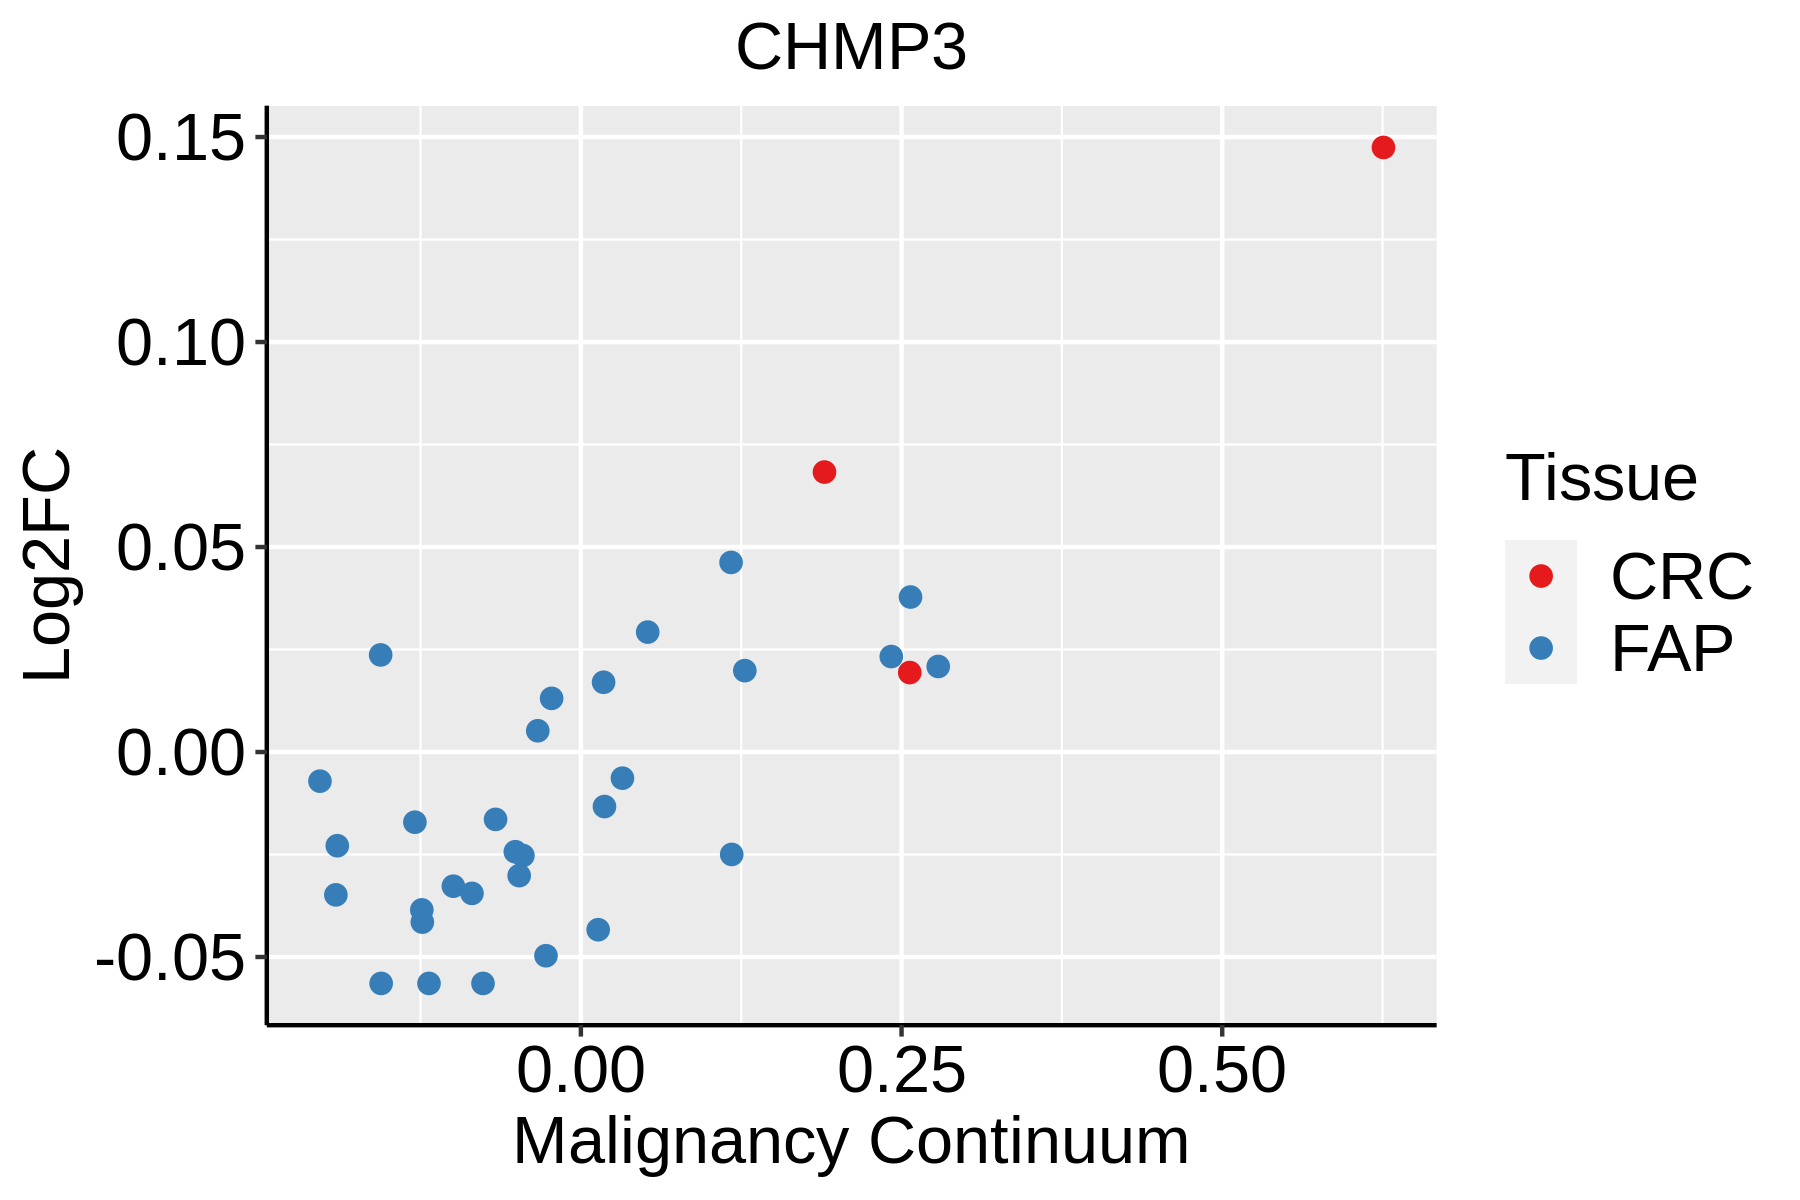 | FAP: Familial adenomatous polyposis |
| CRC: Colorectal cancer | ||
| Colorectum (HTA11) |  | AD: Adenomas |
| SER: Sessile serrated lesions | ||
| MSI-H: Microsatellite-high colorectal cancer | ||
| MSS: Microsatellite stable colorectal cancer | ||
| Endometrium | 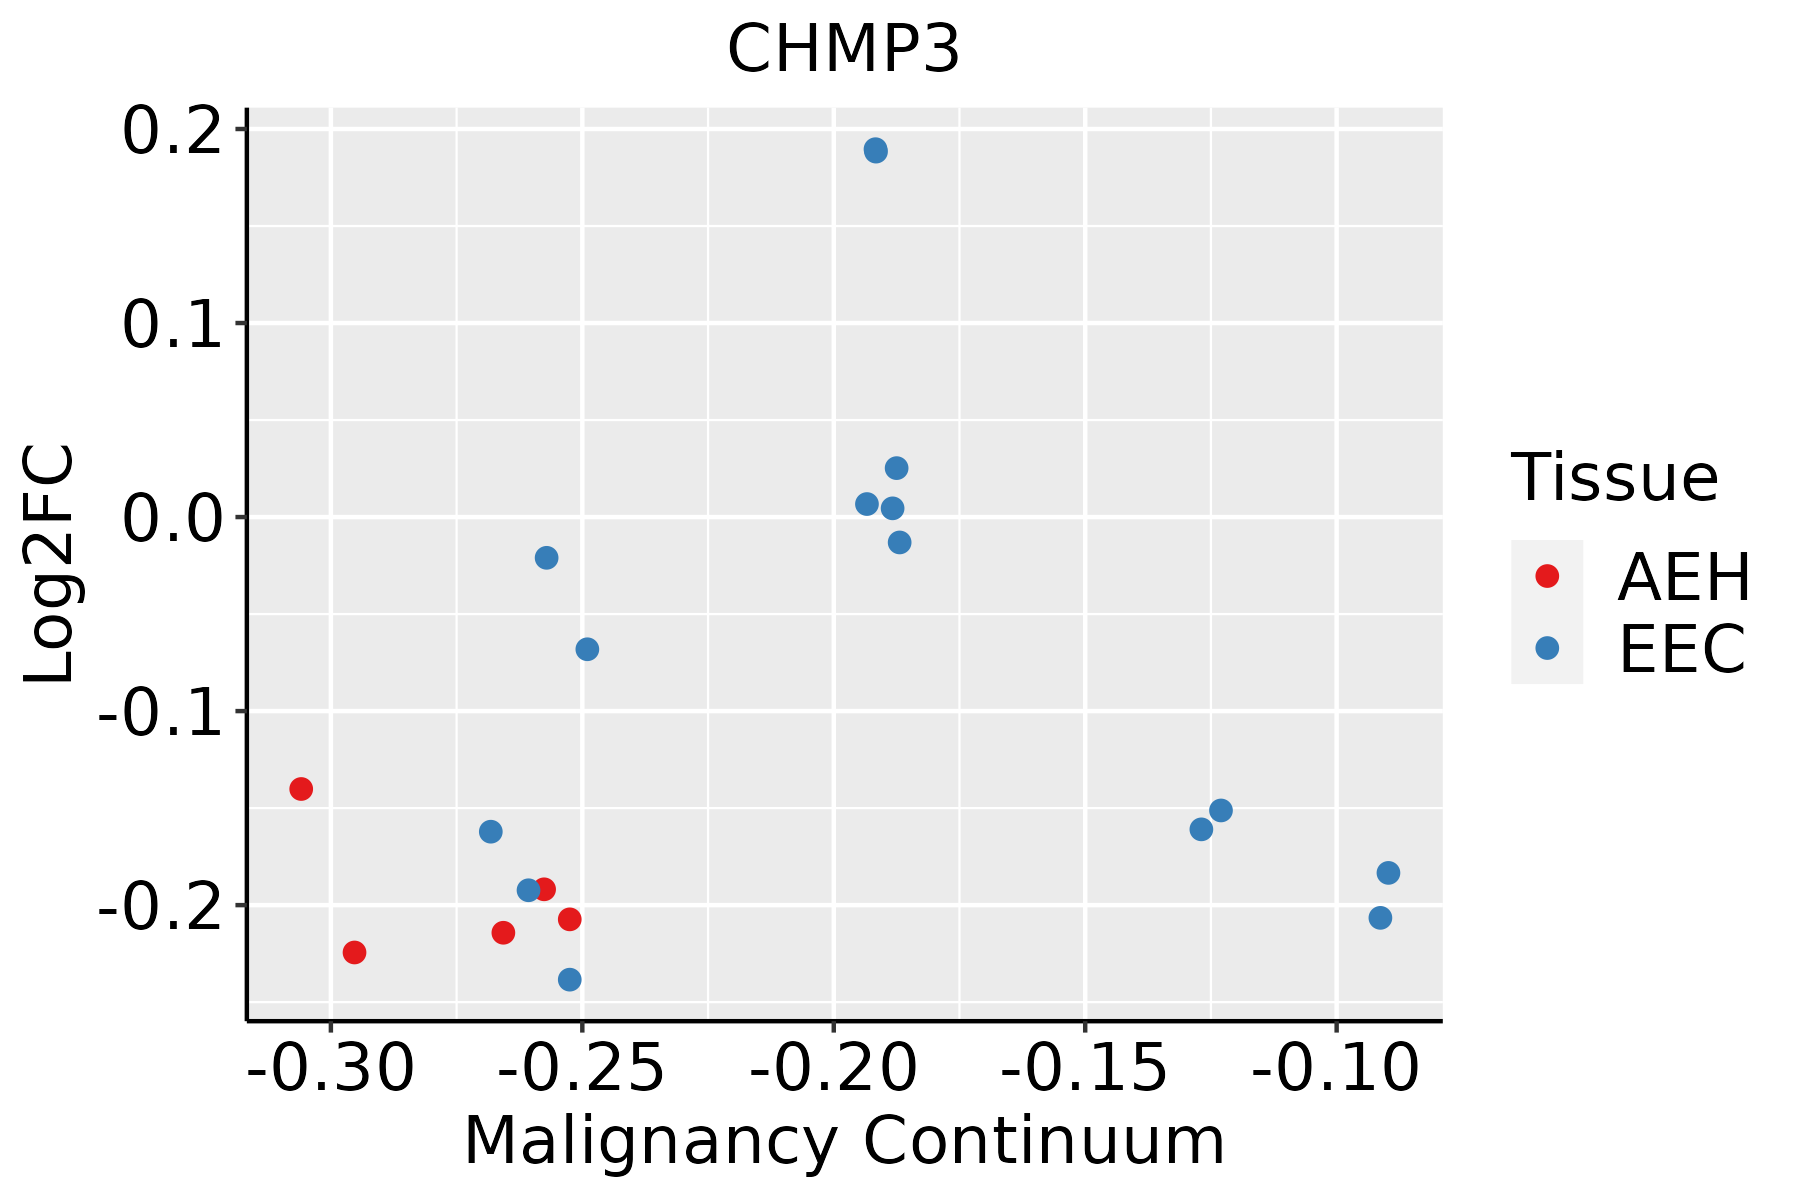 | AEH: Atypical endometrial hyperplasia |
| EEC: Endometrioid Cancer | ||
| Esophagus | 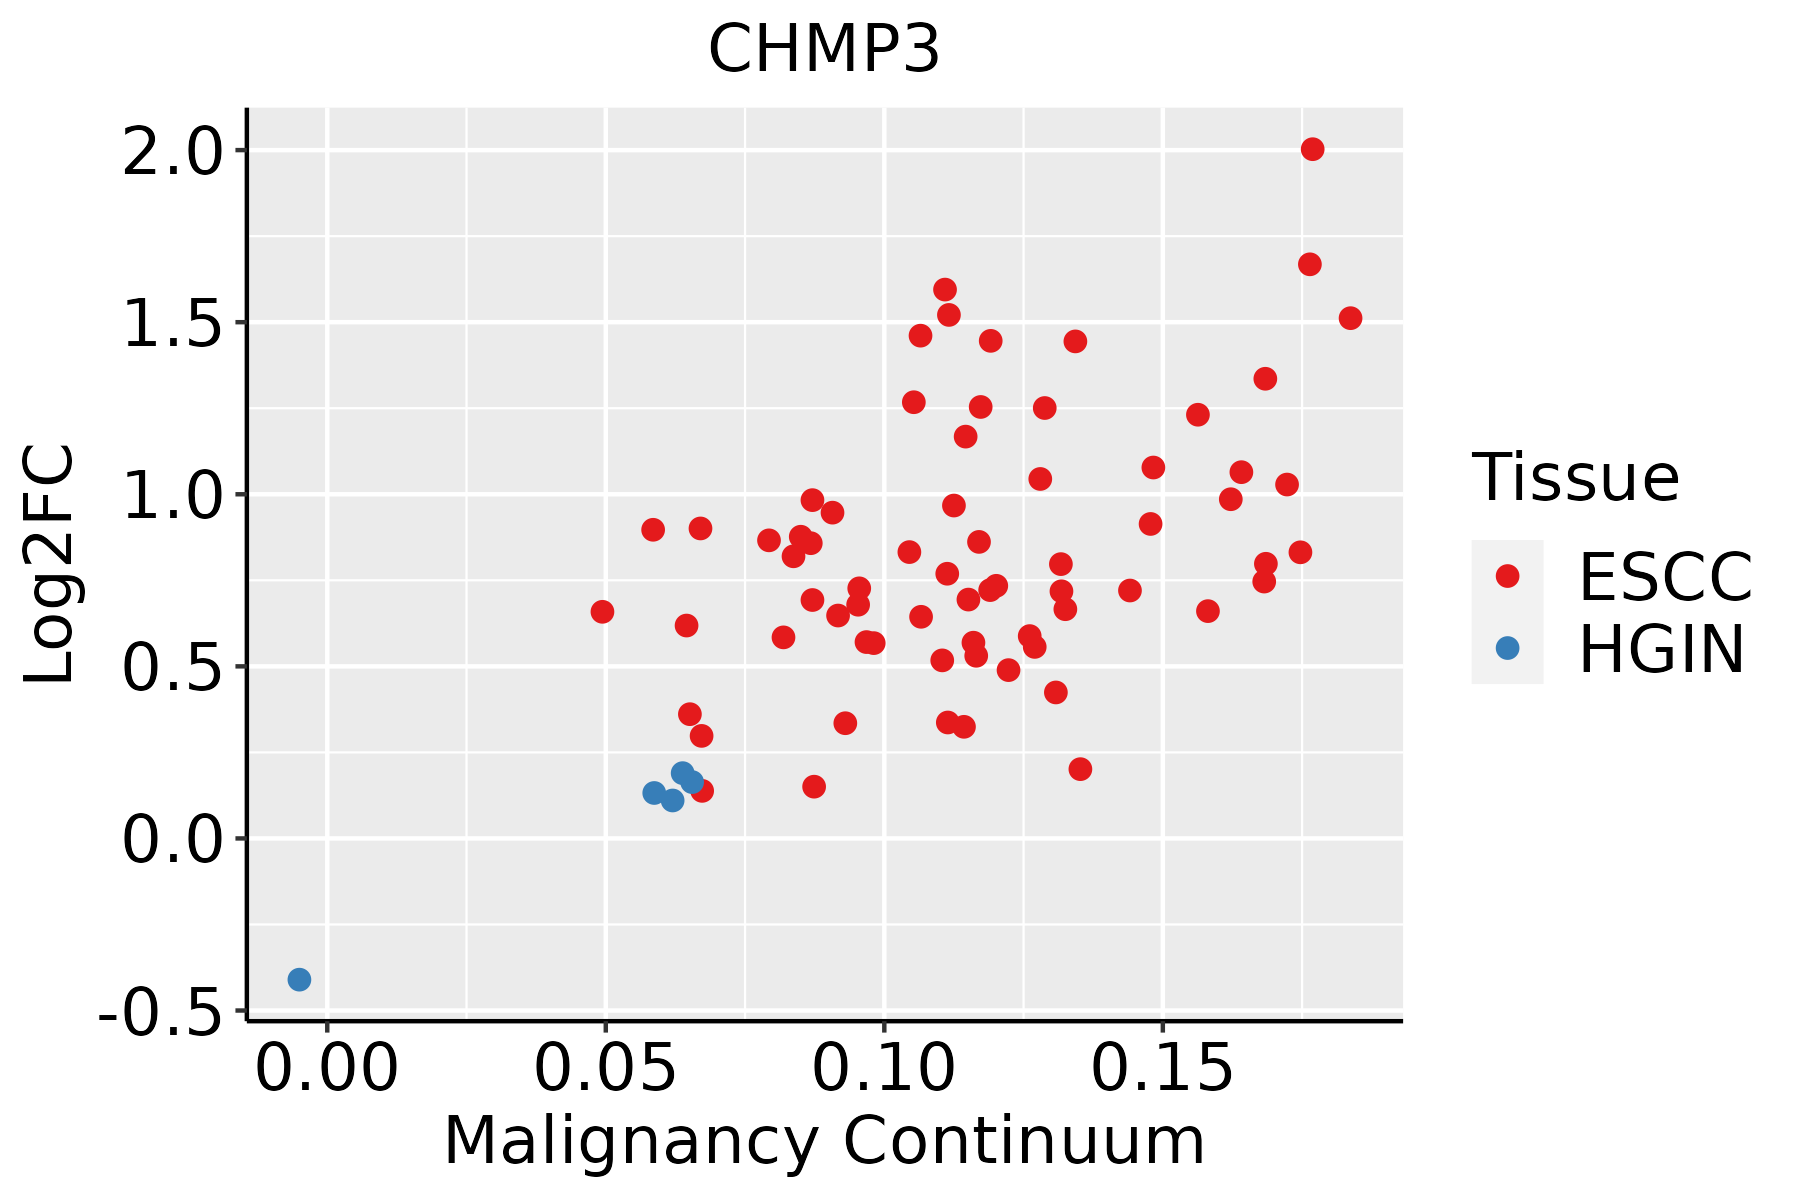 | ESCC: Esophageal squamous cell carcinoma |
| HGIN: High-grade intraepithelial neoplasias | ||
| LGIN: Low-grade intraepithelial neoplasias | ||
| Liver | 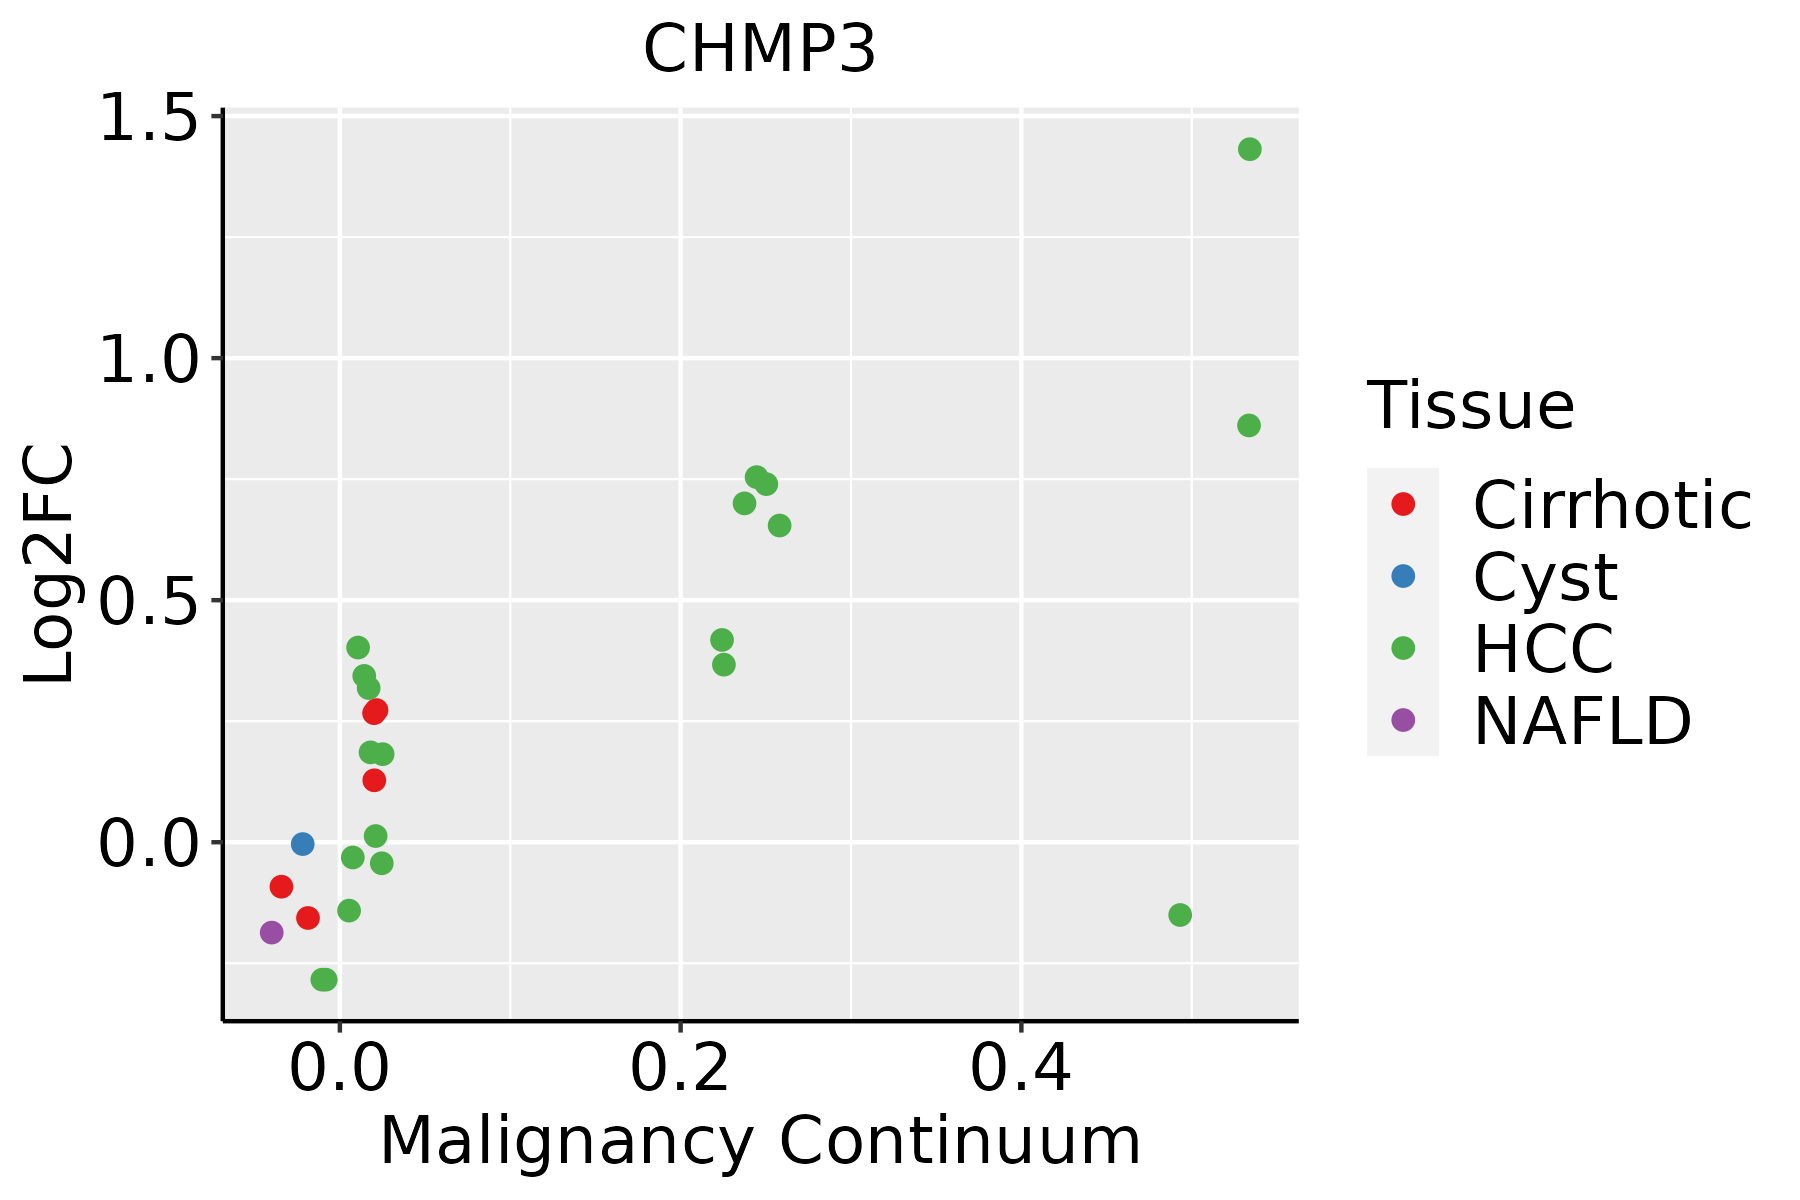 | HCC: Hepatocellular carcinoma |
| NAFLD: Non-alcoholic fatty liver disease | ||
| Oral Cavity |  | EOLP: Erosive Oral lichen planus |
| LP: leukoplakia | ||
| NEOLP: Non-erosive oral lichen planus | ||
| OSCC: Oral squamous cell carcinoma | ||
| Prostate |  | BPH: Benign Prostatic Hyperplasia |
| Skin | 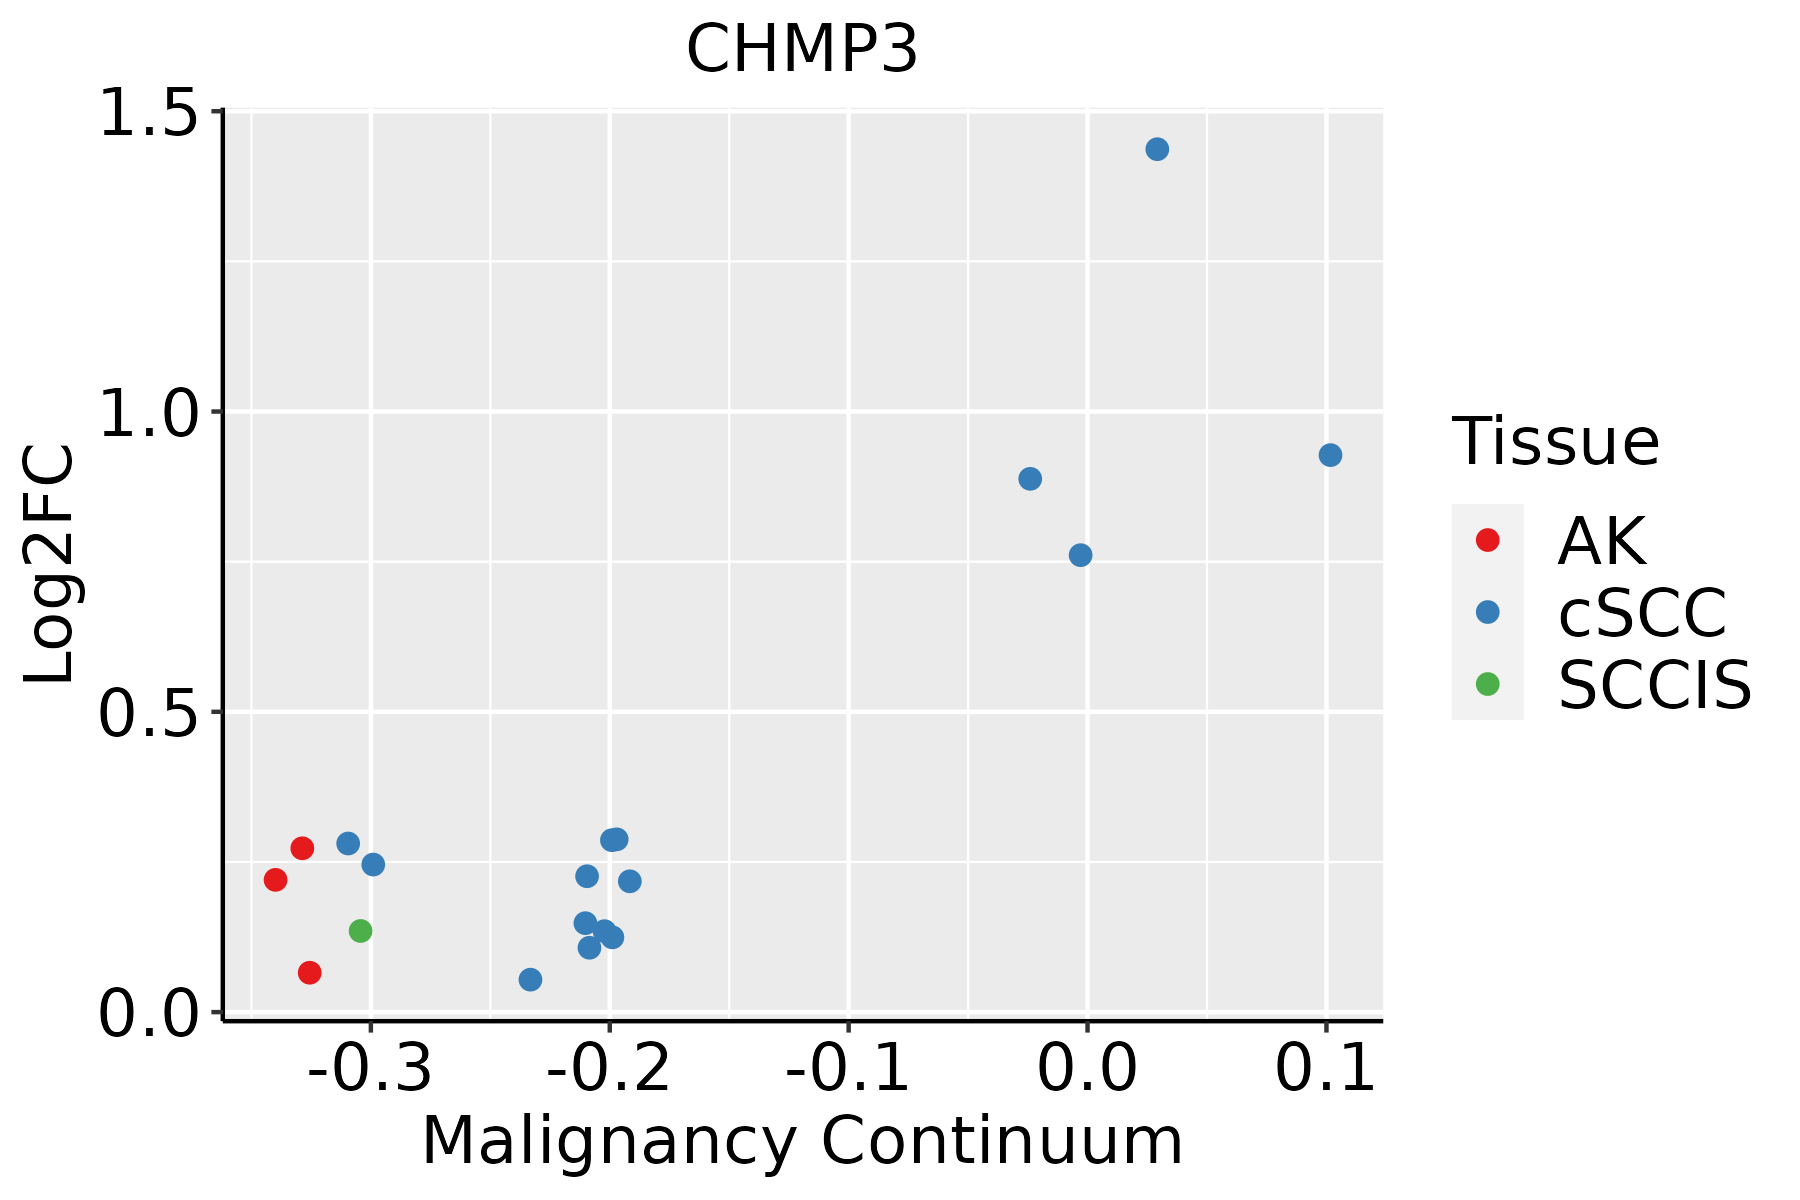 | AK: Actinic keratosis |
| cSCC: Cutaneous squamous cell carcinoma | ||
| SCCIS:squamous cell carcinoma in situ | ||
| Thyroid | 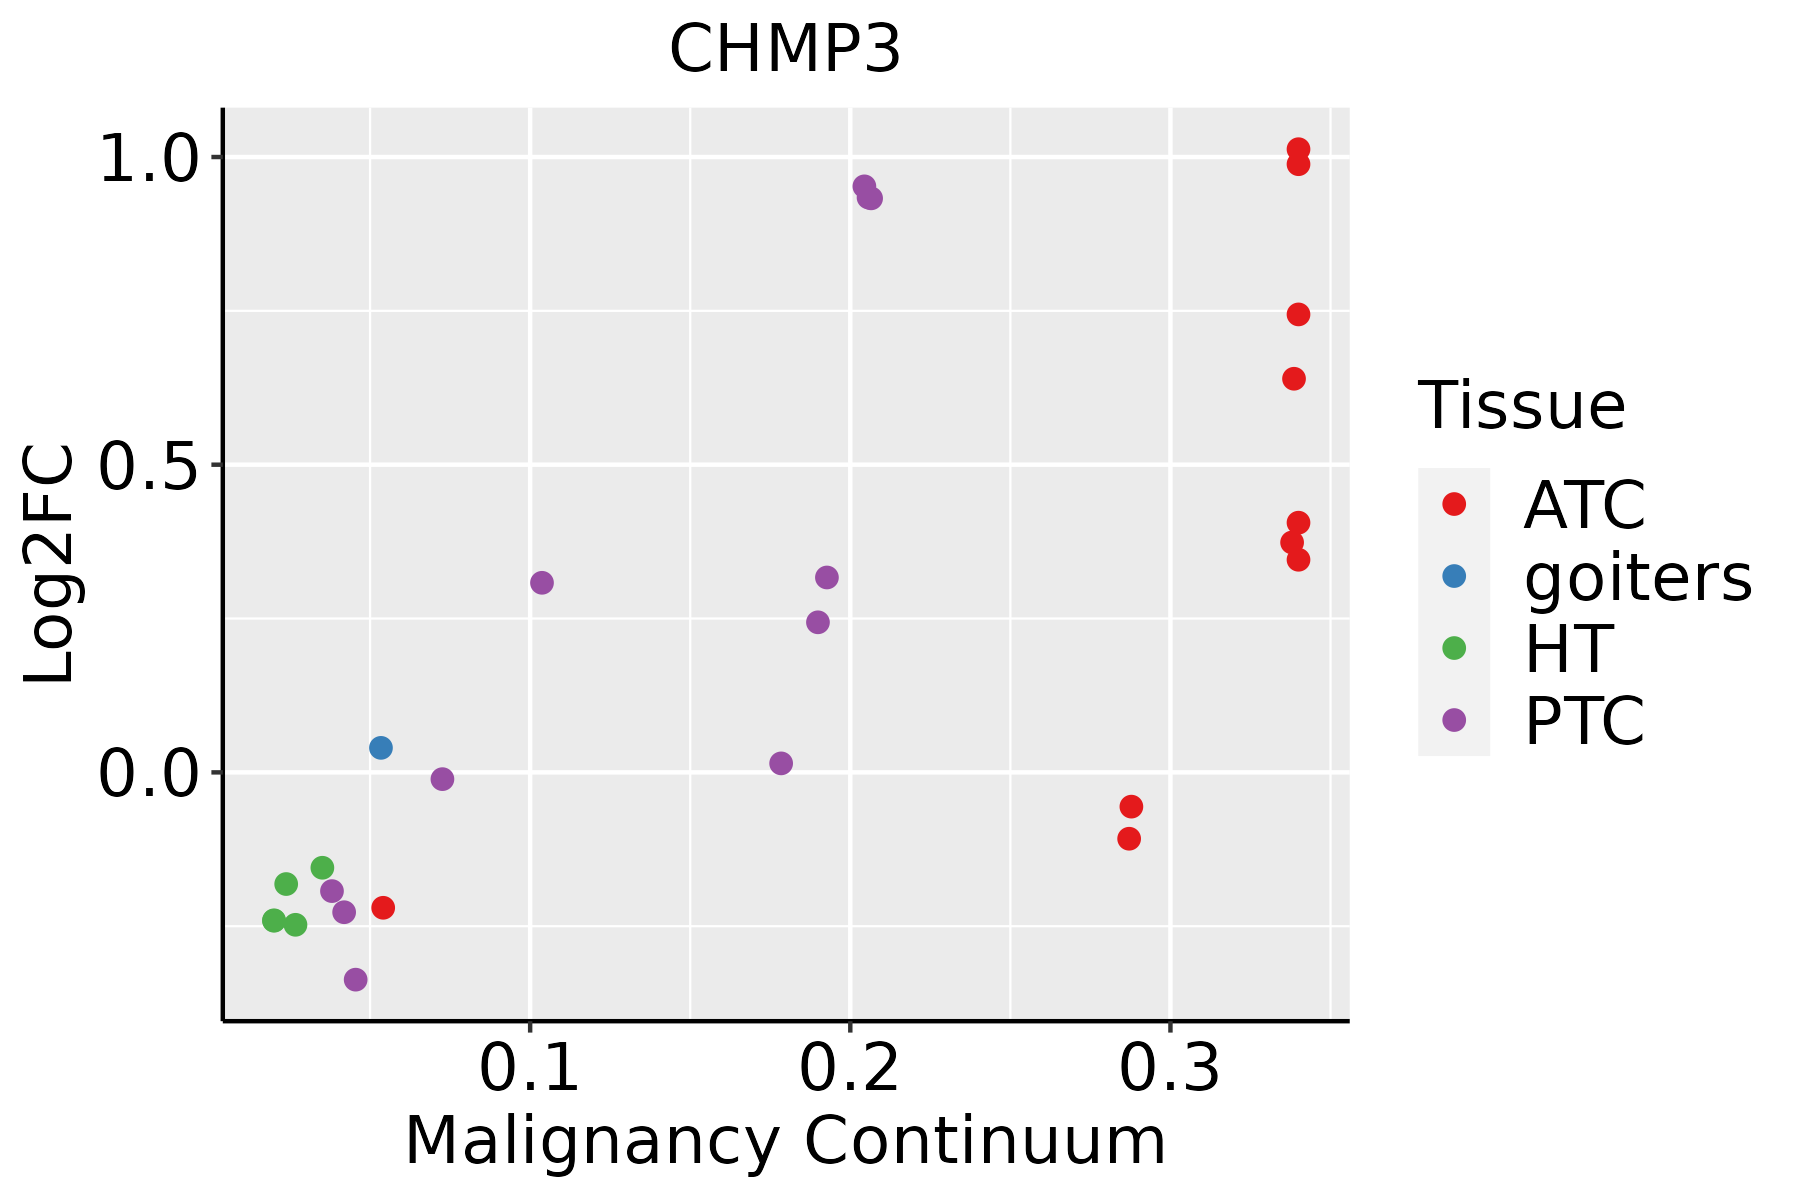 | ATC: Anaplastic thyroid cancer |
| HT: Hashimoto's thyroiditis | ||
| PTC: Papillary thyroid cancer |
| ∗log2FC in expression of this searched gene in stem-like cells from each diseased tissue sample relative to stem-like cells in normal samples in each tissue plotted against the malignancy continuum. Samples are colored based on if they are from different disease stage. |
Top |
Malignant transformation related pathway analysis |
| Find out the enriched GO biological processes and KEGG pathways involved in transition from healthy to precancer to cancer |
| Tissue | Disease Stage | Enriched GO biological Processes |
| Colorectum | AD |  |
| Colorectum | SER |  |
| Colorectum | MSS |  |
| Colorectum | MSI-H |  |
| Colorectum | FAP |  |
| ∗Top 15 enriched GO BP terms are showed in the bar plot of each disease state in each tissue. Each row represents a significant GO biological process which is colored according to the -log10(p.adjust). |
| Page: 1 2 3 4 5 6 7 8 9 |
| GO ID | Tissue | Disease Stage | Description | Gene Ratio | Bg Ratio | pvalue | p.adjust | Count |
| GO:0016032 | Colorectum | AD | viral process | 168/3918 | 415/18723 | 4.67e-20 | 3.66e-17 | 168 |
| GO:0032535 | Colorectum | AD | regulation of cellular component size | 142/3918 | 383/18723 | 1.74e-13 | 3.41e-11 | 142 |
| GO:0019058 | Colorectum | AD | viral life cycle | 119/3918 | 317/18723 | 6.18e-12 | 8.23e-10 | 119 |
| GO:0051258 | Colorectum | AD | protein polymerization | 112/3918 | 297/18723 | 1.85e-11 | 2.27e-09 | 112 |
| GO:0016197 | Colorectum | AD | endosomal transport | 90/3918 | 230/18723 | 1.88e-10 | 1.73e-08 | 90 |
| GO:0022411 | Colorectum | AD | cellular component disassembly | 147/3918 | 443/18723 | 8.53e-10 | 6.76e-08 | 147 |
| GO:0016482 | Colorectum | AD | cytosolic transport | 68/3918 | 168/18723 | 6.00e-09 | 3.72e-07 | 68 |
| GO:0016236 | Colorectum | AD | macroautophagy | 103/3918 | 291/18723 | 6.76e-09 | 4.15e-07 | 103 |
| GO:0032984 | Colorectum | AD | protein-containing complex disassembly | 81/3918 | 224/18723 | 9.41e-08 | 4.65e-06 | 81 |
| GO:0044403 | Colorectum | AD | biological process involved in symbiotic interaction | 99/3918 | 290/18723 | 1.02e-07 | 4.93e-06 | 99 |
| GO:0016050 | Colorectum | AD | vesicle organization | 101/3918 | 300/18723 | 1.65e-07 | 7.17e-06 | 101 |
| GO:0007034 | Colorectum | AD | vacuolar transport | 60/3918 | 157/18723 | 4.97e-07 | 1.85e-05 | 60 |
| GO:0051701 | Colorectum | AD | biological process involved in interaction with host | 73/3918 | 203/18723 | 5.08e-07 | 1.88e-05 | 73 |
| GO:0032386 | Colorectum | AD | regulation of intracellular transport | 109/3918 | 337/18723 | 5.33e-07 | 1.95e-05 | 109 |
| GO:0048524 | Colorectum | AD | positive regulation of viral process | 31/3918 | 65/18723 | 1.33e-06 | 4.23e-05 | 31 |
| GO:0052126 | Colorectum | AD | movement in host environment | 63/3918 | 175/18723 | 2.85e-06 | 8.11e-05 | 63 |
| GO:0050792 | Colorectum | AD | regulation of viral process | 59/3918 | 164/18723 | 5.95e-06 | 1.52e-04 | 59 |
| GO:0036257 | Colorectum | AD | multivesicular body organization | 17/3918 | 31/18723 | 3.45e-05 | 6.29e-04 | 17 |
| GO:0000910 | Colorectum | AD | cytokinesis | 59/3918 | 173/18723 | 3.74e-05 | 6.75e-04 | 59 |
| GO:0071985 | Colorectum | AD | multivesicular body sorting pathway | 19/3918 | 37/18723 | 4.08e-05 | 7.26e-04 | 19 |
| Page: 1 2 3 4 5 6 7 8 9 10 11 12 13 14 15 16 17 18 19 20 21 22 23 24 25 26 27 28 29 30 31 32 33 34 35 36 37 38 39 40 41 |
| Pathway ID | Tissue | Disease Stage | Description | Gene Ratio | Bg Ratio | pvalue | p.adjust | qvalue | Count |
| hsa04144 | Colorectum | AD | Endocytosis | 111/2092 | 251/8465 | 5.95e-12 | 1.42e-10 | 9.08e-11 | 111 |
| hsa041441 | Colorectum | AD | Endocytosis | 111/2092 | 251/8465 | 5.95e-12 | 1.42e-10 | 9.08e-11 | 111 |
| hsa041442 | Colorectum | SER | Endocytosis | 81/1580 | 251/8465 | 1.14e-07 | 2.36e-06 | 1.71e-06 | 81 |
| hsa04217 | Colorectum | SER | Necroptosis | 47/1580 | 159/8465 | 5.21e-04 | 4.44e-03 | 3.22e-03 | 47 |
| hsa041443 | Colorectum | SER | Endocytosis | 81/1580 | 251/8465 | 1.14e-07 | 2.36e-06 | 1.71e-06 | 81 |
| hsa042171 | Colorectum | SER | Necroptosis | 47/1580 | 159/8465 | 5.21e-04 | 4.44e-03 | 3.22e-03 | 47 |
| hsa041444 | Colorectum | MSS | Endocytosis | 102/1875 | 251/8465 | 1.85e-11 | 4.43e-10 | 2.71e-10 | 102 |
| hsa041445 | Colorectum | MSS | Endocytosis | 102/1875 | 251/8465 | 1.85e-11 | 4.43e-10 | 2.71e-10 | 102 |
| hsa0414420 | Endometrium | AEH | Endocytosis | 56/1197 | 251/8465 | 2.58e-04 | 2.15e-03 | 1.57e-03 | 56 |
| hsa04144110 | Endometrium | AEH | Endocytosis | 56/1197 | 251/8465 | 2.58e-04 | 2.15e-03 | 1.57e-03 | 56 |
| hsa0414424 | Endometrium | EEC | Endocytosis | 57/1237 | 251/8465 | 3.34e-04 | 2.82e-03 | 2.10e-03 | 57 |
| hsa0414434 | Endometrium | EEC | Endocytosis | 57/1237 | 251/8465 | 3.34e-04 | 2.82e-03 | 2.10e-03 | 57 |
| hsa04144210 | Esophagus | ESCC | Endocytosis | 186/4205 | 251/8465 | 9.74e-16 | 4.66e-14 | 2.39e-14 | 186 |
| hsa0414437 | Esophagus | ESCC | Endocytosis | 186/4205 | 251/8465 | 9.74e-16 | 4.66e-14 | 2.39e-14 | 186 |
| hsa0414412 | Liver | Cirrhotic | Endocytosis | 119/2530 | 251/8465 | 2.33e-09 | 4.56e-08 | 2.81e-08 | 119 |
| hsa0414413 | Liver | Cirrhotic | Endocytosis | 119/2530 | 251/8465 | 2.33e-09 | 4.56e-08 | 2.81e-08 | 119 |
| hsa0414422 | Liver | HCC | Endocytosis | 178/4020 | 251/8465 | 2.03e-14 | 5.22e-13 | 2.91e-13 | 178 |
| hsa0414432 | Liver | HCC | Endocytosis | 178/4020 | 251/8465 | 2.03e-14 | 5.22e-13 | 2.91e-13 | 178 |
| hsa0414427 | Oral cavity | OSCC | Endocytosis | 174/3704 | 251/8465 | 9.42e-17 | 4.51e-15 | 2.29e-15 | 174 |
| hsa04144112 | Oral cavity | OSCC | Endocytosis | 174/3704 | 251/8465 | 9.42e-17 | 4.51e-15 | 2.29e-15 | 174 |
| Page: 1 2 |
Top |
Cell-cell communication analysis |
| Identification of potential cell-cell interactions between two cell types and their ligand-receptor pairs for different disease states |
| Ligand | Receptor | LRpair | Pathway | Tissue | Disease Stage |
| Page: 1 |
Top |
Single-cell gene regulatory network inference analysis |
| Find out the significant the regulons (TFs) and the target genes of each regulon across cell types for different disease states |
| TF | Cell Type | Tissue | Disease Stage | Target Gene | RSS | Regulon Activity |
| ∗The dot plots of a searched regulon are shown for all cell subpopulations in each disease state of each tissue based on the regulon specific score inferred using pySCENIC and by calculating the average expression. |
| Page: 1 |
Top |
Somatic mutation of malignant transformation related genes |
| Annotation of somatic variants for genes involved in malignant transformation |
| Hugo Symbol | Variant Class | Variant Classification | dbSNP RS | HGVSc | HGVSp | HGVSp Short | SWISSPROT | BIOTYPE | SIFT | PolyPhen | Tumor Sample Barcode | Tissue | Histology | Sex | Age | Stage | Therapy Types | Drugs | Outcome |
| CHMP3 | SNV | Missense_Mutation | c.83N>A | p.Arg28Lys | p.R28K | Q9Y3E7 | protein_coding | deleterious(0.02) | benign(0.146) | TCGA-BH-A0B0-01 | Breast | breast invasive carcinoma | Female | <65 | I/II | Chemotherapy | adriamycin | CR | |
| CHMP3 | insertion | In_Frame_Ins | novel | c.11_12insCCCACATCTCAGCTCTGTGATCTC | p.Phe4_Gly5insProHisLeuSerSerValIleSer | p.F4_G5insPHLSSVIS | Q9Y3E7 | protein_coding | TCGA-A7-A0CE-01 | Breast | breast invasive carcinoma | Female | <65 | I/II | Chemotherapy | adriamycin | SD | ||
| CHMP3 | SNV | Missense_Mutation | c.83N>A | p.Arg28Lys | p.R28K | Q9Y3E7 | protein_coding | deleterious(0.02) | benign(0.146) | TCGA-AZ-4315-01 | Colorectum | colon adenocarcinoma | Male | <65 | I/II | Unknown | Unknown | SD | |
| CHMP3 | SNV | Missense_Mutation | rs368950086 | c.287N>T | p.Ala96Val | p.A96V | Q9Y3E7 | protein_coding | deleterious(0.03) | possibly_damaging(0.858) | TCGA-A5-A0G2-01 | Endometrium | uterine corpus endometrioid carcinoma | Female | <65 | III/IV | Unknown | Unknown | SD |
| CHMP3 | SNV | Missense_Mutation | novel | c.554C>A | p.Thr185Asn | p.T185N | Q9Y3E7 | protein_coding | deleterious(0.04) | possibly_damaging(0.817) | TCGA-A5-A1OF-01 | Endometrium | uterine corpus endometrioid carcinoma | Female | <65 | I/II | Unknown | Unknown | SD |
| CHMP3 | SNV | Missense_Mutation | novel | c.63N>T | p.Leu21Phe | p.L21F | Q9Y3E7 | protein_coding | tolerated(0.7) | benign(0.138) | TCGA-AP-A1DV-01 | Endometrium | uterine corpus endometrioid carcinoma | Female | <65 | I/II | Unknown | Unknown | SD |
| CHMP3 | SNV | Missense_Mutation | c.466N>A | p.Glu156Lys | p.E156K | Q9Y3E7 | protein_coding | deleterious(0.04) | benign(0.195) | TCGA-B5-A0JY-01 | Endometrium | uterine corpus endometrioid carcinoma | Female | <65 | III/IV | Chemotherapy | doxorubicin | SD | |
| CHMP3 | SNV | Missense_Mutation | novel | c.201N>T | p.Met67Ile | p.M67I | Q9Y3E7 | protein_coding | tolerated(1) | benign(0.003) | TCGA-B5-A11N-01 | Endometrium | uterine corpus endometrioid carcinoma | Female | >=65 | I/II | Unknown | Unknown | SD |
| CHMP3 | SNV | Missense_Mutation | novel | c.337N>A | p.Ala113Thr | p.A113T | Q9Y3E7 | protein_coding | tolerated(0.05) | benign(0.222) | TCGA-B5-A3FA-01 | Endometrium | uterine corpus endometrioid carcinoma | Female | >=65 | I/II | Unknown | Unknown | SD |
| CHMP3 | SNV | Missense_Mutation | novel | c.578C>A | p.Pro193His | p.P193H | Q9Y3E7 | protein_coding | deleterious(0.03) | benign(0.379) | TCGA-56-8629-01 | Lung | lung squamous cell carcinoma | Male | <65 | I/II | Chemotherapy | cisplatin | CR |
| Page: 1 2 |
Top |
Related drugs of malignant transformation related genes |
| Identification of chemicals and drugs interact with genes involved in malignant transfromation |
| (DGIdb 4.0) |
| Entrez ID | Symbol | Category | Interaction Types | Drug Claim Name | Drug Name | PMIDs |
| Page: 1 |

Copyright 2023-Present -The University of Texas Health Science Center at Houston |