
|
|||||
|
 | |
| |
| |
| |
| |
| |
|
Gene: CHMP2A |
Gene summary for CHMP2A |
| Gene information | Species | Human | Gene symbol | CHMP2A | Gene ID | 27243 |
| Gene name | charged multivesicular body protein 2A | |
| Gene Alias | BC-2 | |
| Cytomap | 19q13.43 | |
| Gene Type | protein-coding | GO ID | GO:0000070 | UniProtAcc | A0A024R4S0 |
Top |
Malignant transformation analysis |
| Identification of the aberrant gene expression in precancerous and cancerous lesions by comparing the gene expression of stem-like cells in diseased tissues with normal stem cells |
| Entrez ID | Symbol | Replicates | Species | Organ | Tissue | Adj P-value | Log2FC | Malignancy |
| 27243 | CHMP2A | GSM4909286 | Human | Breast | IDC | 5.62e-07 | -3.08e-01 | 0.1081 |
| 27243 | CHMP2A | GSM4909287 | Human | Breast | IDC | 3.30e-03 | -3.23e-01 | 0.2057 |
| 27243 | CHMP2A | GSM4909294 | Human | Breast | IDC | 3.04e-66 | 9.18e-01 | 0.2022 |
| 27243 | CHMP2A | GSM4909296 | Human | Breast | IDC | 1.35e-06 | -3.47e-02 | 0.1524 |
| 27243 | CHMP2A | GSM4909297 | Human | Breast | IDC | 1.66e-15 | -1.42e-01 | 0.1517 |
| 27243 | CHMP2A | GSM4909301 | Human | Breast | IDC | 2.51e-05 | 3.11e-01 | 0.1577 |
| 27243 | CHMP2A | GSM4909302 | Human | Breast | IDC | 4.26e-08 | 2.82e-01 | 0.1545 |
| 27243 | CHMP2A | GSM4909307 | Human | Breast | IDC | 2.41e-10 | 4.08e-01 | 0.1569 |
| 27243 | CHMP2A | GSM4909308 | Human | Breast | IDC | 6.32e-18 | 5.22e-01 | 0.158 |
| 27243 | CHMP2A | GSM4909311 | Human | Breast | IDC | 1.01e-32 | -2.68e-01 | 0.1534 |
| 27243 | CHMP2A | GSM4909312 | Human | Breast | IDC | 5.17e-10 | -1.41e-01 | 0.1552 |
| 27243 | CHMP2A | GSM4909313 | Human | Breast | IDC | 1.08e-04 | 2.92e-02 | 0.0391 |
| 27243 | CHMP2A | GSM4909317 | Human | Breast | IDC | 1.57e-04 | 3.32e-01 | 0.1355 |
| 27243 | CHMP2A | GSM4909318 | Human | Breast | IDC | 2.16e-10 | 5.22e-01 | 0.2031 |
| 27243 | CHMP2A | GSM4909319 | Human | Breast | IDC | 1.04e-48 | -1.18e-01 | 0.1563 |
| 27243 | CHMP2A | GSM4909320 | Human | Breast | IDC | 4.07e-08 | 1.06e-01 | 0.1575 |
| 27243 | CHMP2A | GSM4909321 | Human | Breast | IDC | 2.64e-18 | 1.15e-01 | 0.1559 |
| 27243 | CHMP2A | brca1 | Human | Breast | Precancer | 5.44e-13 | 4.28e-01 | -0.0338 |
| 27243 | CHMP2A | brca2 | Human | Breast | Precancer | 2.52e-11 | 4.24e-01 | -0.024 |
| 27243 | CHMP2A | brca3 | Human | Breast | Precancer | 4.00e-12 | 3.51e-01 | -0.0263 |
| Page: 1 2 3 4 5 6 7 8 9 10 11 12 13 14 |
| Tissue | Expression Dynamics | Abbreviation |
| Breast |  | IDC: Invasive ductal carcinoma |
| DCIS: Ductal carcinoma in situ | ||
| Precancer(BRCA1-mut): Precancerous lesion from BRCA1 mutation carriers | ||
| Cervix | 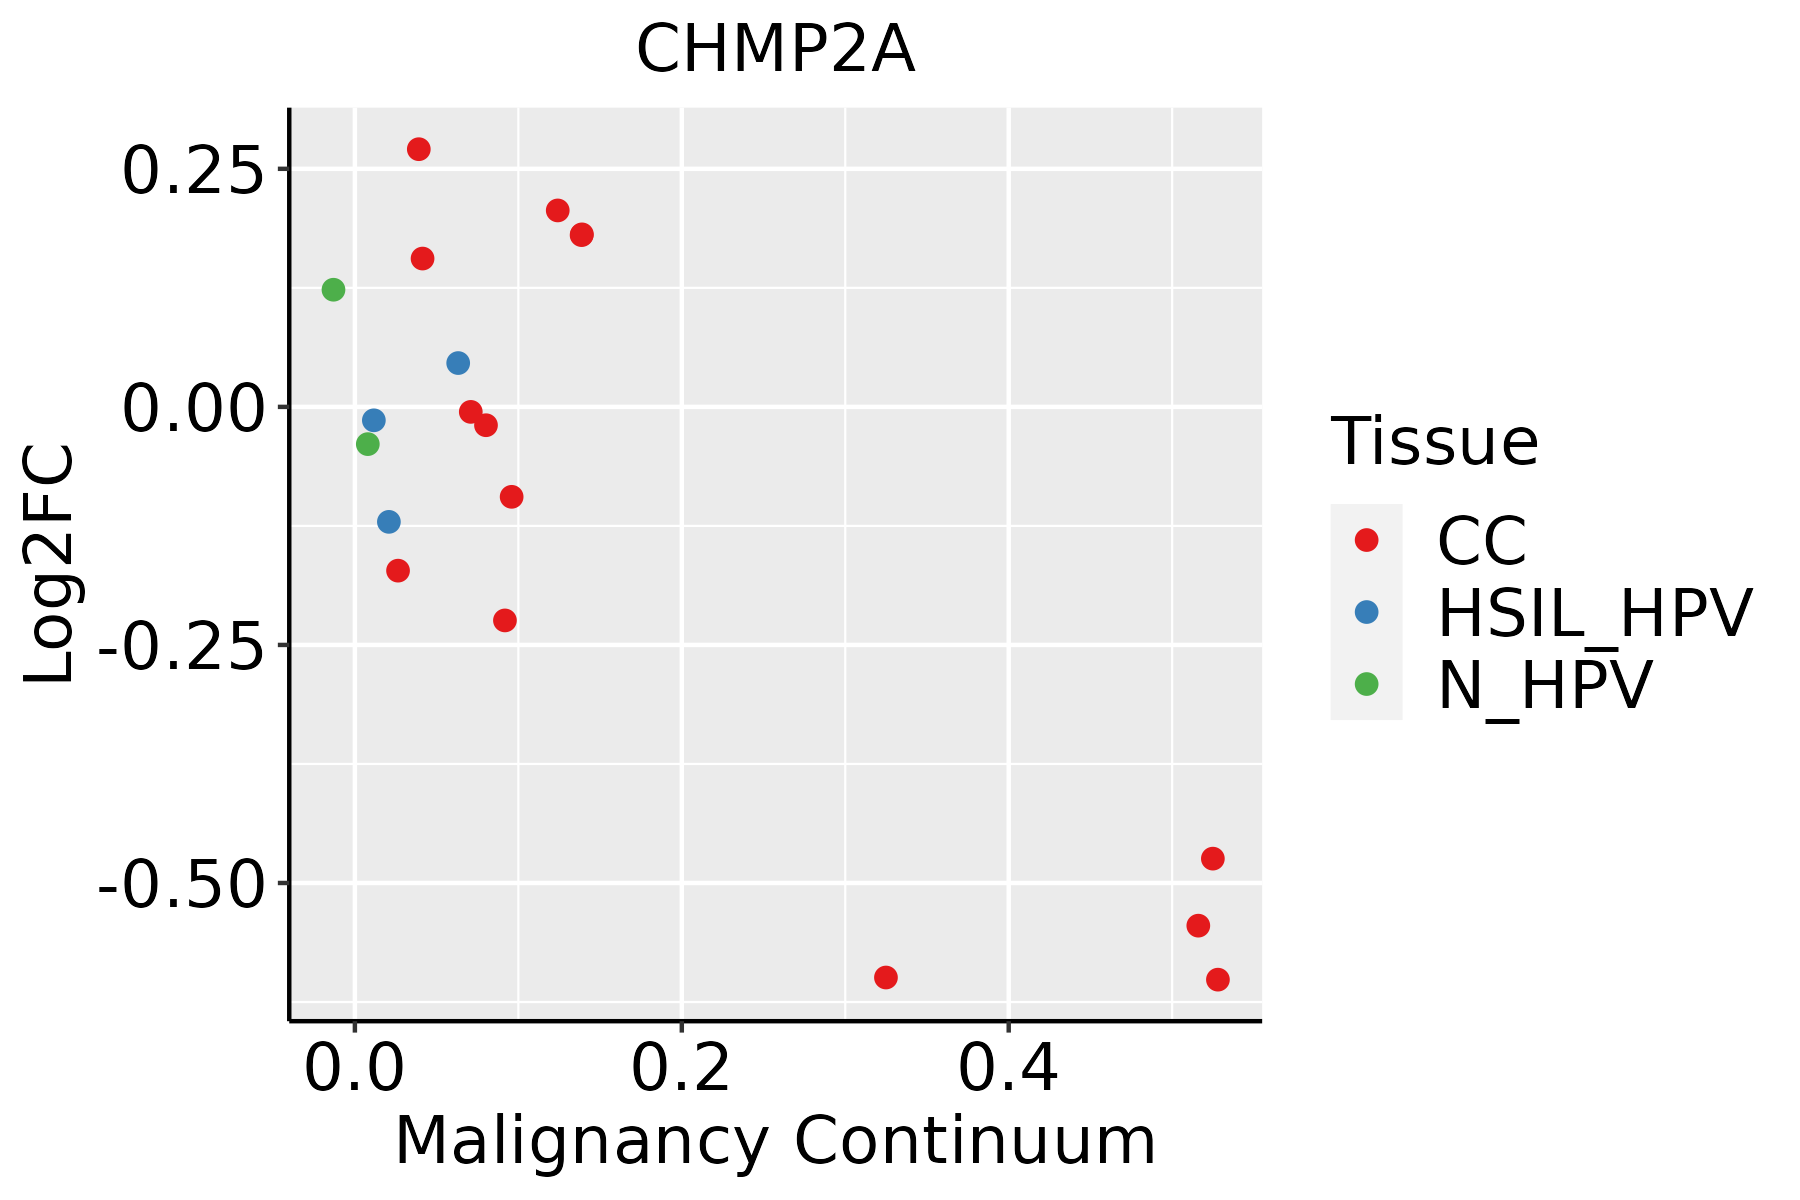 | CC: Cervix cancer |
| HSIL_HPV: HPV-infected high-grade squamous intraepithelial lesions | ||
| N_HPV: HPV-infected normal cervix | ||
| Colorectum (GSE201348) |  | FAP: Familial adenomatous polyposis |
| CRC: Colorectal cancer | ||
| Colorectum (HTA11) |  | AD: Adenomas |
| SER: Sessile serrated lesions | ||
| MSI-H: Microsatellite-high colorectal cancer | ||
| MSS: Microsatellite stable colorectal cancer | ||
| Endometrium | 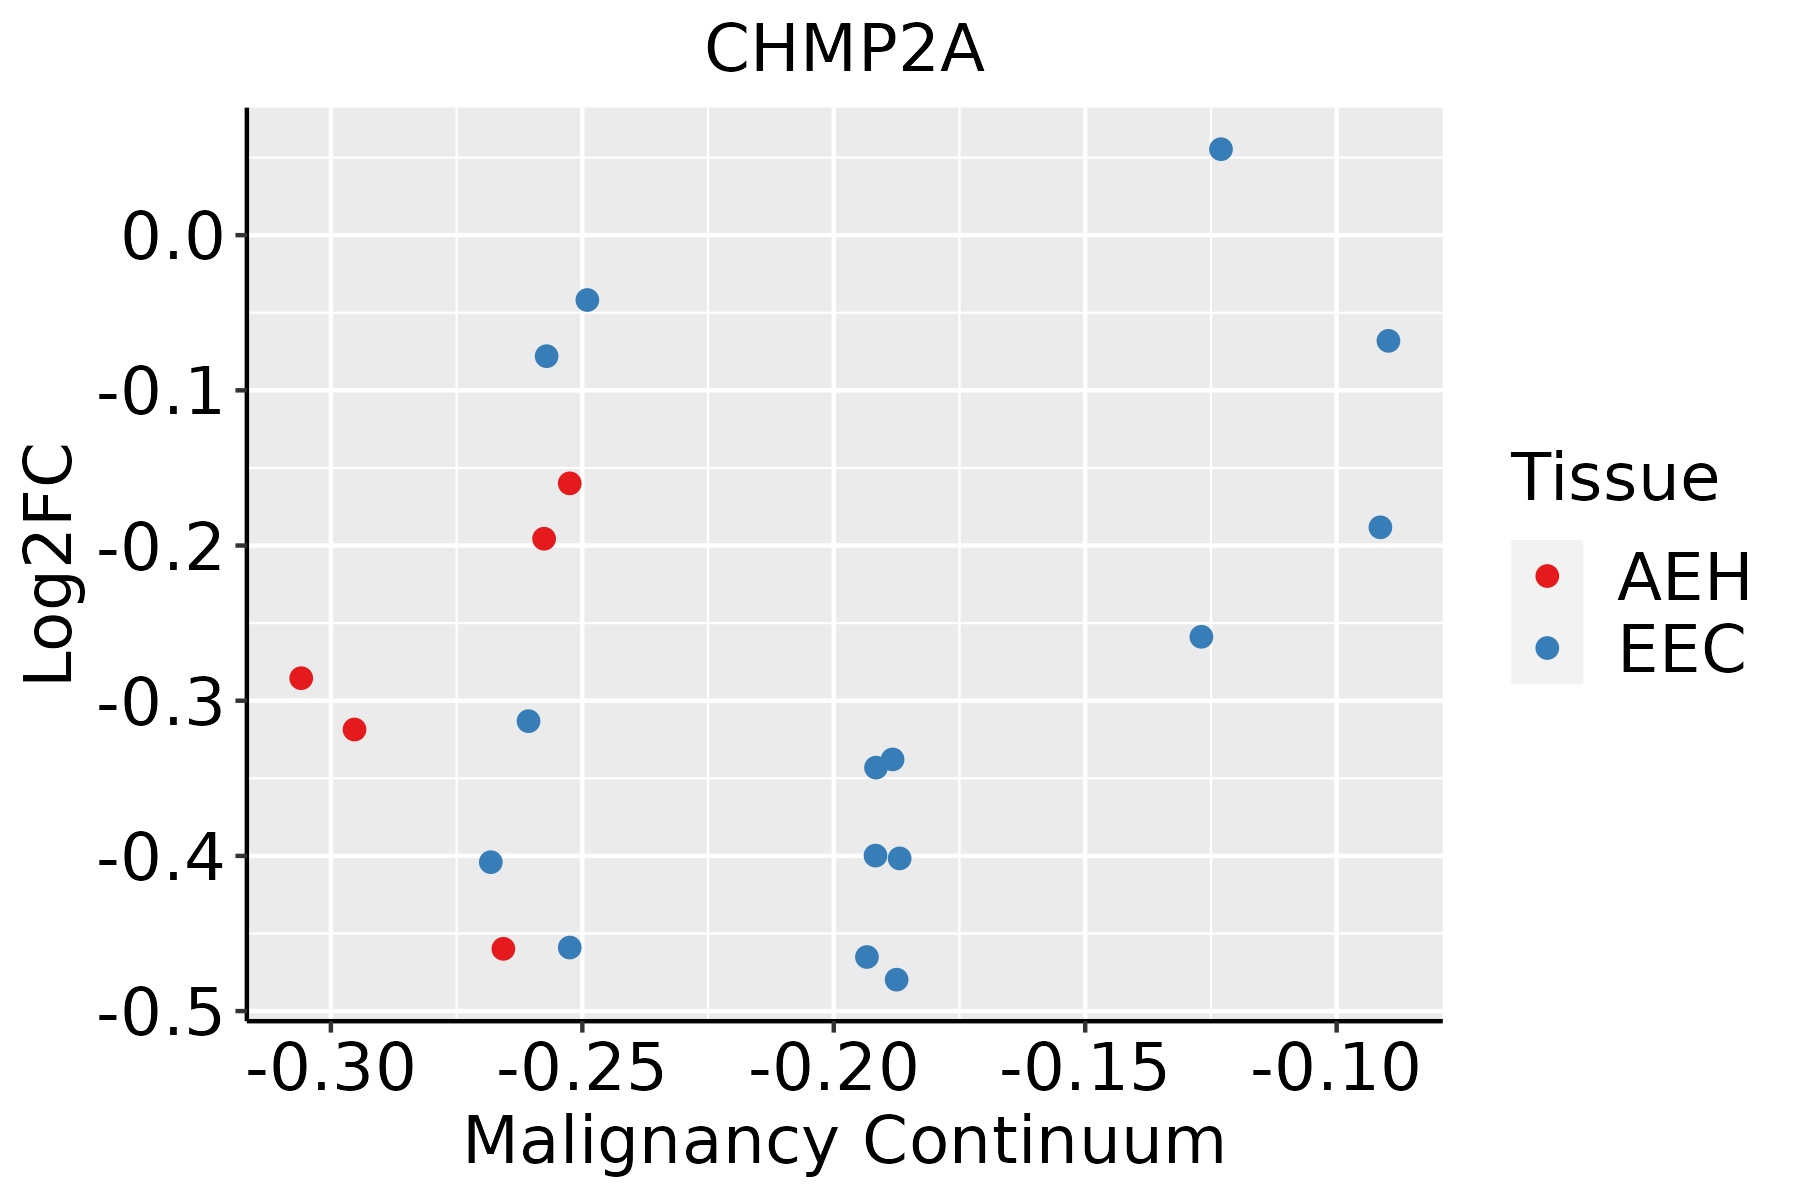 | AEH: Atypical endometrial hyperplasia |
| EEC: Endometrioid Cancer | ||
| Esophagus | 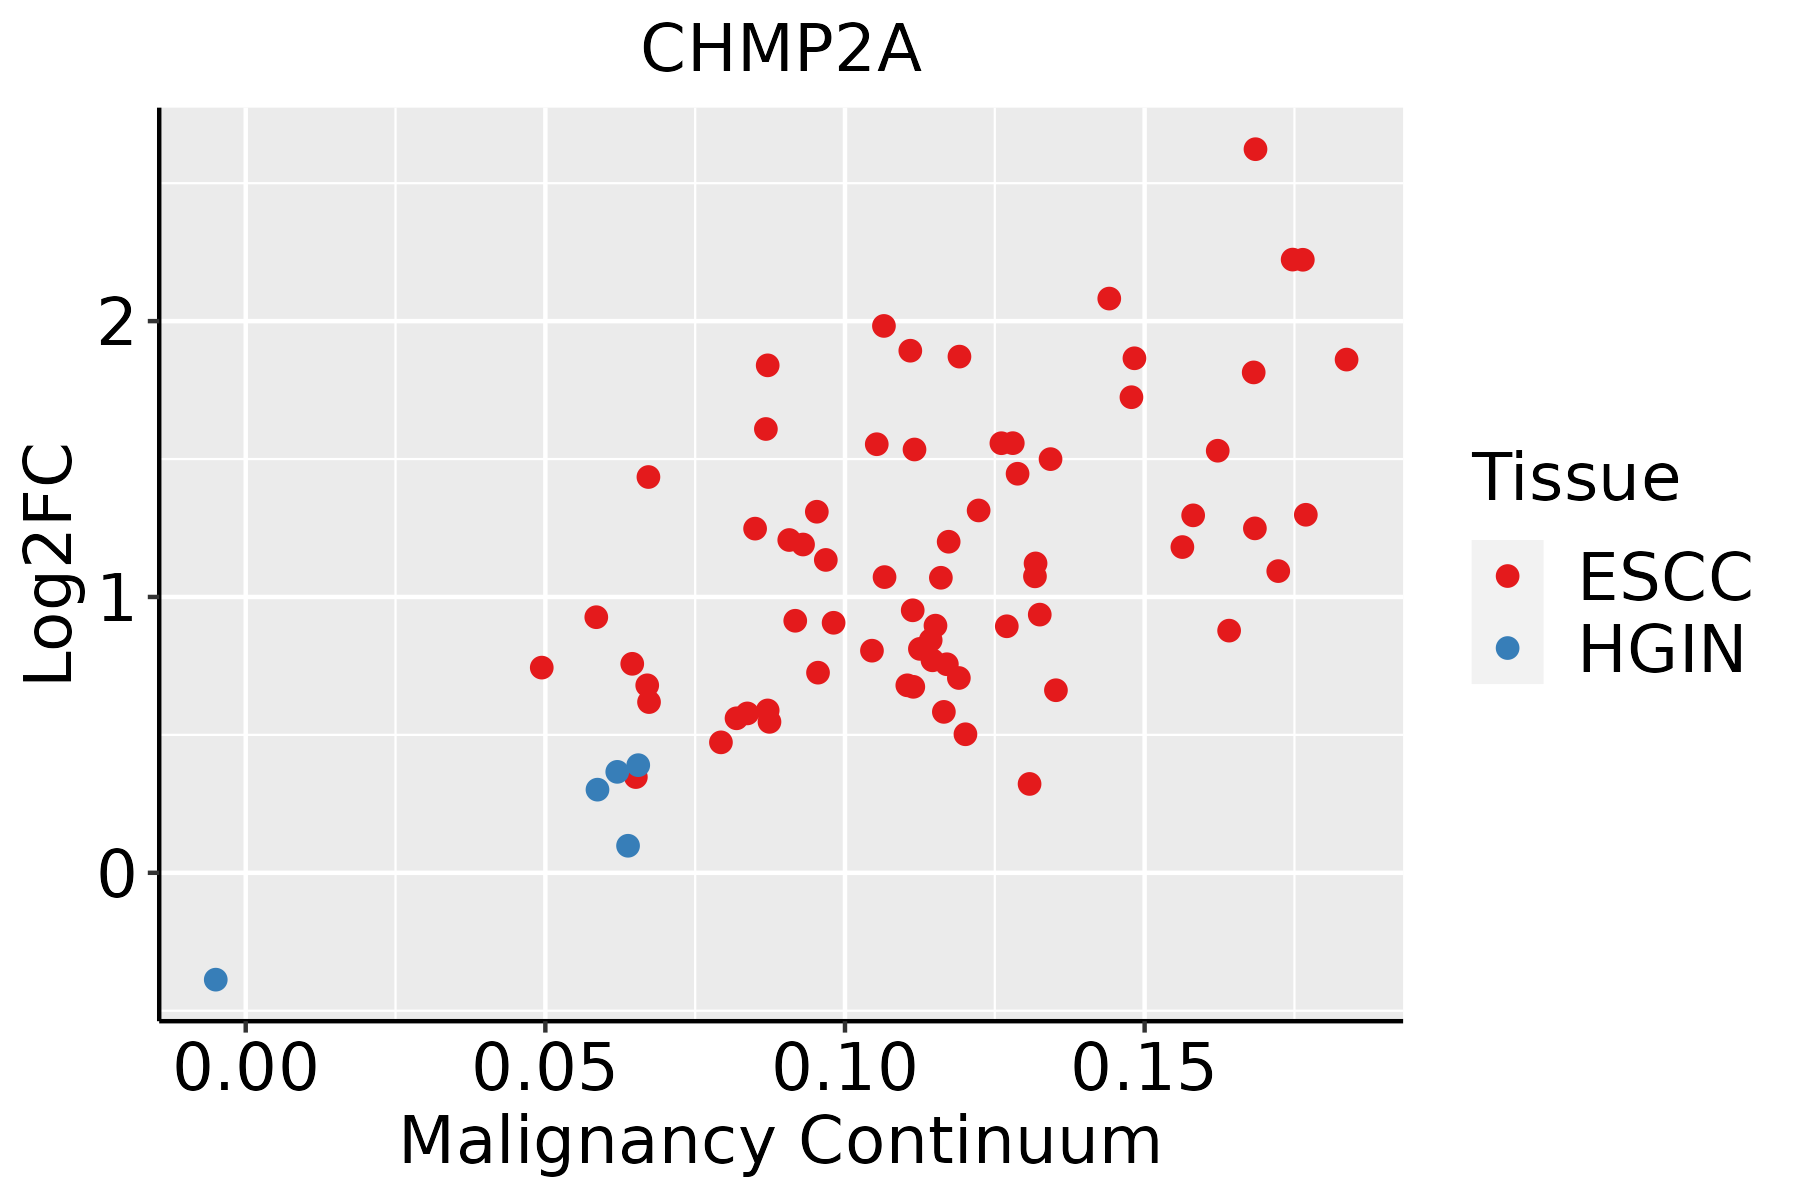 | ESCC: Esophageal squamous cell carcinoma |
| HGIN: High-grade intraepithelial neoplasias | ||
| LGIN: Low-grade intraepithelial neoplasias | ||
| GC |  | CAG: Chronic atrophic gastritis |
| CAG with IM: Chronic atrophic gastritis with intestinal metaplasia | ||
| CSG: Chronic superficial gastritis | ||
| GC: Gastric cancer | ||
| SIM: Severe intestinal metaplasia | ||
| WIM: Wild intestinal metaplasia | ||
| Liver | 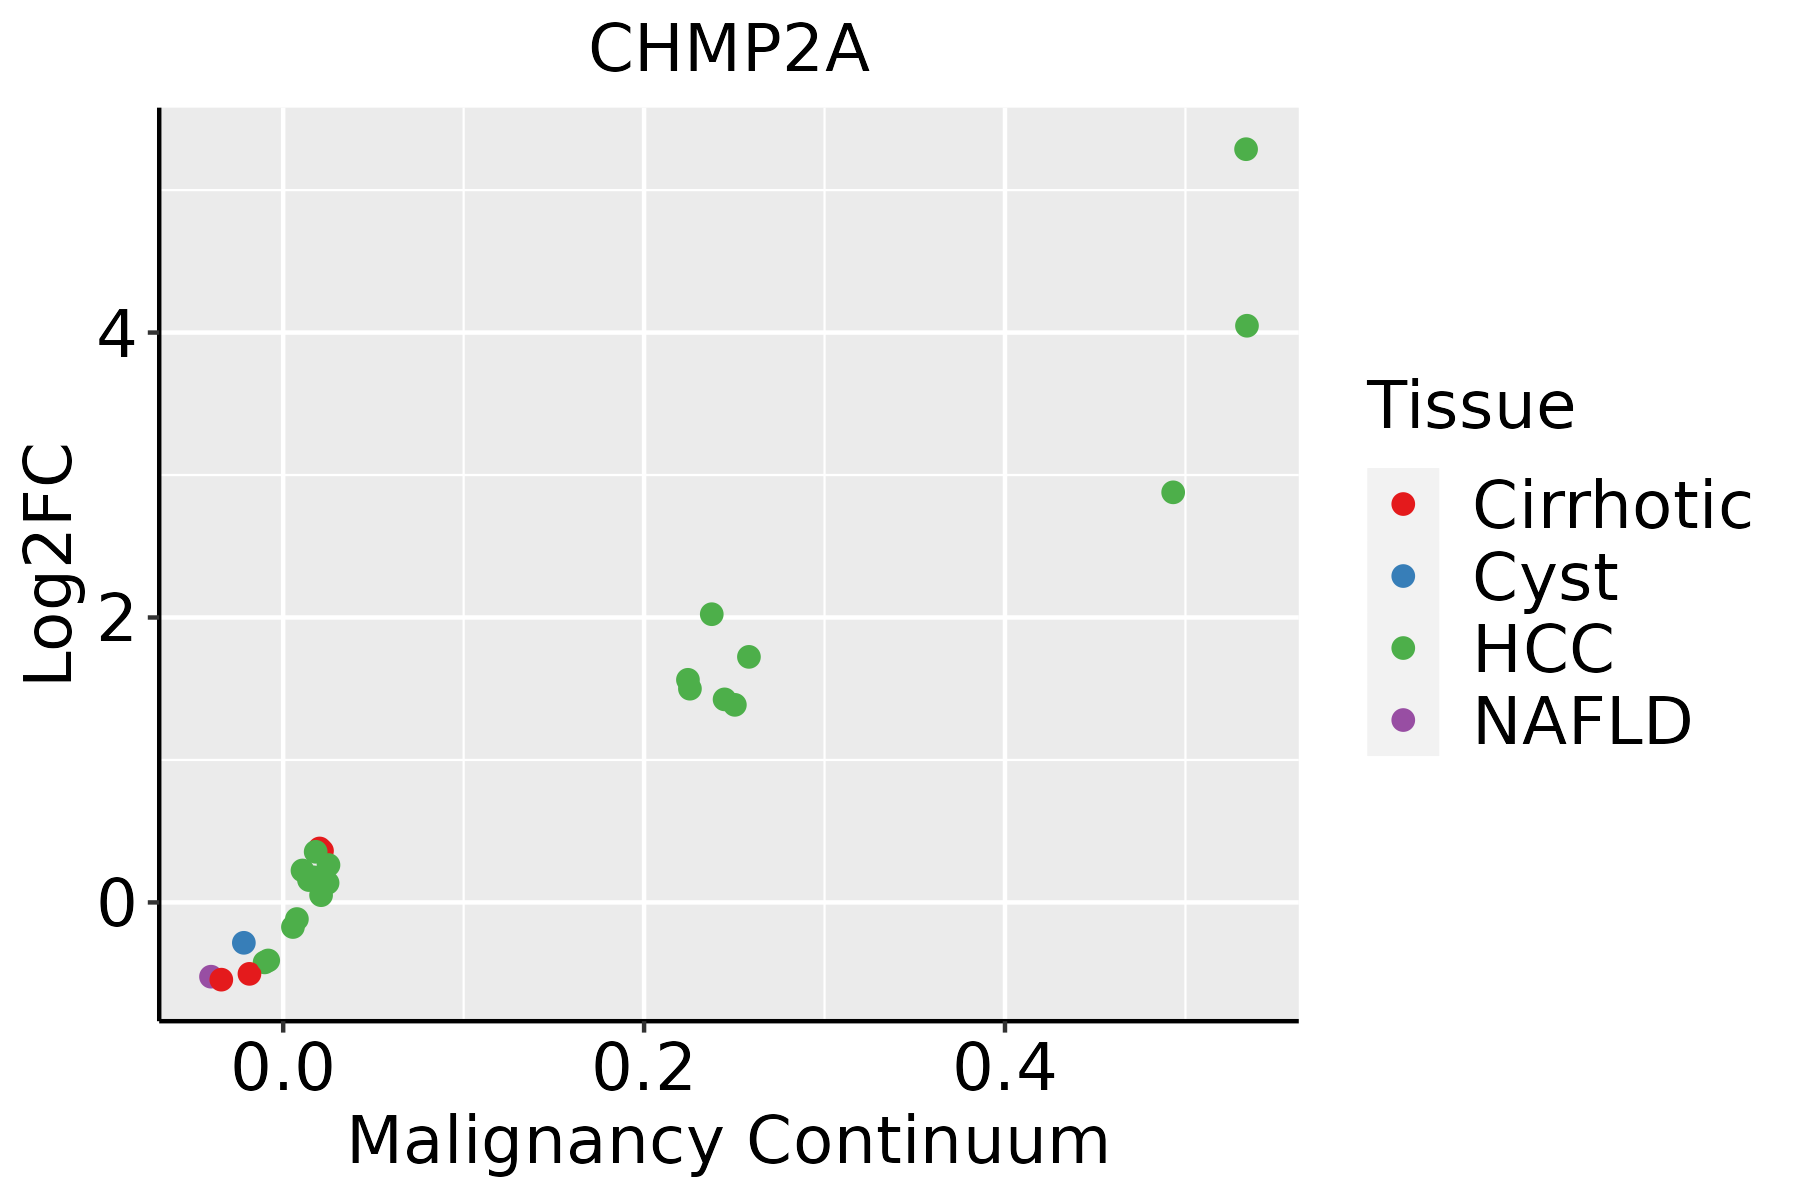 | HCC: Hepatocellular carcinoma |
| NAFLD: Non-alcoholic fatty liver disease | ||
| Lung | 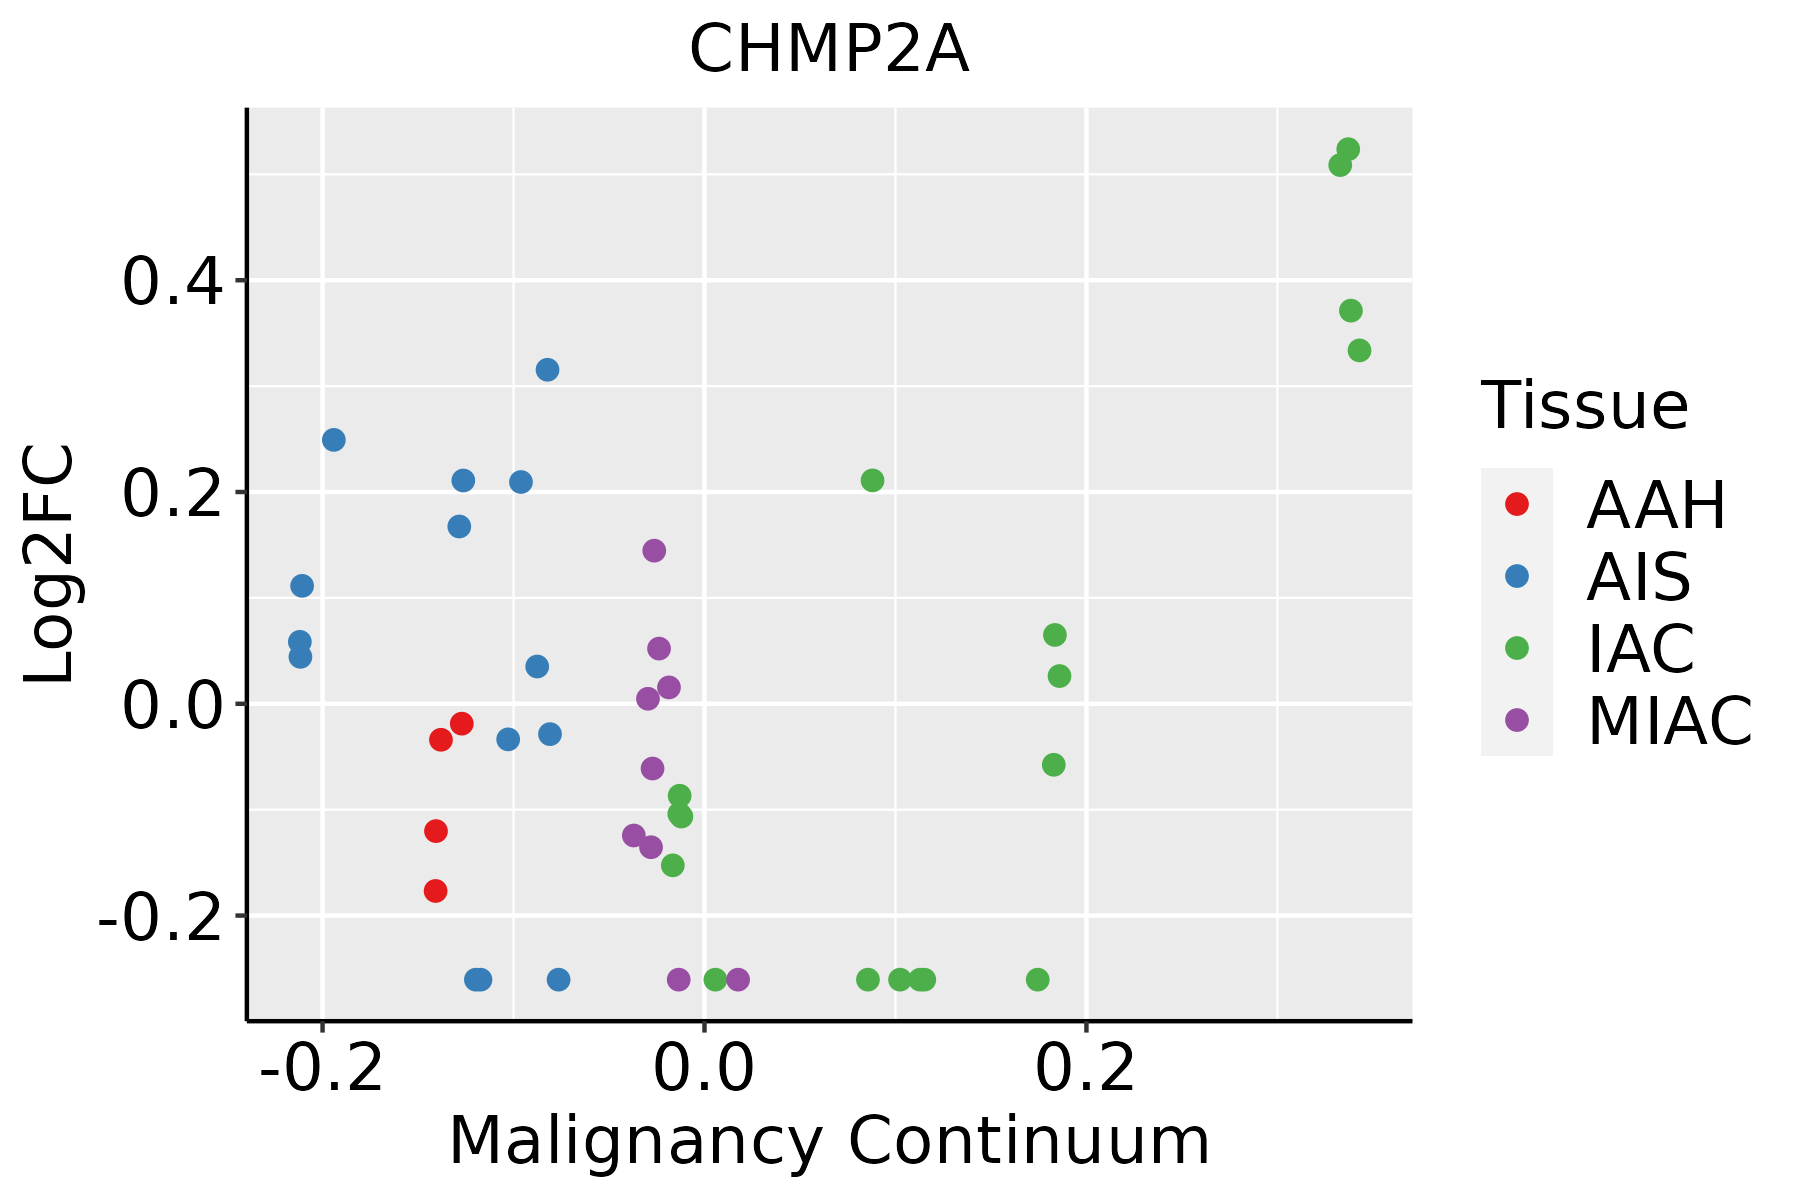 | AAH: Atypical adenomatous hyperplasia |
| AIS: Adenocarcinoma in situ | ||
| IAC: Invasive lung adenocarcinoma | ||
| MIA: Minimally invasive adenocarcinoma | ||
| Oral Cavity |  | EOLP: Erosive Oral lichen planus |
| LP: leukoplakia | ||
| NEOLP: Non-erosive oral lichen planus | ||
| OSCC: Oral squamous cell carcinoma | ||
| Prostate |  | BPH: Benign Prostatic Hyperplasia |
| Skin |  | AK: Actinic keratosis |
| cSCC: Cutaneous squamous cell carcinoma | ||
| SCCIS:squamous cell carcinoma in situ | ||
| Thyroid | 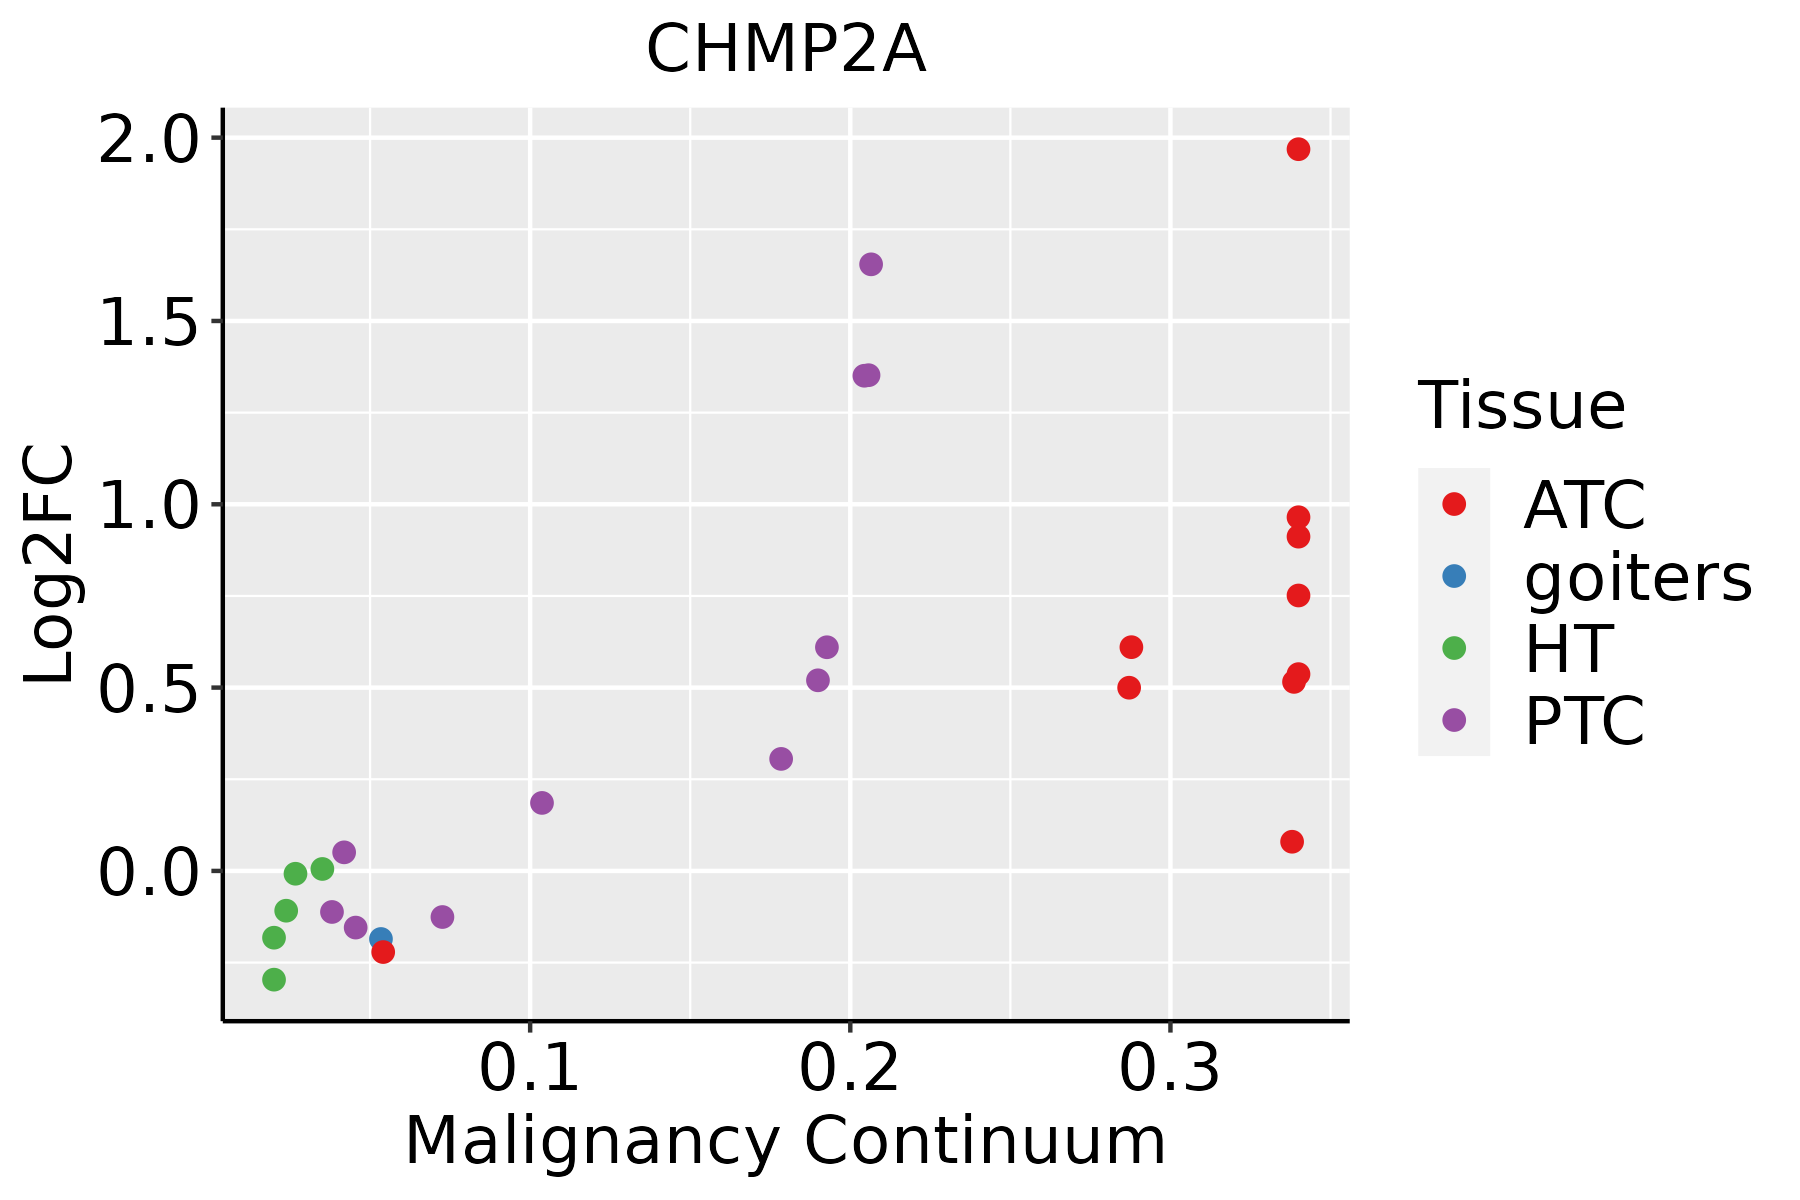 | ATC: Anaplastic thyroid cancer |
| HT: Hashimoto's thyroiditis | ||
| PTC: Papillary thyroid cancer |
| ∗log2FC in expression of this searched gene in stem-like cells from each diseased tissue sample relative to stem-like cells in normal samples in each tissue plotted against the malignancy continuum. Samples are colored based on if they are from different disease stage. |
Top |
Malignant transformation related pathway analysis |
| Find out the enriched GO biological processes and KEGG pathways involved in transition from healthy to precancer to cancer |
| Tissue | Disease Stage | Enriched GO biological Processes |
| Colorectum | AD |  |
| Colorectum | SER |  |
| Colorectum | MSS |  |
| Colorectum | MSI-H |  |
| Colorectum | FAP |  |
| ∗Top 15 enriched GO BP terms are showed in the bar plot of each disease state in each tissue. Each row represents a significant GO biological process which is colored according to the -log10(p.adjust). |
| Page: 1 2 3 4 5 6 7 8 9 |
| GO ID | Tissue | Disease Stage | Description | Gene Ratio | Bg Ratio | pvalue | p.adjust | Count |
| GO:00160329 | Breast | Precancer | viral process | 58/1080 | 415/18723 | 3.42e-10 | 3.16e-08 | 58 |
| GO:00190589 | Breast | Precancer | viral life cycle | 47/1080 | 317/18723 | 2.42e-09 | 1.99e-07 | 47 |
| GO:00444039 | Breast | Precancer | biological process involved in symbiotic interaction | 42/1080 | 290/18723 | 3.40e-08 | 2.11e-06 | 42 |
| GO:00521269 | Breast | Precancer | movement in host environment | 29/1080 | 175/18723 | 2.59e-07 | 1.28e-05 | 29 |
| GO:00517019 | Breast | Precancer | biological process involved in interaction with host | 31/1080 | 203/18723 | 6.52e-07 | 2.71e-05 | 31 |
| GO:00507929 | Breast | Precancer | regulation of viral process | 27/1080 | 164/18723 | 7.59e-07 | 3.05e-05 | 27 |
| GO:00439039 | Breast | Precancer | regulation of biological process involved in symbiotic interaction | 15/1080 | 72/18723 | 1.23e-05 | 3.17e-04 | 15 |
| GO:19039009 | Breast | Precancer | regulation of viral life cycle | 23/1080 | 148/18723 | 1.31e-05 | 3.30e-04 | 23 |
| GO:00485249 | Breast | Precancer | positive regulation of viral process | 12/1080 | 65/18723 | 3.00e-04 | 4.34e-03 | 12 |
| GO:00224119 | Breast | Precancer | cellular component disassembly | 44/1080 | 443/18723 | 3.17e-04 | 4.51e-03 | 44 |
| GO:19035434 | Breast | Precancer | positive regulation of exosomal secretion | 5/1080 | 15/18723 | 1.17e-03 | 1.26e-02 | 5 |
| GO:19035416 | Breast | Precancer | regulation of exosomal secretion | 5/1080 | 17/18723 | 2.19e-03 | 2.06e-02 | 5 |
| GO:19901826 | Breast | Precancer | exosomal secretion | 5/1080 | 20/18723 | 4.74e-03 | 3.61e-02 | 5 |
| GO:19039026 | Breast | Precancer | positive regulation of viral life cycle | 6/1080 | 29/18723 | 5.49e-03 | 4.01e-02 | 6 |
| GO:00977346 | Breast | Precancer | extracellular exosome biogenesis | 5/1080 | 21/18723 | 5.93e-03 | 4.21e-02 | 5 |
| GO:001603214 | Breast | IDC | viral process | 75/1434 | 415/18723 | 1.98e-12 | 4.02e-10 | 75 |
| GO:001905814 | Breast | IDC | viral life cycle | 61/1434 | 317/18723 | 1.61e-11 | 2.77e-09 | 61 |
| GO:004440314 | Breast | IDC | biological process involved in symbiotic interaction | 52/1434 | 290/18723 | 6.55e-09 | 5.03e-07 | 52 |
| GO:005079214 | Breast | IDC | regulation of viral process | 36/1434 | 164/18723 | 6.55e-09 | 5.03e-07 | 36 |
| GO:190390014 | Breast | IDC | regulation of viral life cycle | 30/1434 | 148/18723 | 7.25e-07 | 3.35e-05 | 30 |
| Page: 1 2 3 4 5 6 7 8 9 10 11 12 13 14 15 16 17 18 19 20 21 22 23 24 25 26 27 28 29 30 31 32 33 34 35 36 37 38 39 40 41 42 43 44 45 46 47 48 49 50 51 52 53 54 55 56 57 58 59 60 61 62 63 |
| Pathway ID | Tissue | Disease Stage | Description | Gene Ratio | Bg Ratio | pvalue | p.adjust | qvalue | Count |
| hsa0414416 | Breast | DCIS | Endocytosis | 37/846 | 251/8465 | 9.92e-03 | 4.40e-02 | 3.24e-02 | 37 |
| hsa0414417 | Breast | DCIS | Endocytosis | 37/846 | 251/8465 | 9.92e-03 | 4.40e-02 | 3.24e-02 | 37 |
| hsa0414418 | Cervix | CC | Endocytosis | 64/1267 | 251/8465 | 6.97e-06 | 6.10e-05 | 3.61e-05 | 64 |
| hsa0414419 | Cervix | CC | Endocytosis | 64/1267 | 251/8465 | 6.97e-06 | 6.10e-05 | 3.61e-05 | 64 |
| hsa04144 | Colorectum | AD | Endocytosis | 111/2092 | 251/8465 | 5.95e-12 | 1.42e-10 | 9.08e-11 | 111 |
| hsa041441 | Colorectum | AD | Endocytosis | 111/2092 | 251/8465 | 5.95e-12 | 1.42e-10 | 9.08e-11 | 111 |
| hsa041442 | Colorectum | SER | Endocytosis | 81/1580 | 251/8465 | 1.14e-07 | 2.36e-06 | 1.71e-06 | 81 |
| hsa04217 | Colorectum | SER | Necroptosis | 47/1580 | 159/8465 | 5.21e-04 | 4.44e-03 | 3.22e-03 | 47 |
| hsa041443 | Colorectum | SER | Endocytosis | 81/1580 | 251/8465 | 1.14e-07 | 2.36e-06 | 1.71e-06 | 81 |
| hsa042171 | Colorectum | SER | Necroptosis | 47/1580 | 159/8465 | 5.21e-04 | 4.44e-03 | 3.22e-03 | 47 |
| hsa041444 | Colorectum | MSS | Endocytosis | 102/1875 | 251/8465 | 1.85e-11 | 4.43e-10 | 2.71e-10 | 102 |
| hsa041445 | Colorectum | MSS | Endocytosis | 102/1875 | 251/8465 | 1.85e-11 | 4.43e-10 | 2.71e-10 | 102 |
| hsa0414420 | Endometrium | AEH | Endocytosis | 56/1197 | 251/8465 | 2.58e-04 | 2.15e-03 | 1.57e-03 | 56 |
| hsa04144110 | Endometrium | AEH | Endocytosis | 56/1197 | 251/8465 | 2.58e-04 | 2.15e-03 | 1.57e-03 | 56 |
| hsa0414424 | Endometrium | EEC | Endocytosis | 57/1237 | 251/8465 | 3.34e-04 | 2.82e-03 | 2.10e-03 | 57 |
| hsa0414434 | Endometrium | EEC | Endocytosis | 57/1237 | 251/8465 | 3.34e-04 | 2.82e-03 | 2.10e-03 | 57 |
| hsa0414429 | Esophagus | HGIN | Endocytosis | 76/1383 | 251/8465 | 1.74e-08 | 3.34e-07 | 2.65e-07 | 76 |
| hsa04144113 | Esophagus | HGIN | Endocytosis | 76/1383 | 251/8465 | 1.74e-08 | 3.34e-07 | 2.65e-07 | 76 |
| hsa04144210 | Esophagus | ESCC | Endocytosis | 186/4205 | 251/8465 | 9.74e-16 | 4.66e-14 | 2.39e-14 | 186 |
| hsa0414437 | Esophagus | ESCC | Endocytosis | 186/4205 | 251/8465 | 9.74e-16 | 4.66e-14 | 2.39e-14 | 186 |
| Page: 1 2 3 |
Top |
Cell-cell communication analysis |
| Identification of potential cell-cell interactions between two cell types and their ligand-receptor pairs for different disease states |
| Ligand | Receptor | LRpair | Pathway | Tissue | Disease Stage |
| Page: 1 |
Top |
Single-cell gene regulatory network inference analysis |
| Find out the significant the regulons (TFs) and the target genes of each regulon across cell types for different disease states |
| TF | Cell Type | Tissue | Disease Stage | Target Gene | RSS | Regulon Activity |
| ∗The dot plots of a searched regulon are shown for all cell subpopulations in each disease state of each tissue based on the regulon specific score inferred using pySCENIC and by calculating the average expression. |
| Page: 1 |
Top |
Somatic mutation of malignant transformation related genes |
| Annotation of somatic variants for genes involved in malignant transformation |
| Hugo Symbol | Variant Class | Variant Classification | dbSNP RS | HGVSc | HGVSp | HGVSp Short | SWISSPROT | BIOTYPE | SIFT | PolyPhen | Tumor Sample Barcode | Tissue | Histology | Sex | Age | Stage | Therapy Types | Drugs | Outcome |
| CHMP2A | SNV | Missense_Mutation | novel | c.423N>C | p.Glu141Asp | p.E141D | O43633 | protein_coding | tolerated(0.06) | possibly_damaging(0.717) | TCGA-AC-A3W6-01 | Breast | breast invasive carcinoma | Female | >=65 | III/IV | Unknown | Unknown | SD |
| CHMP2A | SNV | Missense_Mutation | novel | c.445G>A | p.Asp149Asn | p.D149N | O43633 | protein_coding | tolerated(0.09) | possibly_damaging(0.817) | TCGA-AC-A5XS-01 | Breast | breast invasive carcinoma | Female | >=65 | I/II | Hormone Therapy | femara | SD |
| CHMP2A | SNV | Missense_Mutation | novel | c.289N>G | p.Asn97Asp | p.N97D | O43633 | protein_coding | tolerated(0.41) | benign(0.021) | TCGA-AA-3814-01 | Colorectum | colon adenocarcinoma | Female | >=65 | I/II | Unknown | Unknown | SD |
| CHMP2A | SNV | Missense_Mutation | rs376979258 | c.220C>T | p.Arg74Cys | p.R74C | O43633 | protein_coding | deleterious(0.01) | possibly_damaging(0.806) | TCGA-AA-A00N-01 | Colorectum | colon adenocarcinoma | Male | >=65 | I/II | Unknown | Unknown | PD |
| CHMP2A | SNV | Missense_Mutation | rs144804005 | c.539N>T | p.Ser180Leu | p.S180L | O43633 | protein_coding | tolerated(0.32) | benign(0.022) | TCGA-CK-4951-01 | Colorectum | colon adenocarcinoma | Female | >=65 | I/II | Unknown | Unknown | PD |
| CHMP2A | SNV | Missense_Mutation | novel | c.152N>T | p.Ala51Val | p.A51V | O43633 | protein_coding | deleterious(0.02) | probably_damaging(1) | TCGA-AG-A002-01 | Colorectum | rectum adenocarcinoma | Male | <65 | I/II | Unknown | Unknown | SD |
| CHMP2A | SNV | Missense_Mutation | c.605C>T | p.Ala202Val | p.A202V | O43633 | protein_coding | tolerated(0.07) | benign(0.017) | TCGA-A5-A0VP-01 | Endometrium | uterine corpus endometrioid carcinoma | Female | >=65 | I/II | Unknown | Unknown | SD | |
| CHMP2A | SNV | Missense_Mutation | novel | c.308N>C | p.Met103Thr | p.M103T | O43633 | protein_coding | deleterious(0) | possibly_damaging(0.838) | TCGA-A5-A1OF-01 | Endometrium | uterine corpus endometrioid carcinoma | Female | <65 | I/II | Unknown | Unknown | SD |
| CHMP2A | SNV | Missense_Mutation | novel | c.497A>C | p.Gln166Pro | p.Q166P | O43633 | protein_coding | deleterious(0) | probably_damaging(0.936) | TCGA-A5-A2K5-01 | Endometrium | uterine corpus endometrioid carcinoma | Female | >=65 | I/II | Unknown | Unknown | SD |
| CHMP2A | SNV | Missense_Mutation | novel | c.178N>T | p.Arg60Cys | p.R60C | O43633 | protein_coding | deleterious(0) | probably_damaging(0.932) | TCGA-AJ-A3OJ-01 | Endometrium | uterine corpus endometrioid carcinoma | Female | <65 | I/II | Chemotherapy | carboplatin | CR |
| Page: 1 2 3 |
Top |
Related drugs of malignant transformation related genes |
| Identification of chemicals and drugs interact with genes involved in malignant transfromation |
| (DGIdb 4.0) |
| Entrez ID | Symbol | Category | Interaction Types | Drug Claim Name | Drug Name | PMIDs |
| Page: 1 |

Copyright 2023-Present -The University of Texas Health Science Center at Houston |