Schematic overview of the cellular and molecular mechanisms involved in the cancer progression, including the proposed cellular and molecular mechanisms in cancer cells trajectory. AT1: alveolar type 1 cells; AT2: alveolar type 2 cells; AAH: atypical adenomatous hyperplasia; AIS: adenocarcinoma in situ; MIA: minimally invasive adenocarcinoma; IA: invasive adenocarcinoma; EMT: epithelial-mesenchymal transition

Home

Download

Statistics

Help

Contact

Center for Computational Systems Medicine
leaf

Gene summary

leaf

Malignant transformation analysis

leaf

Malignant transformation related pathway analysis

leaf

Cell-cell communication analysis

leaf

Single-cell gene regulatory network inference analysis

leaf

Somatic mutation of malignant transformation related genes

leaf

Related drugs of malignant transformation related genes

Gene: CHL1

Gene summary for CHL1

check button Gene summary.

Gene informationSpeciesHuman
Gene symbol

CHL1

Gene ID

10752

Gene namecell adhesion molecule L1 like
Gene AliasCALL
Cytomap3p26.3
Gene Typeprotein-coding
GO ID

GO:0000902

UniProtAcc

O00533


Top

Malignant transformation analysis

check button Identification of the aberrant gene expression in precancerous and cancerous lesions by comparing the gene expression of stem-like cells in diseased tissues with normal stem cells
check button Malignant transformation involving gene list.
Entrez IDSymbolReplicatesSpeciesOrganTissueAdj P-valueLog2FCMalignancy
10752CHL1LZE2THumanEsophagusESCC3.08e-047.85e-010.082
10752CHL1LZE24THumanEsophagusESCC6.08e-072.02e-010.0596
10752CHL1P4T-EHumanEsophagusESCC5.55e-268.04e-010.1323
10752CHL1P8T-EHumanEsophagusESCC2.40e-174.53e-010.0889
10752CHL1P9T-EHumanEsophagusESCC1.72e-123.98e-010.1131
10752CHL1P10T-EHumanEsophagusESCC3.16e-195.06e-010.116
10752CHL1P11T-EHumanEsophagusESCC4.27e-065.38e-010.1426
10752CHL1P12T-EHumanEsophagusESCC2.27e-092.56e-010.1122
10752CHL1P15T-EHumanEsophagusESCC2.06e-021.98e-010.1149
10752CHL1P22T-EHumanEsophagusESCC1.44e-021.36e-010.1236
10752CHL1P23T-EHumanEsophagusESCC3.68e-042.47e-010.108
10752CHL1P26T-EHumanEsophagusESCC1.09e-042.22e-010.1276
10752CHL1P27T-EHumanEsophagusESCC1.19e-164.60e-010.1055
10752CHL1P28T-EHumanEsophagusESCC2.02e-031.12e-010.1149
10752CHL1P30T-EHumanEsophagusESCC7.10e-112.49e-010.137
10752CHL1P31T-EHumanEsophagusESCC3.86e-041.13e-010.1251
10752CHL1P39T-EHumanEsophagusESCC1.57e-092.95e-010.0894
10752CHL1P47T-EHumanEsophagusESCC8.66e-031.81e-010.1067
10752CHL1P49T-EHumanEsophagusESCC1.78e-151.10e+000.1768
10752CHL1P54T-EHumanEsophagusESCC1.85e-258.92e-010.0975
Page: 1 2 

check button Transcriptomic changes along malignancy continuum.
TissueExpression DynamicsAbbreviation
EsophagusThe image shows the transcriptomic changes along malignancy continuum.log2FC in expression of this searched gene in stem-like cells from each diseased tissue sample relative to stem-like cells in normal samples in each tissue plotted against the malignancy continuum. Samples are colored based on if they are from different disease stage.
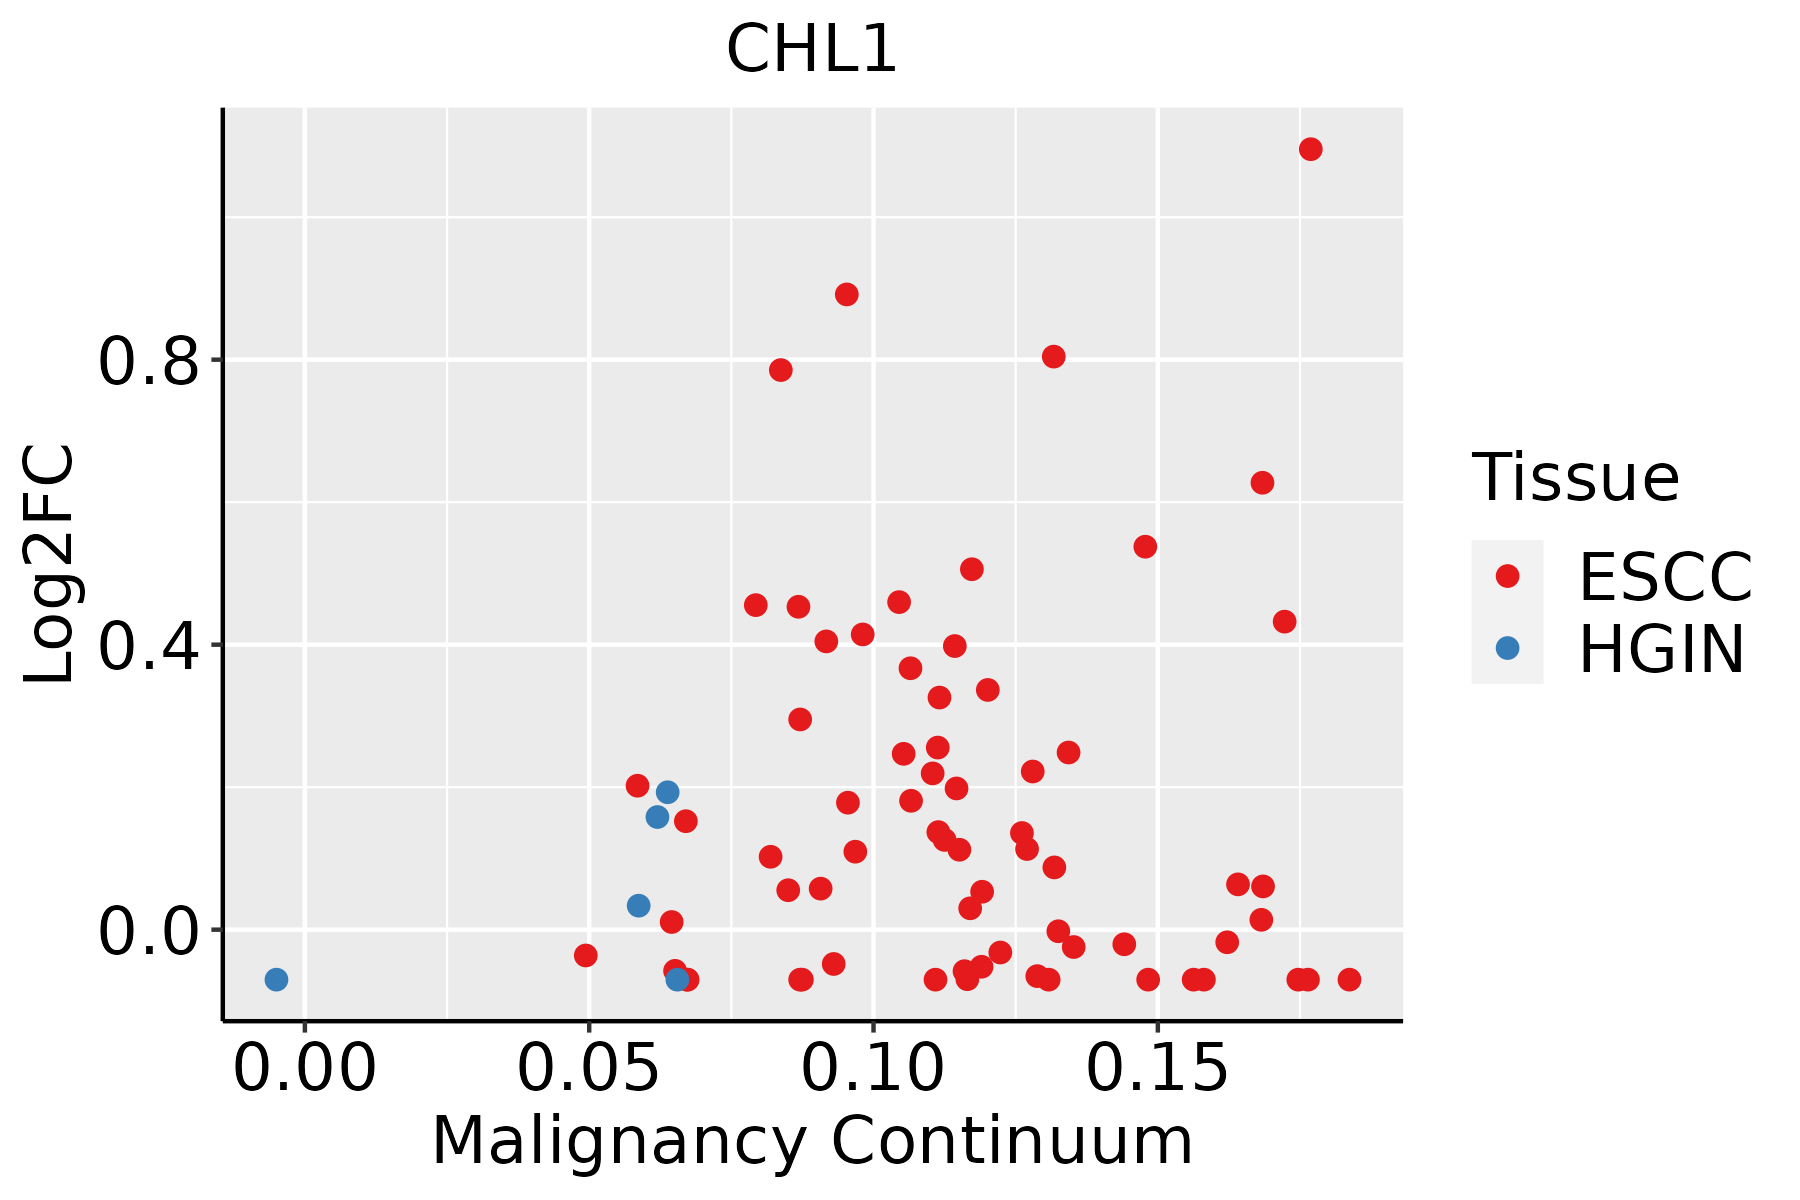
ESCC: Esophageal squamous cell carcinoma
HGIN: High-grade intraepithelial neoplasias
LGIN: Low-grade intraepithelial neoplasias
LiverThe image shows the transcriptomic changes along malignancy continuum.log2FC in expression of this searched gene in stem-like cells from each diseased tissue sample relative to stem-like cells in normal samples in each tissue plotted against the malignancy continuum. Samples are colored based on if they are from different disease stage.
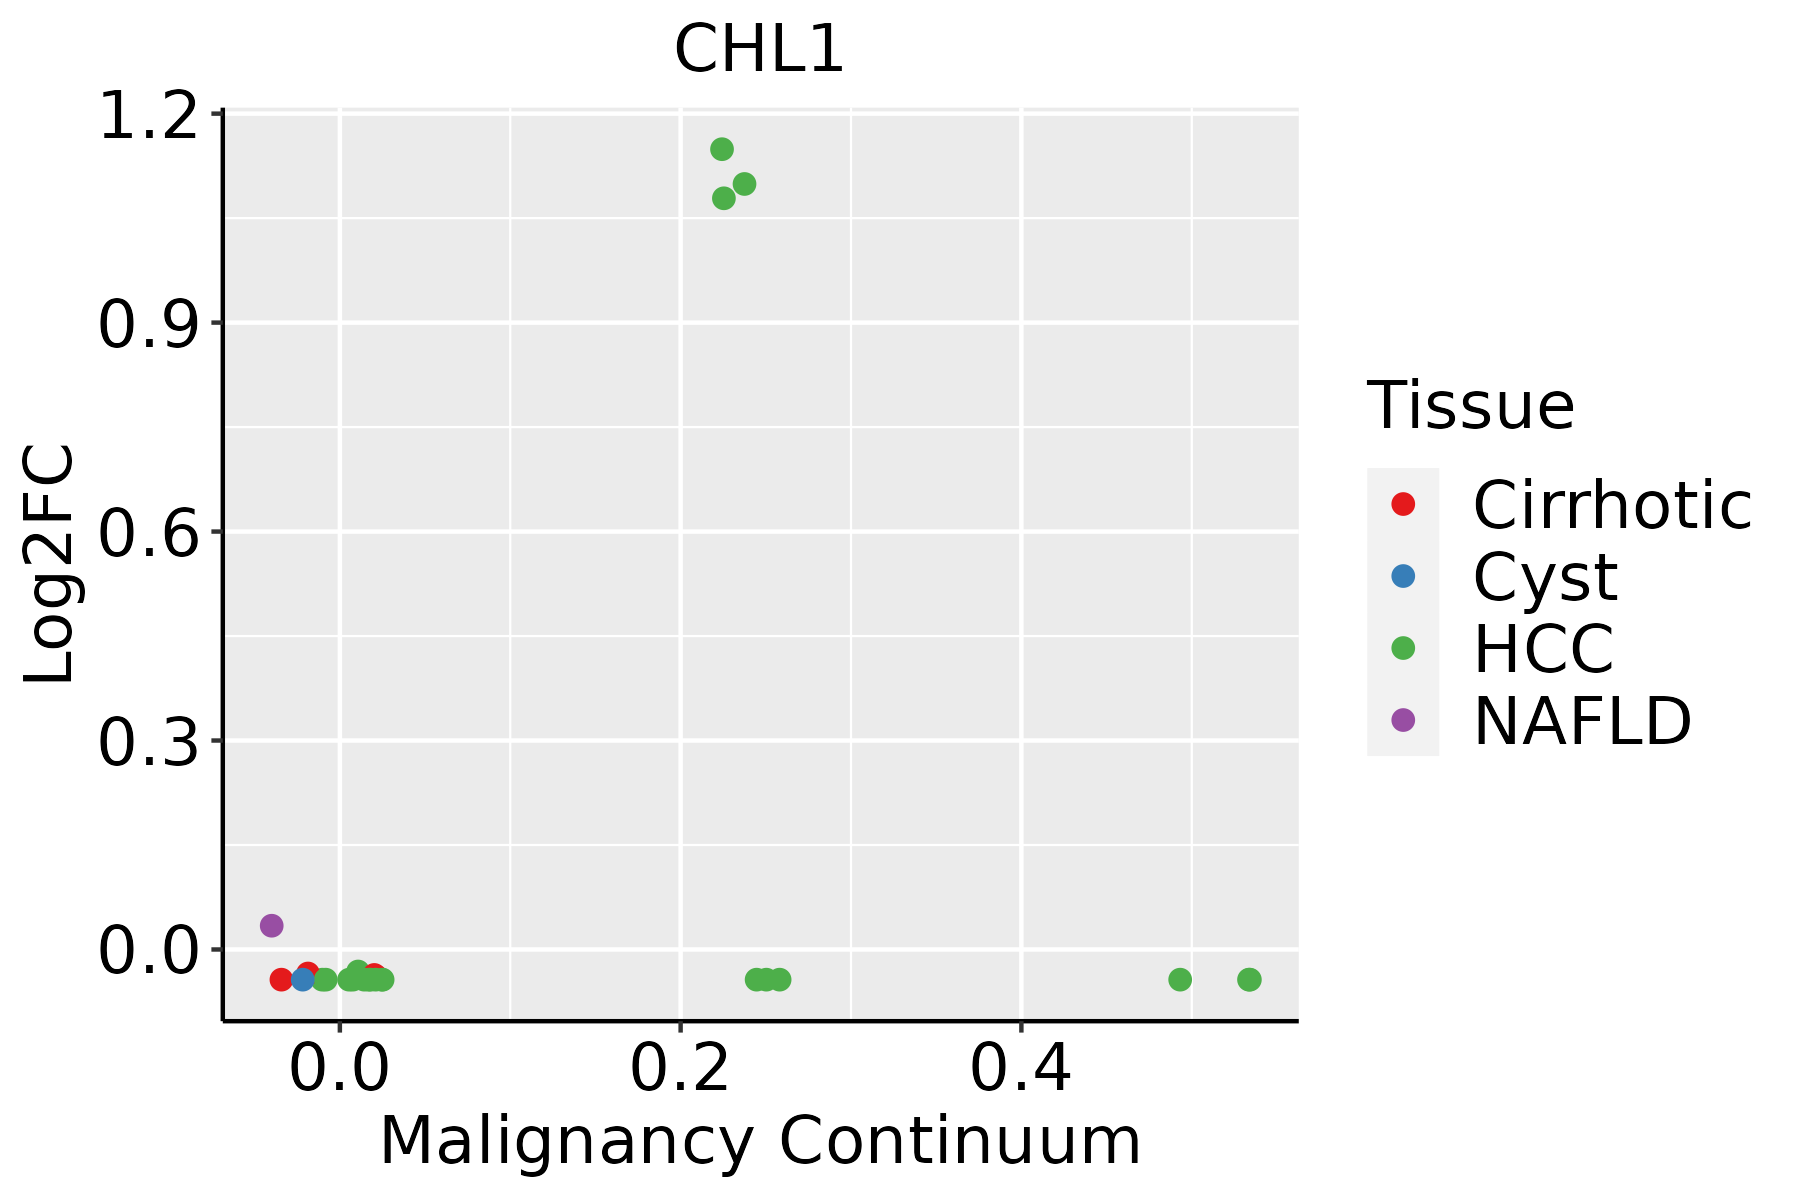
HCC: Hepatocellular carcinoma
NAFLD: Non-alcoholic fatty liver disease
LungThe image shows the transcriptomic changes along malignancy continuum.log2FC in expression of this searched gene in stem-like cells from each diseased tissue sample relative to stem-like cells in normal samples in each tissue plotted against the malignancy continuum. Samples are colored based on if they are from different disease stage.AAH: Atypical adenomatous hyperplasia
AIS: Adenocarcinoma in situ
IAC: Invasive lung adenocarcinoma
MIA: Minimally invasive adenocarcinoma
Oral CavityThe image shows the transcriptomic changes along malignancy continuum.log2FC in expression of this searched gene in stem-like cells from each diseased tissue sample relative to stem-like cells in normal samples in each tissue plotted against the malignancy continuum. Samples are colored based on if they are from different disease stage.EOLP: Erosive Oral lichen planus
LP: leukoplakia
NEOLP: Non-erosive oral lichen planus
OSCC: Oral squamous cell carcinoma
∗log2FC in expression of this searched gene in stem-like cells from each diseased tissue sample relative to stem-like cells in normal samples in each tissue plotted against the malignancy continuum. Samples are colored based on if they are from different disease stage.

Top

Malignant transformation related pathway analysis

check buttonFind out the enriched GO biological processes and KEGG pathways involved in transition from healthy to precancer to cancer
check button Figure of enriched GO biological processes.
TissueDisease StageEnriched GO biological Processes
ColorectumADGO analysis - Figure of enriched GO biological processes: Top 15 enriched GO BP terms are showed in the bar plot of each disease state in each tissue. Each row represents a significant GO biological process which is colored according to the -log10(p.adjust).
ColorectumSERGO analysis - Figure of enriched GO biological processes: Top 15 enriched GO BP terms are showed in the bar plot of each disease state in each tissue. Each row represents a significant GO biological process which is colored according to the -log10(p.adjust).
ColorectumMSSGO analysis - Figure of enriched GO biological processes: Top 15 enriched GO BP terms are showed in the bar plot of each disease state in each tissue. Each row represents a significant GO biological process which is colored according to the -log10(p.adjust).
ColorectumMSI-HGO analysis - Figure of enriched GO biological processes: Top 15 enriched GO BP terms are showed in the bar plot of each disease state in each tissue. Each row represents a significant GO biological process which is colored according to the -log10(p.adjust).
ColorectumFAPGO analysis - Figure of enriched GO biological processes: Top 15 enriched GO BP terms are showed in the bar plot of each disease state in each tissue. Each row represents a significant GO biological process which is colored according to the -log10(p.adjust).
∗Top 15 enriched GO BP terms are showed in the bar plot of each disease state in each tissue. Each row represents a significant GO biological process which is colored according to the -log10(p.adjust).
Page: 1 2 3 4 5 6 7 8 9 

check button Enriched GO biological processes.
GO IDTissueDisease StageDescriptionGene RatioBg Ratiopvaluep.adjustCount
GO:001049810CervixCCproteasomal protein catabolic process111/2311490/187238.98e-111.58e-08111
GO:004316110CervixCCproteasome-mediated ubiquitin-dependent protein catabolic process91/2311412/187231.65e-081.25e-0691
GO:00719007CervixCCregulation of protein serine/threonine kinase activity75/2311359/187232.76e-068.02e-0575
GO:005134810CervixCCnegative regulation of transferase activity60/2311268/187232.77e-068.02e-0560
GO:004593610CervixCCnegative regulation of phosphate metabolic process88/2311441/187232.92e-068.27e-0588
GO:001056310CervixCCnegative regulation of phosphorus metabolic process88/2311442/187233.21e-068.77e-0588
GO:004232610CervixCCnegative regulation of phosphorylation77/2311385/187231.09e-052.38e-0477
GO:00615647CervixCCaxon development89/2311467/187231.71e-053.27e-0489
GO:000193310CervixCCnegative regulation of protein phosphorylation69/2311342/187232.29e-054.01e-0469
GO:00516567CervixCCestablishment of organelle localization76/2311390/187233.17e-055.21e-0476
GO:000646910CervixCCnegative regulation of protein kinase activity47/2311212/187234.13e-056.36e-0447
GO:00336739CervixCCnegative regulation of kinase activity50/2311237/187239.22e-051.21e-0350
GO:00074097CervixCCaxonogenesis78/2311418/187231.14e-041.43e-0378
GO:00162367CervixCCmacroautophagy58/2311291/187231.40e-041.70e-0358
GO:00105067CervixCCregulation of autophagy61/2311317/187232.61e-042.87e-0361
GO:00307057CervixCCcytoskeleton-dependent intracellular transport40/2311195/187237.92e-046.99e-0340
GO:00426924CervixCCmuscle cell differentiation69/2311384/187238.12e-047.09e-0369
GO:00434099CervixCCnegative regulation of MAPK cascade37/2311180/187231.17e-039.50e-0337
GO:00516541CervixCCestablishment of mitochondrion localization10/231129/187231.74e-031.31e-0210
GO:00094109CervixCCresponse to xenobiotic stimulus78/2311462/187232.39e-031.70e-0278
Page: 1 2 3 4 5 6 7 8 9 10 11 

check button Enriched KEGG pathways.
Pathway IDTissueDisease StageDescriptionGene RatioBg Ratiopvaluep.adjustqvalueCount
Page: 1 

Top

Cell-cell communication analysis

check buttonIdentification of potential cell-cell interactions between two cell types and their ligand-receptor pairs for different disease states
LigandReceptorLRpairPathwayTissueDisease Stage
Page: 1 

Top

Single-cell gene regulatory network inference analysis

check buttonFind out the significant the regulons (TFs) and the target genes of each regulon across cell types for different disease states
TFCell TypeTissueDisease StageTarget GeneRSSRegulon Activity
∗The dot plots of a searched regulon are shown for all cell subpopulations in each disease state of each tissue based on the regulon specific score inferred using pySCENIC and by calculating the average expression.
Page: 1 

Top

Somatic mutation of malignant transformation related genes

check buttonAnnotation of somatic variants for genes involved in malignant transformation
Hugo SymbolVariant ClassVariant ClassificationdbSNP RSHGVScHGVSpHGVSp ShortSWISSPROTBIOTYPESIFTPolyPhenTumor Sample BarcodeTissueHistologySexAgeStageTherapy TypesDrugsOutcome
CHL1SNVMissense_Mutationc.1279C>Tp.Leu427Phep.L427FO00533protein_codingdeleterious(0)probably_damaging(0.998)TCGA-A2-A3Y0-01Breastbreast invasive carcinomaFemale<65I/IIChemotherapyadriamycinCR
CHL1SNVMissense_Mutationrs541454458c.1879G>Ap.Val627Ilep.V627IO00533protein_codingdeleterious(0.03)possibly_damaging(0.684)TCGA-A8-A09G-01Breastbreast invasive carcinomaFemale>=65III/IVUnknownUnknownSD
CHL1SNVMissense_Mutationrs141644867c.1456N>Tp.Arg486Trpp.R486WO00533protein_codingdeleterious(0)probably_damaging(0.996)TCGA-AO-A0JM-01Breastbreast invasive carcinomaFemale<65I/IIChemotherapydoxorubicinSD
CHL1SNVMissense_Mutationnovelc.820N>Ap.Leu274Metp.L274MO00533protein_codingdeleterious(0)probably_damaging(1)TCGA-PE-A5DE-01Breastbreast invasive carcinomaFemale<65I/IIChemotherapytaxotereCR
CHL1insertionNonsense_Mutationnovelc.2882_2883insAAAGGTTCAGAATGAGAAATAGCCAACTp.Asn961LysfsTer8p.N961Kfs*8O00533protein_codingTCGA-A8-A06X-01Breastbreast invasive carcinomaFemale>=65I/IIUnknownUnknownSD
CHL1deletionFrame_Shift_Delnovelc.3583delNp.Gly1195AspfsTer58p.G1195Dfs*58O00533protein_codingTCGA-D8-A27V-01Breastbreast invasive carcinomaFemale<65I/IIHormone TherapytamoxiphenSD
CHL1deletionFrame_Shift_Delnovelc.1086delNp.Ser362ArgfsTer79p.S362Rfs*79O00533protein_codingTCGA-EW-A2FV-01Breastbreast invasive carcinomaFemale<65III/IVChemotherapydocetaxelSD
CHL1SNVMissense_Mutationrs185238679c.1457G>Ap.Arg486Glnp.R486QO00533protein_codingdeleterious(0.03)probably_damaging(0.944)TCGA-2W-A8YY-01Cervixcervical & endocervical cancerFemale<65I/IIChemotherapycisplatinCR
CHL1SNVMissense_Mutationc.2629N>Tp.His877Tyrp.H877YO00533protein_codingtolerated(1)benign(0.283)TCGA-C5-A1BI-01Cervixcervical & endocervical cancerFemale<65III/IVChemotherapycisplatinSD
CHL1SNVMissense_Mutationnovelc.2606N>Tp.Lys869Ilep.K869IO00533protein_codingdeleterious(0.03)possibly_damaging(0.713)TCGA-C5-A7X3-01Cervixcervical & endocervical cancerFemale>=65III/IVChemotherapycisplatinSD
Page: 1 2 3 4 5 6 7 8 9 10 11 12 13 14 15 16 17 18 19 20 21 22 23 24 25 26 27 

Top

Related drugs of malignant transformation related genes

check buttonIdentification of chemicals and drugs interact with genes involved in malignant transfromation
(DGIdb 4.0)
Entrez IDSymbolCategoryInteraction TypesDrug Claim NameDrug NamePMIDs
Page: 1