
|
|||||
|
 | |
| |
| |
| |
| |
| |
|
Gene: CHKB |
Gene summary for CHKB |
| Gene information | Species | Human | Gene symbol | CHKB | Gene ID | 1120 |
| Gene name | choline kinase beta | |
| Gene Alias | CHETK | |
| Cytomap | 22q13.33 | |
| Gene Type | protein-coding | GO ID | GO:0006629 | UniProtAcc | A0A024R4X4 |
Top |
Malignant transformation analysis |
| Identification of the aberrant gene expression in precancerous and cancerous lesions by comparing the gene expression of stem-like cells in diseased tissues with normal stem cells |
| Entrez ID | Symbol | Replicates | Species | Organ | Tissue | Adj P-value | Log2FC | Malignancy |
| 1120 | CHKB | LZE4T | Human | Esophagus | ESCC | 5.72e-07 | 2.42e-01 | 0.0811 |
| 1120 | CHKB | LZE5T | Human | Esophagus | ESCC | 1.35e-08 | 3.86e-01 | 0.0514 |
| 1120 | CHKB | LZE7T | Human | Esophagus | ESCC | 1.47e-09 | 4.17e-01 | 0.0667 |
| 1120 | CHKB | LZE8T | Human | Esophagus | ESCC | 3.56e-04 | 2.26e-01 | 0.067 |
| 1120 | CHKB | LZE20T | Human | Esophagus | ESCC | 1.66e-03 | 1.68e-01 | 0.0662 |
| 1120 | CHKB | LZE22D1 | Human | Esophagus | HGIN | 2.14e-03 | 2.27e-01 | 0.0595 |
| 1120 | CHKB | LZE24D1 | Human | Esophagus | HGIN | 3.14e-03 | 5.56e-01 | 0.054 |
| 1120 | CHKB | LZE24T | Human | Esophagus | ESCC | 2.19e-25 | 5.64e-01 | 0.0596 |
| 1120 | CHKB | LZE21T | Human | Esophagus | ESCC | 1.57e-04 | 3.79e-01 | 0.0655 |
| 1120 | CHKB | P1T-E | Human | Esophagus | ESCC | 9.07e-11 | 3.86e-01 | 0.0875 |
| 1120 | CHKB | P2T-E | Human | Esophagus | ESCC | 8.91e-10 | 1.33e-01 | 0.1177 |
| 1120 | CHKB | P4T-E | Human | Esophagus | ESCC | 2.77e-03 | 1.34e-01 | 0.1323 |
| 1120 | CHKB | P5T-E | Human | Esophagus | ESCC | 9.38e-12 | 1.04e-01 | 0.1327 |
| 1120 | CHKB | P8T-E | Human | Esophagus | ESCC | 6.42e-13 | 1.46e-01 | 0.0889 |
| 1120 | CHKB | P10T-E | Human | Esophagus | ESCC | 1.19e-12 | 1.93e-01 | 0.116 |
| 1120 | CHKB | P11T-E | Human | Esophagus | ESCC | 1.62e-09 | 4.12e-01 | 0.1426 |
| 1120 | CHKB | P12T-E | Human | Esophagus | ESCC | 1.14e-14 | 1.80e-01 | 0.1122 |
| 1120 | CHKB | P15T-E | Human | Esophagus | ESCC | 3.33e-10 | 2.50e-01 | 0.1149 |
| 1120 | CHKB | P16T-E | Human | Esophagus | ESCC | 1.43e-14 | 1.93e-01 | 0.1153 |
| 1120 | CHKB | P17T-E | Human | Esophagus | ESCC | 7.42e-08 | 3.00e-01 | 0.1278 |
| Page: 1 2 3 |
| Tissue | Expression Dynamics | Abbreviation |
| Esophagus | 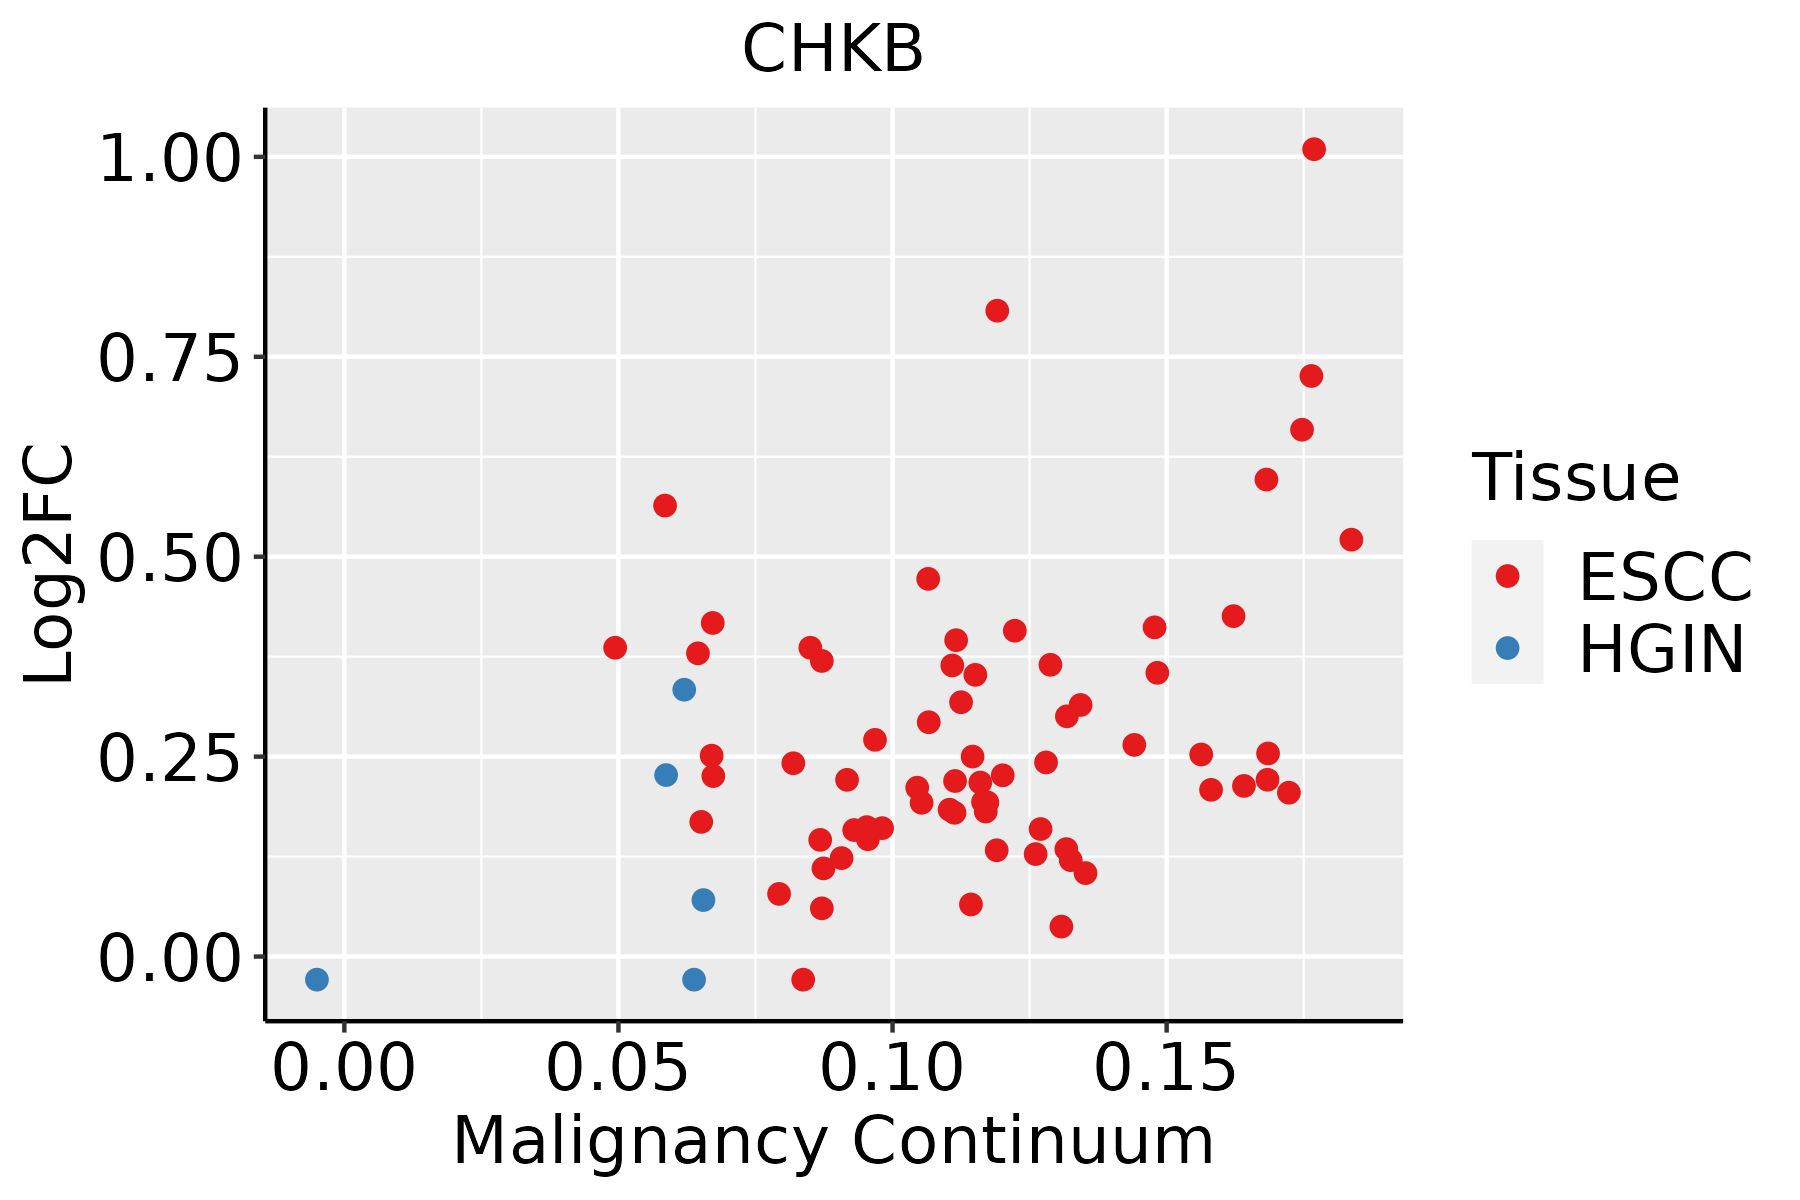 | ESCC: Esophageal squamous cell carcinoma |
| HGIN: High-grade intraepithelial neoplasias | ||
| LGIN: Low-grade intraepithelial neoplasias |
| ∗log2FC in expression of this searched gene in stem-like cells from each diseased tissue sample relative to stem-like cells in normal samples in each tissue plotted against the malignancy continuum. Samples are colored based on if they are from different disease stage. |
Top |
Malignant transformation related pathway analysis |
| Find out the enriched GO biological processes and KEGG pathways involved in transition from healthy to precancer to cancer |
| Tissue | Disease Stage | Enriched GO biological Processes |
| Colorectum | AD |  |
| Colorectum | SER |  |
| Colorectum | MSS |  |
| Colorectum | MSI-H |  |
| Colorectum | FAP |  |
| ∗Top 15 enriched GO BP terms are showed in the bar plot of each disease state in each tissue. Each row represents a significant GO biological process which is colored according to the -log10(p.adjust). |
| Page: 1 2 3 4 5 6 7 8 9 |
| GO ID | Tissue | Disease Stage | Description | Gene Ratio | Bg Ratio | pvalue | p.adjust | Count |
| GO:00086544 | Esophagus | ESCC | phospholipid biosynthetic process | 162/8552 | 253/18723 | 2.59e-09 | 5.73e-08 | 162 |
| GO:00464744 | Esophagus | ESCC | glycerophospholipid biosynthetic process | 135/8552 | 211/18723 | 5.75e-08 | 1.02e-06 | 135 |
| GO:00450175 | Esophagus | ESCC | glycerolipid biosynthetic process | 154/8552 | 252/18723 | 5.20e-07 | 6.96e-06 | 154 |
| GO:00066446 | Esophagus | ESCC | phospholipid metabolic process | 218/8552 | 383/18723 | 5.37e-06 | 5.59e-05 | 218 |
| GO:00066561 | Esophagus | ESCC | phosphatidylcholine biosynthetic process | 24/8552 | 29/18723 | 4.50e-05 | 3.55e-04 | 24 |
| GO:00066505 | Esophagus | ESCC | glycerophospholipid metabolic process | 174/8552 | 306/18723 | 4.92e-05 | 3.85e-04 | 174 |
| GO:0006646 | Esophagus | ESCC | phosphatidylethanolamine biosynthetic process | 10/8552 | 10/18723 | 3.94e-04 | 2.26e-03 | 10 |
| GO:00464864 | Esophagus | ESCC | glycerolipid metabolic process | 211/8552 | 392/18723 | 6.51e-04 | 3.46e-03 | 211 |
| Page: 1 |
| Pathway ID | Tissue | Disease Stage | Description | Gene Ratio | Bg Ratio | pvalue | p.adjust | qvalue | Count |
| hsa052319 | Esophagus | ESCC | Choline metabolism in cancer | 61/4205 | 98/8465 | 7.97e-03 | 1.92e-02 | 9.84e-03 | 61 |
| hsa0523114 | Esophagus | ESCC | Choline metabolism in cancer | 61/4205 | 98/8465 | 7.97e-03 | 1.92e-02 | 9.84e-03 | 61 |
| Page: 1 |
Top |
Cell-cell communication analysis |
| Identification of potential cell-cell interactions between two cell types and their ligand-receptor pairs for different disease states |
| Ligand | Receptor | LRpair | Pathway | Tissue | Disease Stage |
| Page: 1 |
Top |
Single-cell gene regulatory network inference analysis |
| Find out the significant the regulons (TFs) and the target genes of each regulon across cell types for different disease states |
| TF | Cell Type | Tissue | Disease Stage | Target Gene | RSS | Regulon Activity |
| ∗The dot plots of a searched regulon are shown for all cell subpopulations in each disease state of each tissue based on the regulon specific score inferred using pySCENIC and by calculating the average expression. |
| Page: 1 |
Top |
Somatic mutation of malignant transformation related genes |
| Annotation of somatic variants for genes involved in malignant transformation |
| Hugo Symbol | Variant Class | Variant Classification | dbSNP RS | HGVSc | HGVSp | HGVSp Short | SWISSPROT | BIOTYPE | SIFT | PolyPhen | Tumor Sample Barcode | Tissue | Histology | Sex | Age | Stage | Therapy Types | Drugs | Outcome |
| CHKB | SNV | Missense_Mutation | rs764209313 | c.701C>T | p.Ser234Leu | p.S234L | Q9Y259 | protein_coding | deleterious(0.01) | probably_damaging(0.999) | TCGA-AN-A046-01 | Breast | breast invasive carcinoma | Female | >=65 | I/II | Unknown | Unknown | SD |
| CHKB | SNV | Missense_Mutation | c.955G>A | p.Glu319Lys | p.E319K | Q9Y259 | protein_coding | tolerated(0.07) | possibly_damaging(0.817) | TCGA-E2-A10C-01 | Breast | breast invasive carcinoma | Female | <65 | I/II | Chemotherapy | cytoxan | SD | |
| CHKB | SNV | Missense_Mutation | c.355N>C | p.Glu119Gln | p.E119Q | Q9Y259 | protein_coding | deleterious(0.02) | probably_damaging(0.996) | TCGA-DR-A0ZM-01 | Cervix | cervical & endocervical cancer | Female | <65 | III/IV | Unspecific | Cisplatin | SD | |
| CHKB | SNV | Missense_Mutation | c.523C>G | p.His175Asp | p.H175D | Q9Y259 | protein_coding | deleterious(0) | probably_damaging(1) | TCGA-EK-A2RK-01 | Cervix | cervical & endocervical cancer | Female | >=65 | I/II | Unknown | Unknown | SD | |
| CHKB | SNV | Missense_Mutation | novel | c.757G>C | p.Glu253Gln | p.E253Q | Q9Y259 | protein_coding | tolerated(0.29) | benign(0.127) | TCGA-MA-AA41-01 | Cervix | cervical & endocervical cancer | Female | <65 | I/II | Unknown | Unknown | SD |
| CHKB | SNV | Missense_Mutation | c.340N>A | p.Asp114Asn | p.D114N | Q9Y259 | protein_coding | deleterious(0.02) | benign(0.031) | TCGA-AA-3502-01 | Colorectum | colon adenocarcinoma | Male | >=65 | I/II | Unknown | Unknown | SD | |
| CHKB | SNV | Missense_Mutation | rs143218928 | c.961A>G | p.Lys321Glu | p.K321E | Q9Y259 | protein_coding | tolerated(0.51) | benign(0.003) | TCGA-CM-4751-01 | Colorectum | colon adenocarcinoma | Male | <65 | III/IV | Chemotherapy | oxaliplatin | SD |
| CHKB | SNV | Missense_Mutation | novel | c.161N>T | p.Arg54Leu | p.R54L | Q9Y259 | protein_coding | deleterious(0) | possibly_damaging(0.476) | TCGA-D5-6536-01 | Colorectum | colon adenocarcinoma | Male | >=65 | I/II | Chemotherapy | 5-fu | SD |
| CHKB | SNV | Missense_Mutation | rs577953900 | c.941N>A | p.Arg314His | p.R314H | Q9Y259 | protein_coding | deleterious(0.04) | benign(0.04) | TCGA-F4-6570-01 | Colorectum | colon adenocarcinoma | Female | >=65 | I/II | Unknown | Unknown | SD |
| CHKB | SNV | Missense_Mutation | novel | c.1037N>A | p.Ala346Asp | p.A346D | Q9Y259 | protein_coding | deleterious(0) | probably_damaging(0.985) | TCGA-A5-A1OF-01 | Endometrium | uterine corpus endometrioid carcinoma | Female | <65 | I/II | Unknown | Unknown | SD |
| Page: 1 2 3 4 |
Top |
Related drugs of malignant transformation related genes |
| Identification of chemicals and drugs interact with genes involved in malignant transfromation |
| (DGIdb 4.0) |
| Entrez ID | Symbol | Category | Interaction Types | Drug Claim Name | Drug Name | PMIDs |
| Page: 1 |

Copyright 2023-Present -The University of Texas Health Science Center at Houston |