
|
|||||
|
 | |
| |
| |
| |
| |
| |
|
Gene: CHID1 |
Gene summary for CHID1 |
| Gene information | Species | Human | Gene symbol | CHID1 | Gene ID | 66005 |
| Gene name | chitinase domain containing 1 | |
| Gene Alias | GL008 | |
| Cytomap | 11p15.5 | |
| Gene Type | protein-coding | GO ID | GO:0001816 | UniProtAcc | Q9BWS9 |
Top |
Malignant transformation analysis |
| Identification of the aberrant gene expression in precancerous and cancerous lesions by comparing the gene expression of stem-like cells in diseased tissues with normal stem cells |
| Entrez ID | Symbol | Replicates | Species | Organ | Tissue | Adj P-value | Log2FC | Malignancy |
| 66005 | CHID1 | HTA11_1938_2000001011 | Human | Colorectum | AD | 4.87e-04 | 4.05e-01 | -0.0811 |
| 66005 | CHID1 | HTA11_347_2000001011 | Human | Colorectum | AD | 3.98e-05 | 2.74e-01 | -0.1954 |
| 66005 | CHID1 | HTA11_83_2000001011 | Human | Colorectum | SER | 3.36e-03 | 3.66e-01 | -0.1526 |
| 66005 | CHID1 | HTA11_696_2000001011 | Human | Colorectum | AD | 3.14e-07 | 3.68e-01 | -0.1464 |
| 66005 | CHID1 | HTA11_1391_2000001011 | Human | Colorectum | AD | 3.50e-08 | 4.37e-01 | -0.059 |
| 66005 | CHID1 | HTA11_5216_2000001011 | Human | Colorectum | SER | 2.83e-02 | 4.41e-01 | -0.1462 |
| 66005 | CHID1 | HTA11_866_3004761011 | Human | Colorectum | AD | 1.13e-03 | 3.18e-01 | 0.096 |
| 66005 | CHID1 | HTA11_4255_2000001011 | Human | Colorectum | SER | 5.40e-03 | 5.09e-01 | 0.0446 |
| 66005 | CHID1 | HTA11_8622_2000001021 | Human | Colorectum | SER | 3.60e-03 | 4.05e-01 | 0.0528 |
| 66005 | CHID1 | HTA11_7663_2000001011 | Human | Colorectum | SER | 8.18e-04 | 4.84e-01 | 0.0131 |
| 66005 | CHID1 | HTA11_10711_2000001011 | Human | Colorectum | AD | 5.17e-04 | 3.47e-01 | 0.0338 |
| 66005 | CHID1 | HTA11_7696_3000711011 | Human | Colorectum | AD | 5.28e-12 | 4.33e-01 | 0.0674 |
| 66005 | CHID1 | HTA11_6818_2000001021 | Human | Colorectum | AD | 1.75e-02 | 2.34e-01 | 0.0588 |
| 66005 | CHID1 | HTA11_99999970781_79442 | Human | Colorectum | MSS | 4.90e-08 | 3.41e-01 | 0.294 |
| 66005 | CHID1 | HTA11_99999965104_69814 | Human | Colorectum | MSS | 2.66e-02 | 2.87e-01 | 0.281 |
| 66005 | CHID1 | HTA11_99999971662_82457 | Human | Colorectum | MSS | 1.49e-29 | 8.43e-01 | 0.3859 |
| 66005 | CHID1 | HTA11_99999973899_84307 | Human | Colorectum | MSS | 3.38e-03 | 4.42e-01 | 0.2585 |
| 66005 | CHID1 | HTA11_99999974143_84620 | Human | Colorectum | MSS | 2.47e-05 | 2.95e-01 | 0.3005 |
| 66005 | CHID1 | LZE4T | Human | Esophagus | ESCC | 4.86e-11 | 1.54e-01 | 0.0811 |
| 66005 | CHID1 | LZE8T | Human | Esophagus | ESCC | 3.35e-14 | 4.27e-01 | 0.067 |
| Page: 1 2 3 4 5 6 7 |
| Tissue | Expression Dynamics | Abbreviation |
| Colorectum (GSE201348) |  | FAP: Familial adenomatous polyposis |
| CRC: Colorectal cancer | ||
| Colorectum (HTA11) |  | AD: Adenomas |
| SER: Sessile serrated lesions | ||
| MSI-H: Microsatellite-high colorectal cancer | ||
| MSS: Microsatellite stable colorectal cancer | ||
| Esophagus |  | ESCC: Esophageal squamous cell carcinoma |
| HGIN: High-grade intraepithelial neoplasias | ||
| LGIN: Low-grade intraepithelial neoplasias | ||
| Liver | 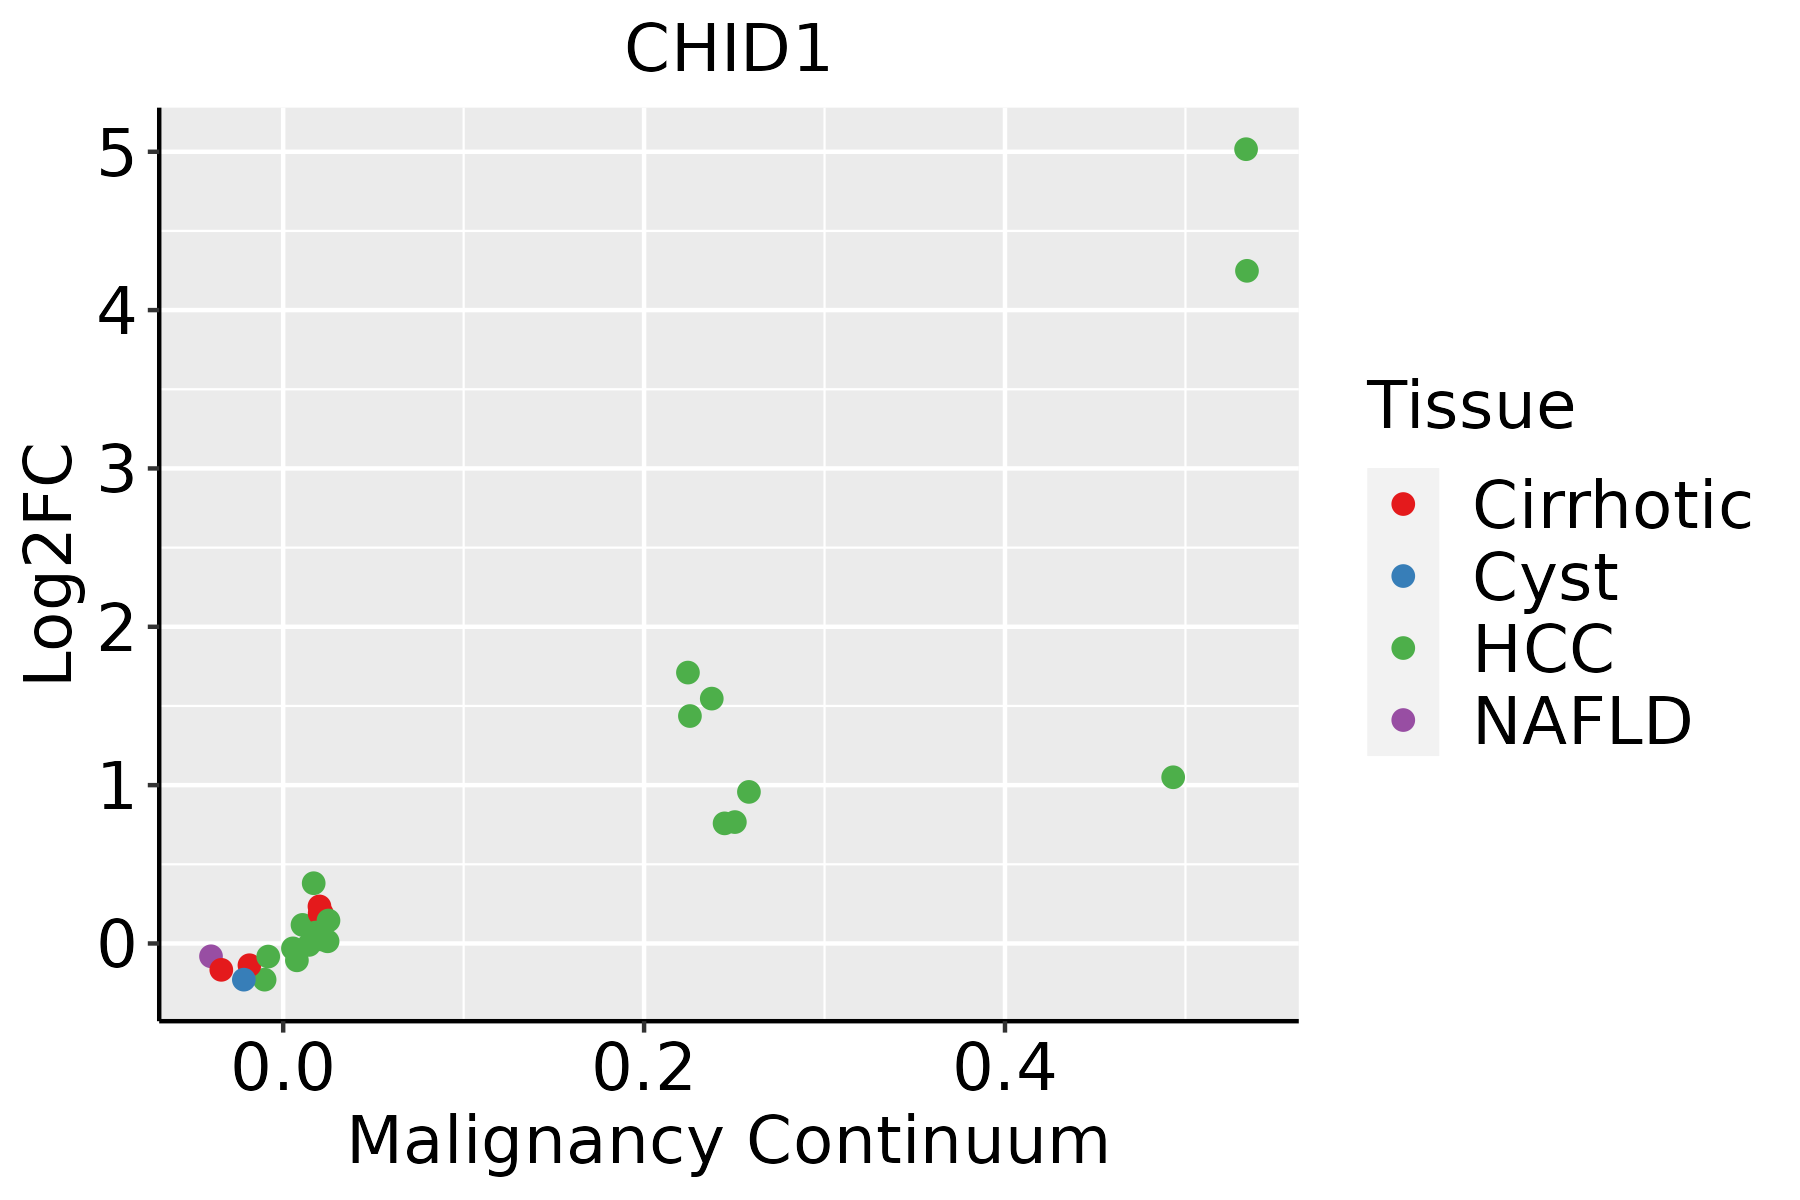 | HCC: Hepatocellular carcinoma |
| NAFLD: Non-alcoholic fatty liver disease | ||
| Oral Cavity | 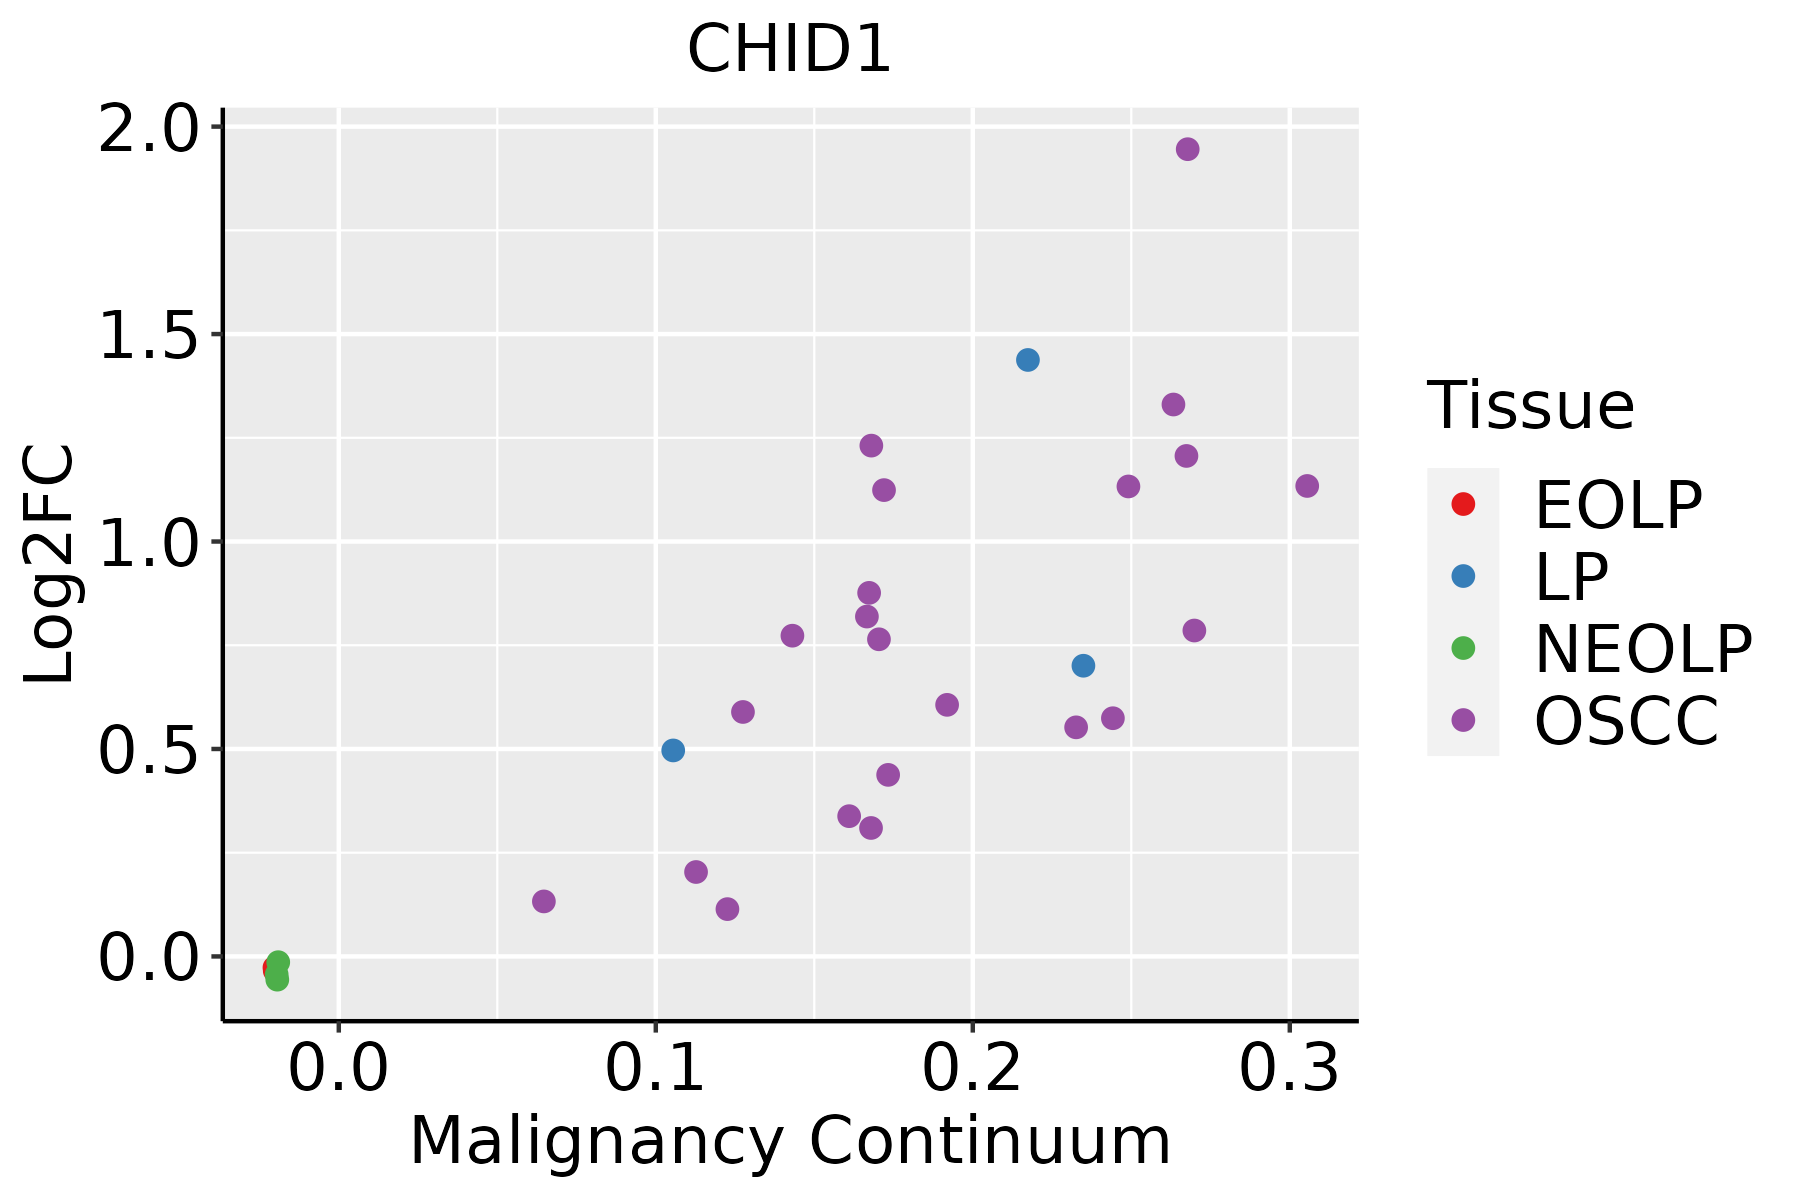 | EOLP: Erosive Oral lichen planus |
| LP: leukoplakia | ||
| NEOLP: Non-erosive oral lichen planus | ||
| OSCC: Oral squamous cell carcinoma | ||
| Skin | 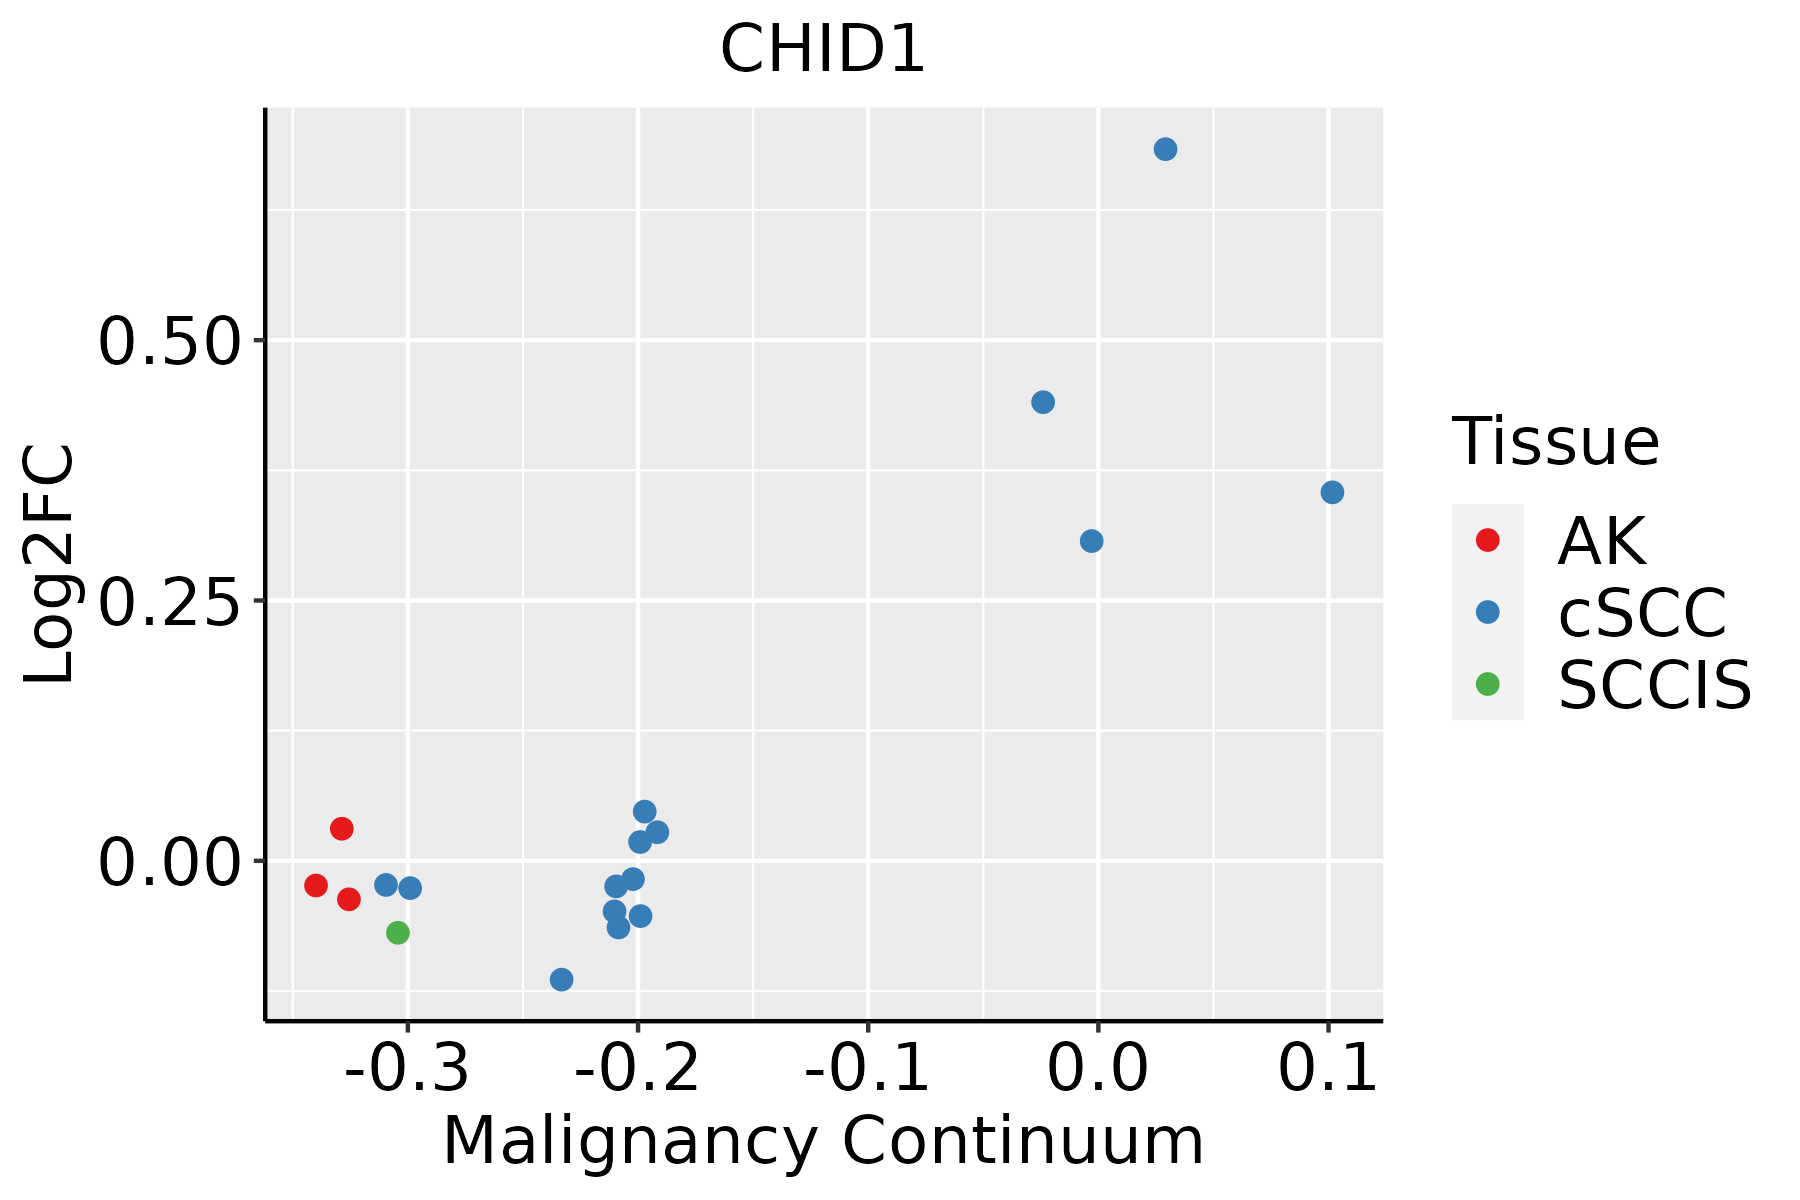 | AK: Actinic keratosis |
| cSCC: Cutaneous squamous cell carcinoma | ||
| SCCIS:squamous cell carcinoma in situ | ||
| Thyroid | 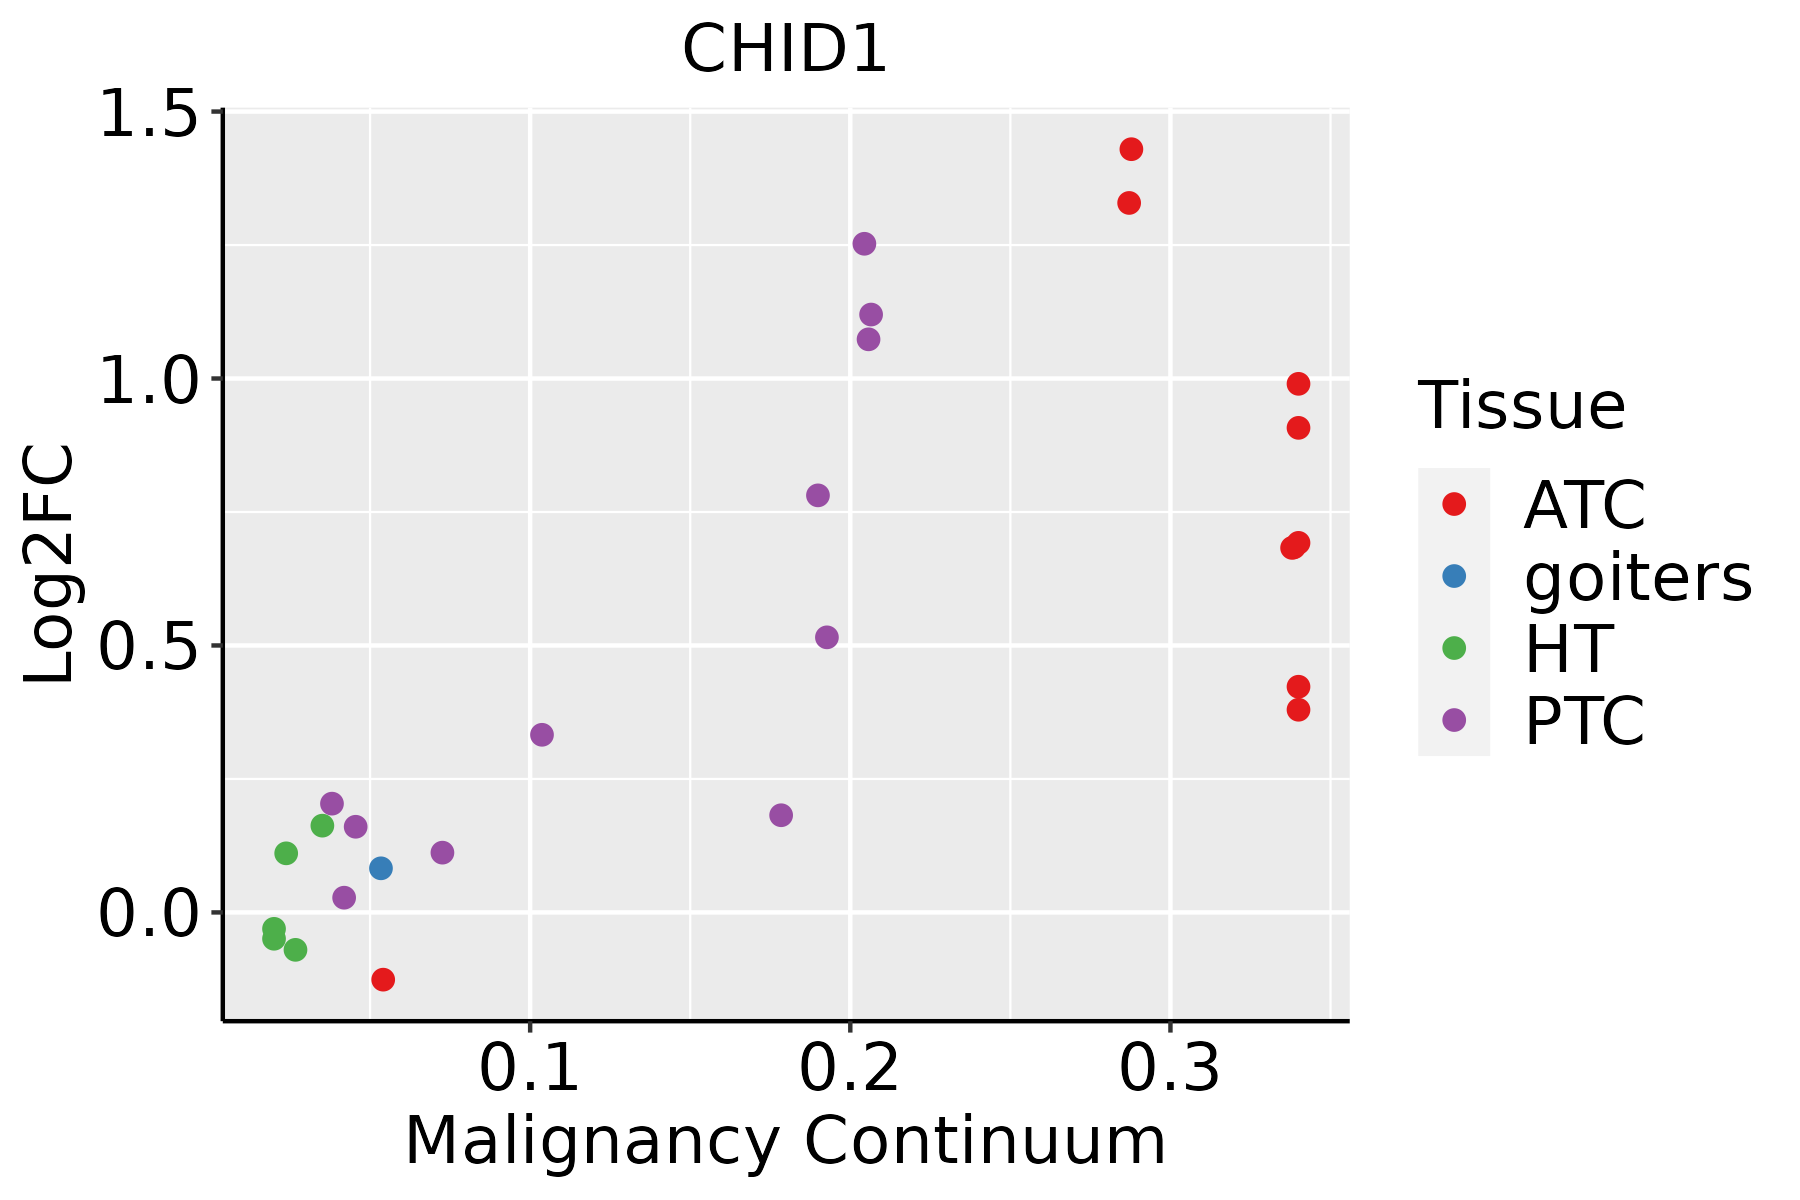 | ATC: Anaplastic thyroid cancer |
| HT: Hashimoto's thyroiditis | ||
| PTC: Papillary thyroid cancer |
| ∗log2FC in expression of this searched gene in stem-like cells from each diseased tissue sample relative to stem-like cells in normal samples in each tissue plotted against the malignancy continuum. Samples are colored based on if they are from different disease stage. |
Top |
Malignant transformation related pathway analysis |
| Find out the enriched GO biological processes and KEGG pathways involved in transition from healthy to precancer to cancer |
| Tissue | Disease Stage | Enriched GO biological Processes |
| Colorectum | AD |  |
| Colorectum | SER |  |
| Colorectum | MSS |  |
| Colorectum | MSI-H |  |
| Colorectum | FAP |  |
| ∗Top 15 enriched GO BP terms are showed in the bar plot of each disease state in each tissue. Each row represents a significant GO biological process which is colored according to the -log10(p.adjust). |
| Page: 1 2 3 4 5 6 7 8 9 |
| GO ID | Tissue | Disease Stage | Description | Gene Ratio | Bg Ratio | pvalue | p.adjust | Count |
| Page: 1 |
| Pathway ID | Tissue | Disease Stage | Description | Gene Ratio | Bg Ratio | pvalue | p.adjust | qvalue | Count |
| Page: 1 |
Top |
Cell-cell communication analysis |
| Identification of potential cell-cell interactions between two cell types and their ligand-receptor pairs for different disease states |
| Ligand | Receptor | LRpair | Pathway | Tissue | Disease Stage |
| Page: 1 |
Top |
Single-cell gene regulatory network inference analysis |
| Find out the significant the regulons (TFs) and the target genes of each regulon across cell types for different disease states |
| TF | Cell Type | Tissue | Disease Stage | Target Gene | RSS | Regulon Activity |
| ∗The dot plots of a searched regulon are shown for all cell subpopulations in each disease state of each tissue based on the regulon specific score inferred using pySCENIC and by calculating the average expression. |
| Page: 1 |
Top |
Somatic mutation of malignant transformation related genes |
| Annotation of somatic variants for genes involved in malignant transformation |
| Hugo Symbol | Variant Class | Variant Classification | dbSNP RS | HGVSc | HGVSp | HGVSp Short | SWISSPROT | BIOTYPE | SIFT | PolyPhen | Tumor Sample Barcode | Tissue | Histology | Sex | Age | Stage | Therapy Types | Drugs | Outcome |
| CHID1 | SNV | Missense_Mutation | c.632N>C | p.Phe211Ser | p.F211S | Q9BWS9 | protein_coding | deleterious(0) | probably_damaging(1) | TCGA-FU-A3HZ-01 | Cervix | cervical & endocervical cancer | Female | <65 | I/II | Chemotherapy | cisplatin | CR | |
| CHID1 | SNV | Missense_Mutation | rs758172690 | c.950N>A | p.Arg317Gln | p.R317Q | Q9BWS9 | protein_coding | deleterious(0) | possibly_damaging(0.738) | TCGA-MY-A5BD-01 | Cervix | cervical & endocervical cancer | Female | <65 | I/II | Chemotherapy | cisplatin | CR |
| CHID1 | SNV | Missense_Mutation | novel | c.698N>C | p.Met233Thr | p.M233T | Q9BWS9 | protein_coding | deleterious(0.04) | benign(0.224) | TCGA-5M-AAT6-01 | Colorectum | colon adenocarcinoma | Female | <65 | III/IV | Unknown | Unknown | PD |
| CHID1 | SNV | Missense_Mutation | rs376582815 | c.88N>A | p.Ala30Thr | p.A30T | Q9BWS9 | protein_coding | tolerated_low_confidence(0.06) | benign(0.261) | TCGA-WS-AB45-01 | Colorectum | colon adenocarcinoma | Female | <65 | I/II | Unknown | Unknown | SD |
| CHID1 | SNV | Missense_Mutation | novel | c.619A>G | p.Lys207Glu | p.K207E | Q9BWS9 | protein_coding | deleterious(0) | benign(0.117) | TCGA-EI-6917-01 | Colorectum | rectum adenocarcinoma | Male | <65 | III/IV | Chemotherapy | 5fluorouracil+oxaciplatina+l-folinian | SD |
| CHID1 | SNV | Missense_Mutation | novel | c.988N>A | p.Asp330Asn | p.D330N | Q9BWS9 | protein_coding | deleterious(0.01) | possibly_damaging(0.491) | TCGA-A5-A0G2-01 | Endometrium | uterine corpus endometrioid carcinoma | Female | <65 | III/IV | Unknown | Unknown | SD |
| CHID1 | SNV | Missense_Mutation | rs143153872 | c.400N>A | p.Val134Ile | p.V134I | Q9BWS9 | protein_coding | deleterious(0) | probably_damaging(0.943) | TCGA-A5-A2K3-01 | Endometrium | uterine corpus endometrioid carcinoma | Female | >=65 | I/II | Chemotherapy | carboplatin | SD |
| CHID1 | SNV | Missense_Mutation | novel | c.634N>A | p.Asp212Asn | p.D212N | Q9BWS9 | protein_coding | tolerated(0.07) | possibly_damaging(0.452) | TCGA-A5-A2K5-01 | Endometrium | uterine corpus endometrioid carcinoma | Female | >=65 | I/II | Unknown | Unknown | SD |
| CHID1 | SNV | Missense_Mutation | novel | c.965N>C | p.Leu322Pro | p.L322P | Q9BWS9 | protein_coding | deleterious(0) | probably_damaging(0.927) | TCGA-AJ-A23O-01 | Endometrium | uterine corpus endometrioid carcinoma | Female | >=65 | I/II | Unknown | Unknown | SD |
| CHID1 | SNV | Missense_Mutation | novel | c.1219N>A | p.Leu407Met | p.L407M | Q9BWS9 | protein_coding | deleterious(0.03) | probably_damaging(0.995) | TCGA-AJ-A3BG-01 | Endometrium | uterine corpus endometrioid carcinoma | Female | >=65 | I/II | Chemotherapy | carboplatin | PD |
| Page: 1 2 3 4 |
Top |
Related drugs of malignant transformation related genes |
| Identification of chemicals and drugs interact with genes involved in malignant transfromation |
| (DGIdb 4.0) |
| Entrez ID | Symbol | Category | Interaction Types | Drug Claim Name | Drug Name | PMIDs |
| Page: 1 |

Copyright 2023-Present -The University of Texas Health Science Center at Houston |