
|
|||||
|
 | |
| |
| |
| |
| |
| |
|
Gene: CHIC2 |
Gene summary for CHIC2 |
| Gene information | Species | Human | Gene symbol | CHIC2 | Gene ID | 26511 |
| Gene name | cysteine rich hydrophobic domain 2 | |
| Gene Alias | BTL | |
| Cytomap | 4q12 | |
| Gene Type | protein-coding | GO ID | GO:0008150 | UniProtAcc | Q9UKJ5 |
Top |
Malignant transformation analysis |
| Identification of the aberrant gene expression in precancerous and cancerous lesions by comparing the gene expression of stem-like cells in diseased tissues with normal stem cells |
| Entrez ID | Symbol | Replicates | Species | Organ | Tissue | Adj P-value | Log2FC | Malignancy |
| 26511 | CHIC2 | AEH-subject1 | Human | Endometrium | AEH | 8.26e-06 | 2.32e-01 | -0.3059 |
| 26511 | CHIC2 | AEH-subject5 | Human | Endometrium | AEH | 1.91e-02 | 2.06e-01 | -0.2953 |
| 26511 | CHIC2 | GSM5276934 | Human | Endometrium | EEC | 1.20e-19 | 5.13e-01 | -0.0913 |
| 26511 | CHIC2 | GSM5276937 | Human | Endometrium | EEC | 1.30e-35 | 7.89e-01 | -0.0897 |
| 26511 | CHIC2 | GSM6177620_NYU_UCEC1_lib1_lib1 | Human | Endometrium | EEC | 2.32e-04 | -1.58e-01 | -0.1869 |
| 26511 | CHIC2 | GSM6177620_NYU_UCEC1_lib2_lib2 | Human | Endometrium | EEC | 2.72e-04 | -1.72e-01 | -0.1875 |
| 26511 | CHIC2 | GSM6177620_NYU_UCEC1_lib3_lib3 | Human | Endometrium | EEC | 9.90e-07 | -1.40e-01 | -0.1883 |
| 26511 | CHIC2 | GSM6177621_NYU_UCEC2_lib1_lib1 | Human | Endometrium | EEC | 1.43e-07 | -1.46e-01 | -0.1934 |
| 26511 | CHIC2 | GSM6177622_NYU_UCEC3_lib1_lib1 | Human | Endometrium | EEC | 3.79e-14 | -8.13e-02 | -0.1917 |
| 26511 | CHIC2 | GSM6177622_NYU_UCEC3_lib2_lib2 | Human | Endometrium | EEC | 1.81e-11 | -1.10e-01 | -0.1916 |
| 26511 | CHIC2 | LZE2T | Human | Esophagus | ESCC | 2.79e-02 | 3.65e-01 | 0.082 |
| 26511 | CHIC2 | LZE4T | Human | Esophagus | ESCC | 3.51e-14 | 3.50e-01 | 0.0811 |
| 26511 | CHIC2 | LZE7T | Human | Esophagus | ESCC | 9.30e-07 | 7.68e-01 | 0.0667 |
| 26511 | CHIC2 | LZE8T | Human | Esophagus | ESCC | 3.21e-11 | 9.47e-02 | 0.067 |
| 26511 | CHIC2 | LZE20T | Human | Esophagus | ESCC | 1.60e-11 | 1.57e-01 | 0.0662 |
| 26511 | CHIC2 | LZE22D1 | Human | Esophagus | HGIN | 1.45e-02 | -7.96e-02 | 0.0595 |
| 26511 | CHIC2 | LZE24T | Human | Esophagus | ESCC | 1.20e-18 | 5.04e-01 | 0.0596 |
| 26511 | CHIC2 | LZE6T | Human | Esophagus | ESCC | 9.52e-04 | -3.83e-02 | 0.0845 |
| 26511 | CHIC2 | P2T-E | Human | Esophagus | ESCC | 1.52e-39 | 7.08e-01 | 0.1177 |
| 26511 | CHIC2 | P4T-E | Human | Esophagus | ESCC | 1.79e-24 | 5.65e-01 | 0.1323 |
| Page: 1 2 3 4 5 6 7 |
| Tissue | Expression Dynamics | Abbreviation |
| Endometrium |  | AEH: Atypical endometrial hyperplasia |
| EEC: Endometrioid Cancer | ||
| Esophagus | 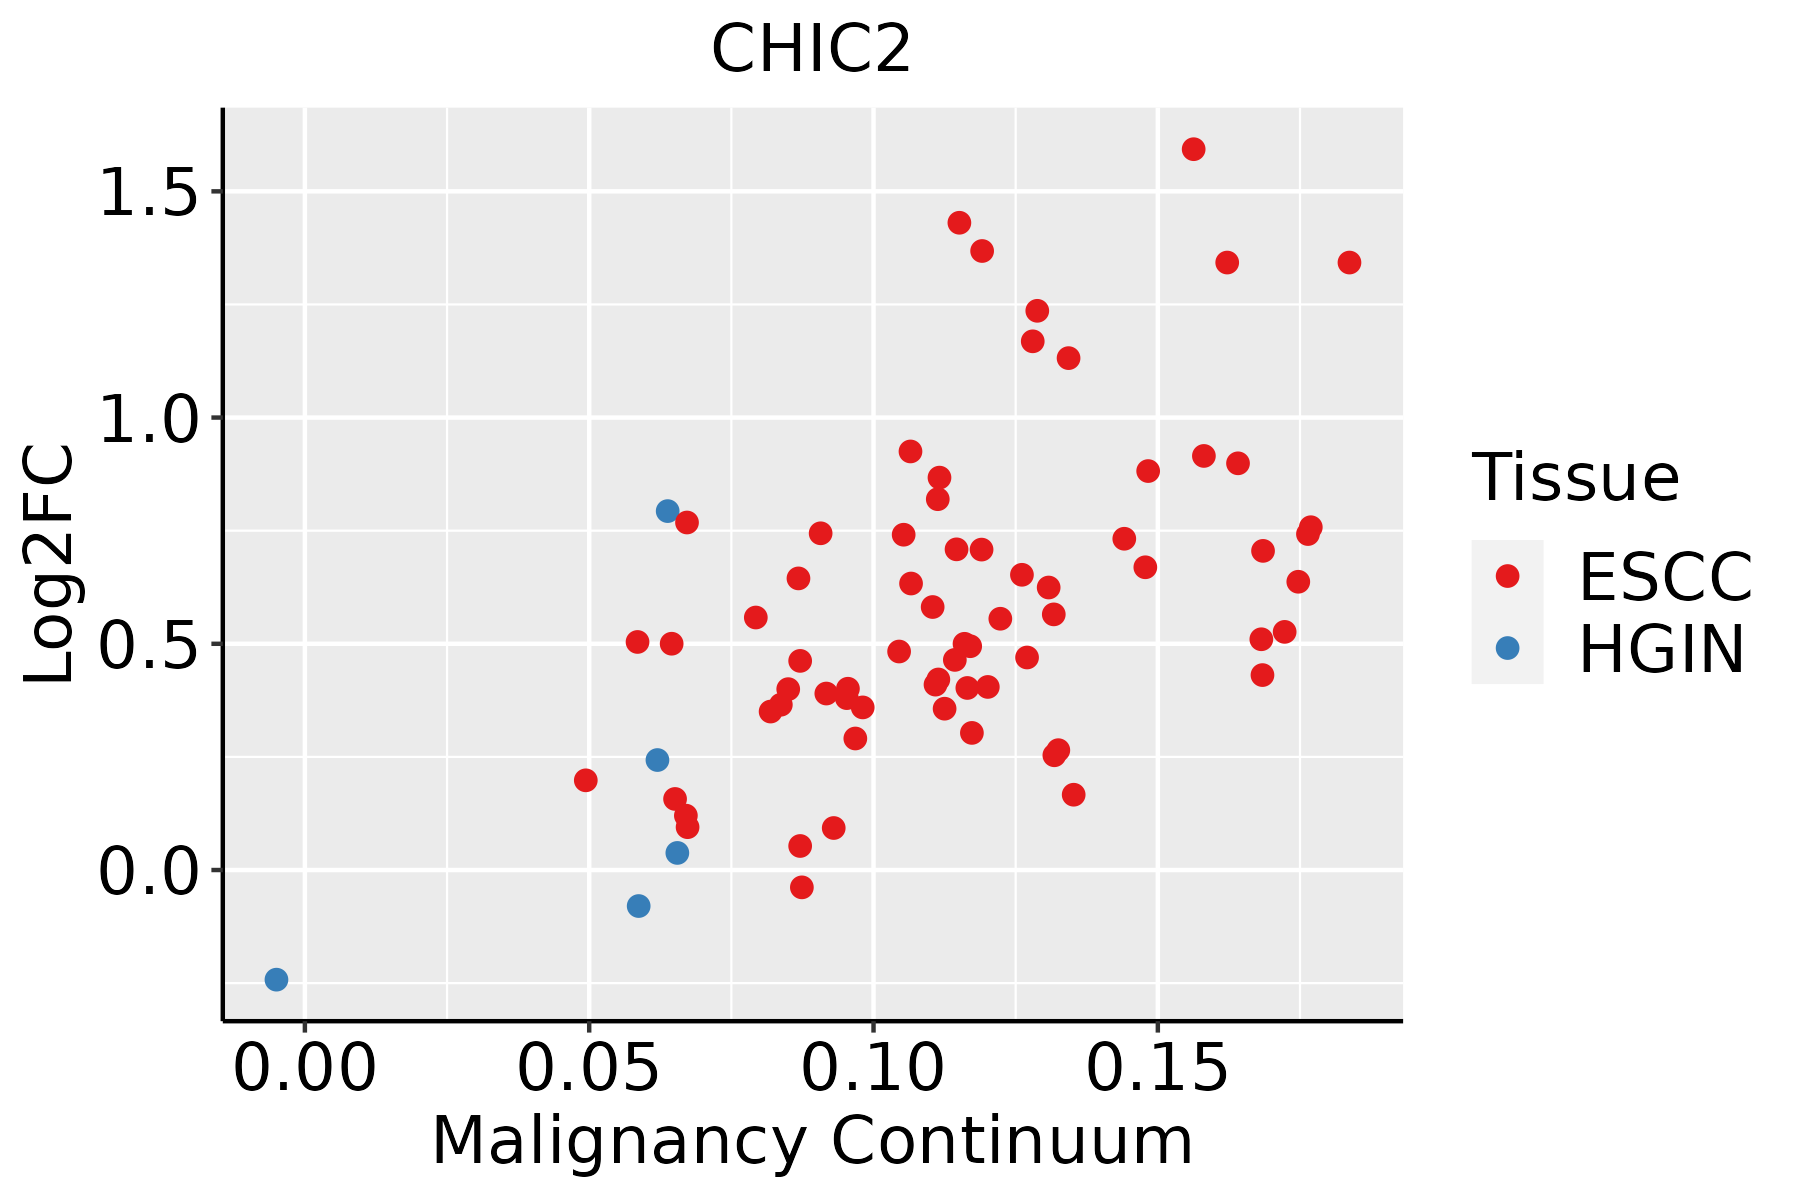 | ESCC: Esophageal squamous cell carcinoma |
| HGIN: High-grade intraepithelial neoplasias | ||
| LGIN: Low-grade intraepithelial neoplasias | ||
| Liver |  | HCC: Hepatocellular carcinoma |
| NAFLD: Non-alcoholic fatty liver disease | ||
| Oral Cavity | 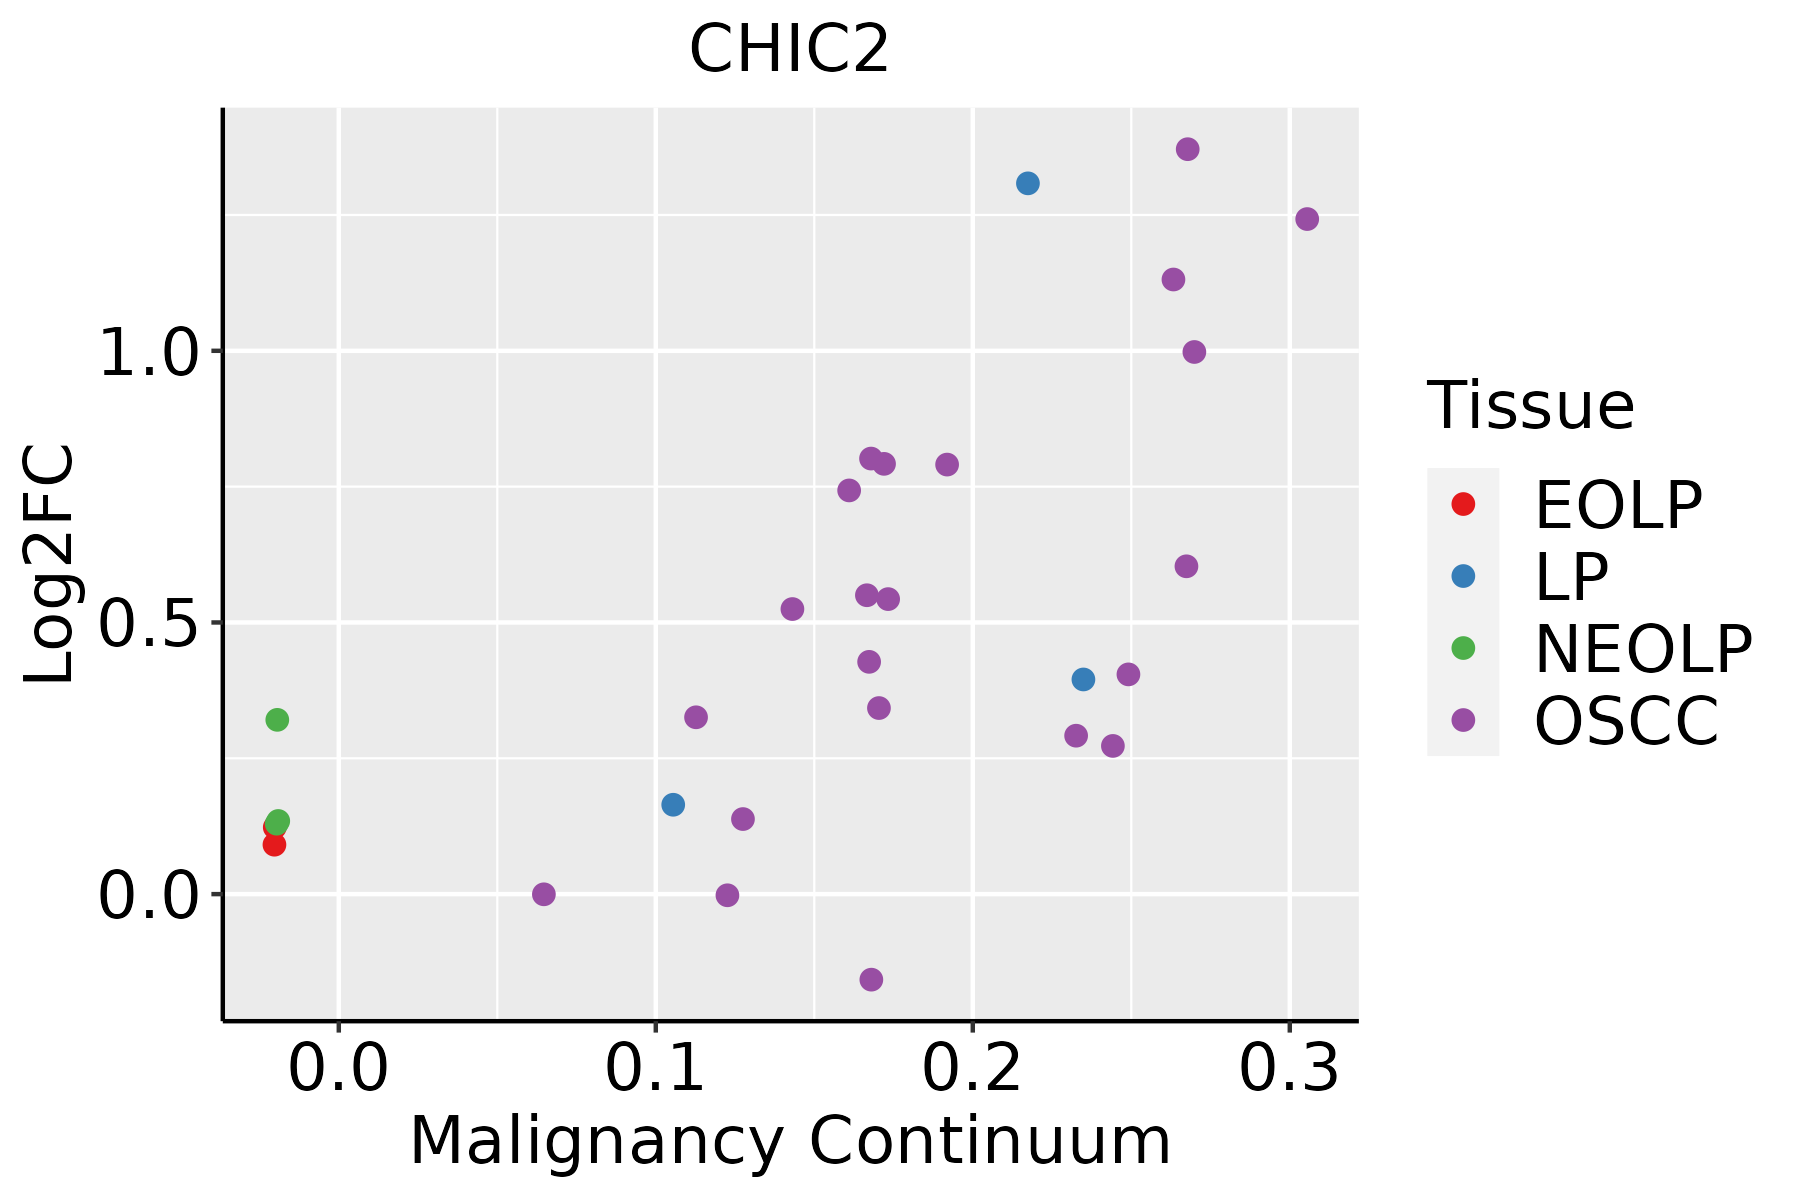 | EOLP: Erosive Oral lichen planus |
| LP: leukoplakia | ||
| NEOLP: Non-erosive oral lichen planus | ||
| OSCC: Oral squamous cell carcinoma | ||
| Prostate | 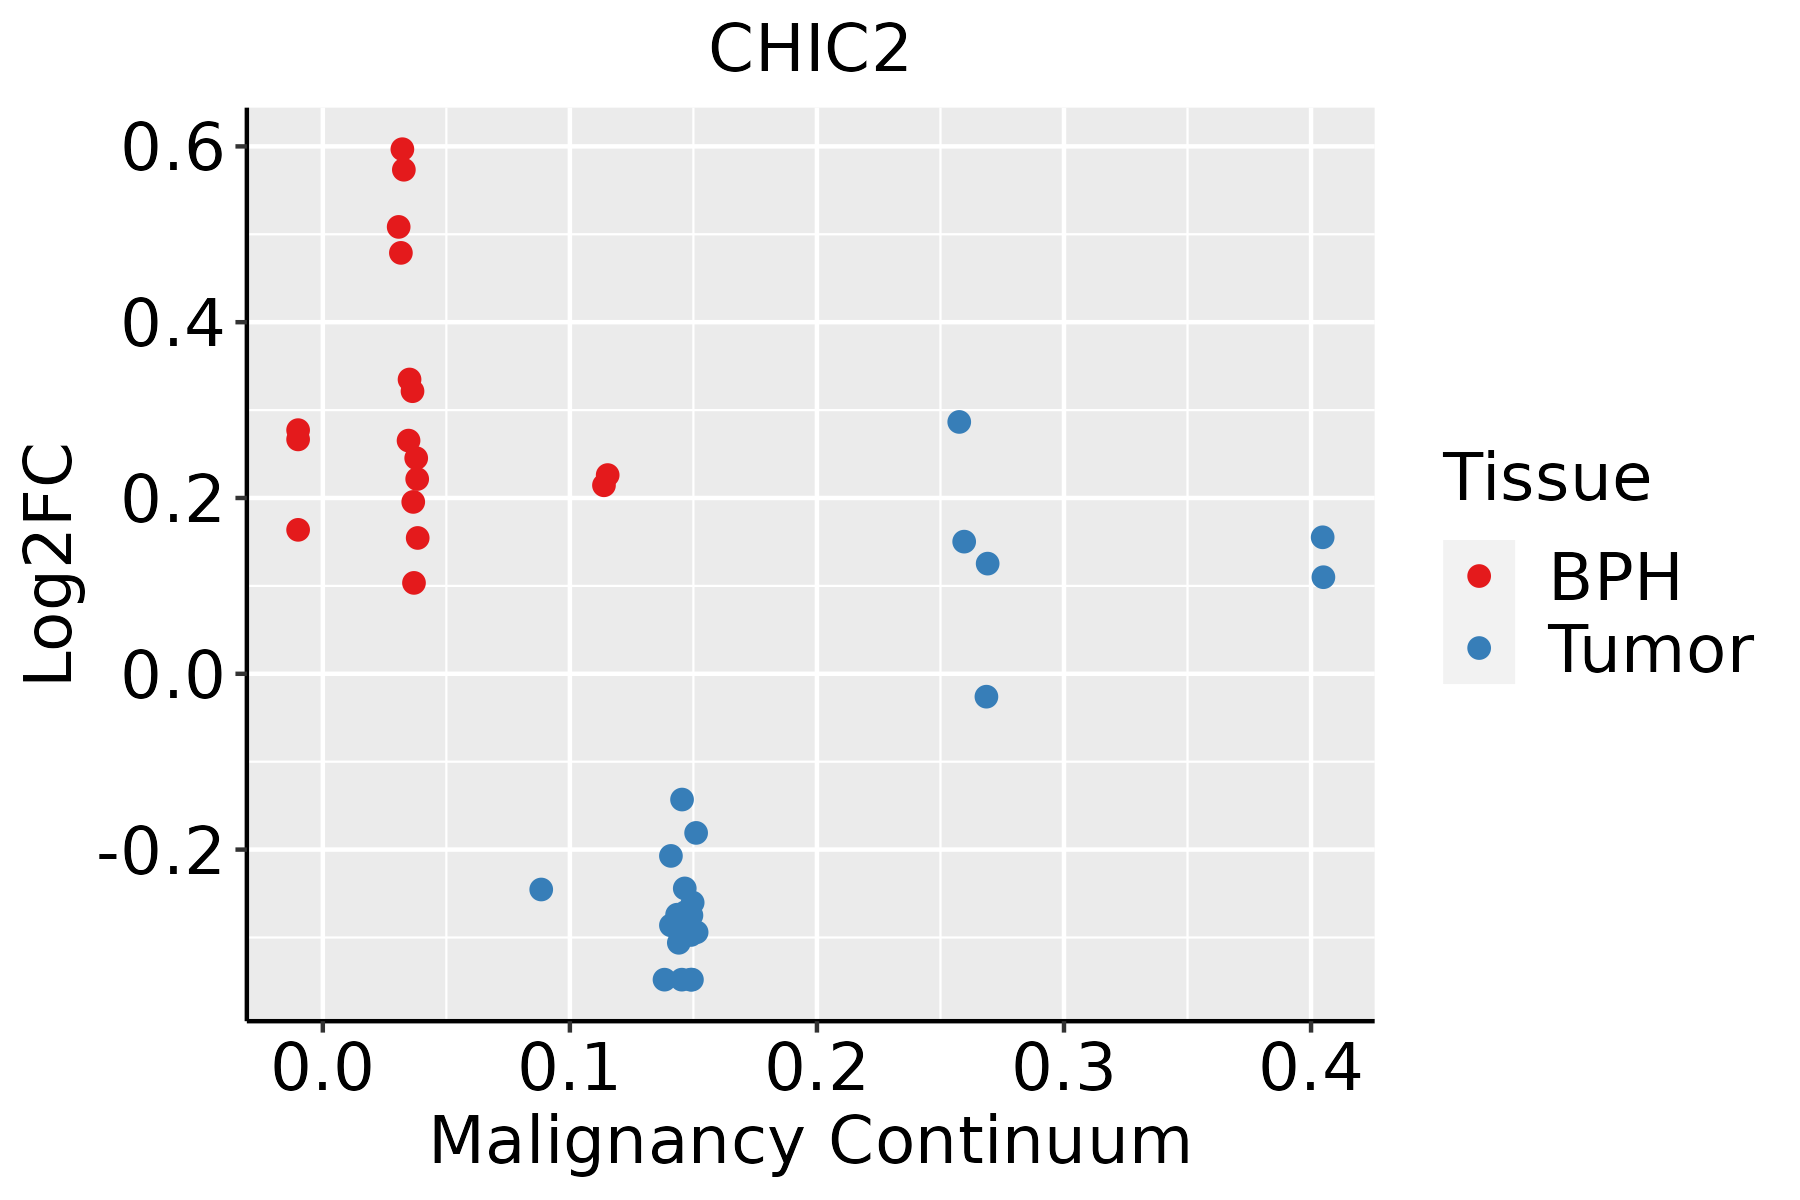 | BPH: Benign Prostatic Hyperplasia |
| Thyroid | 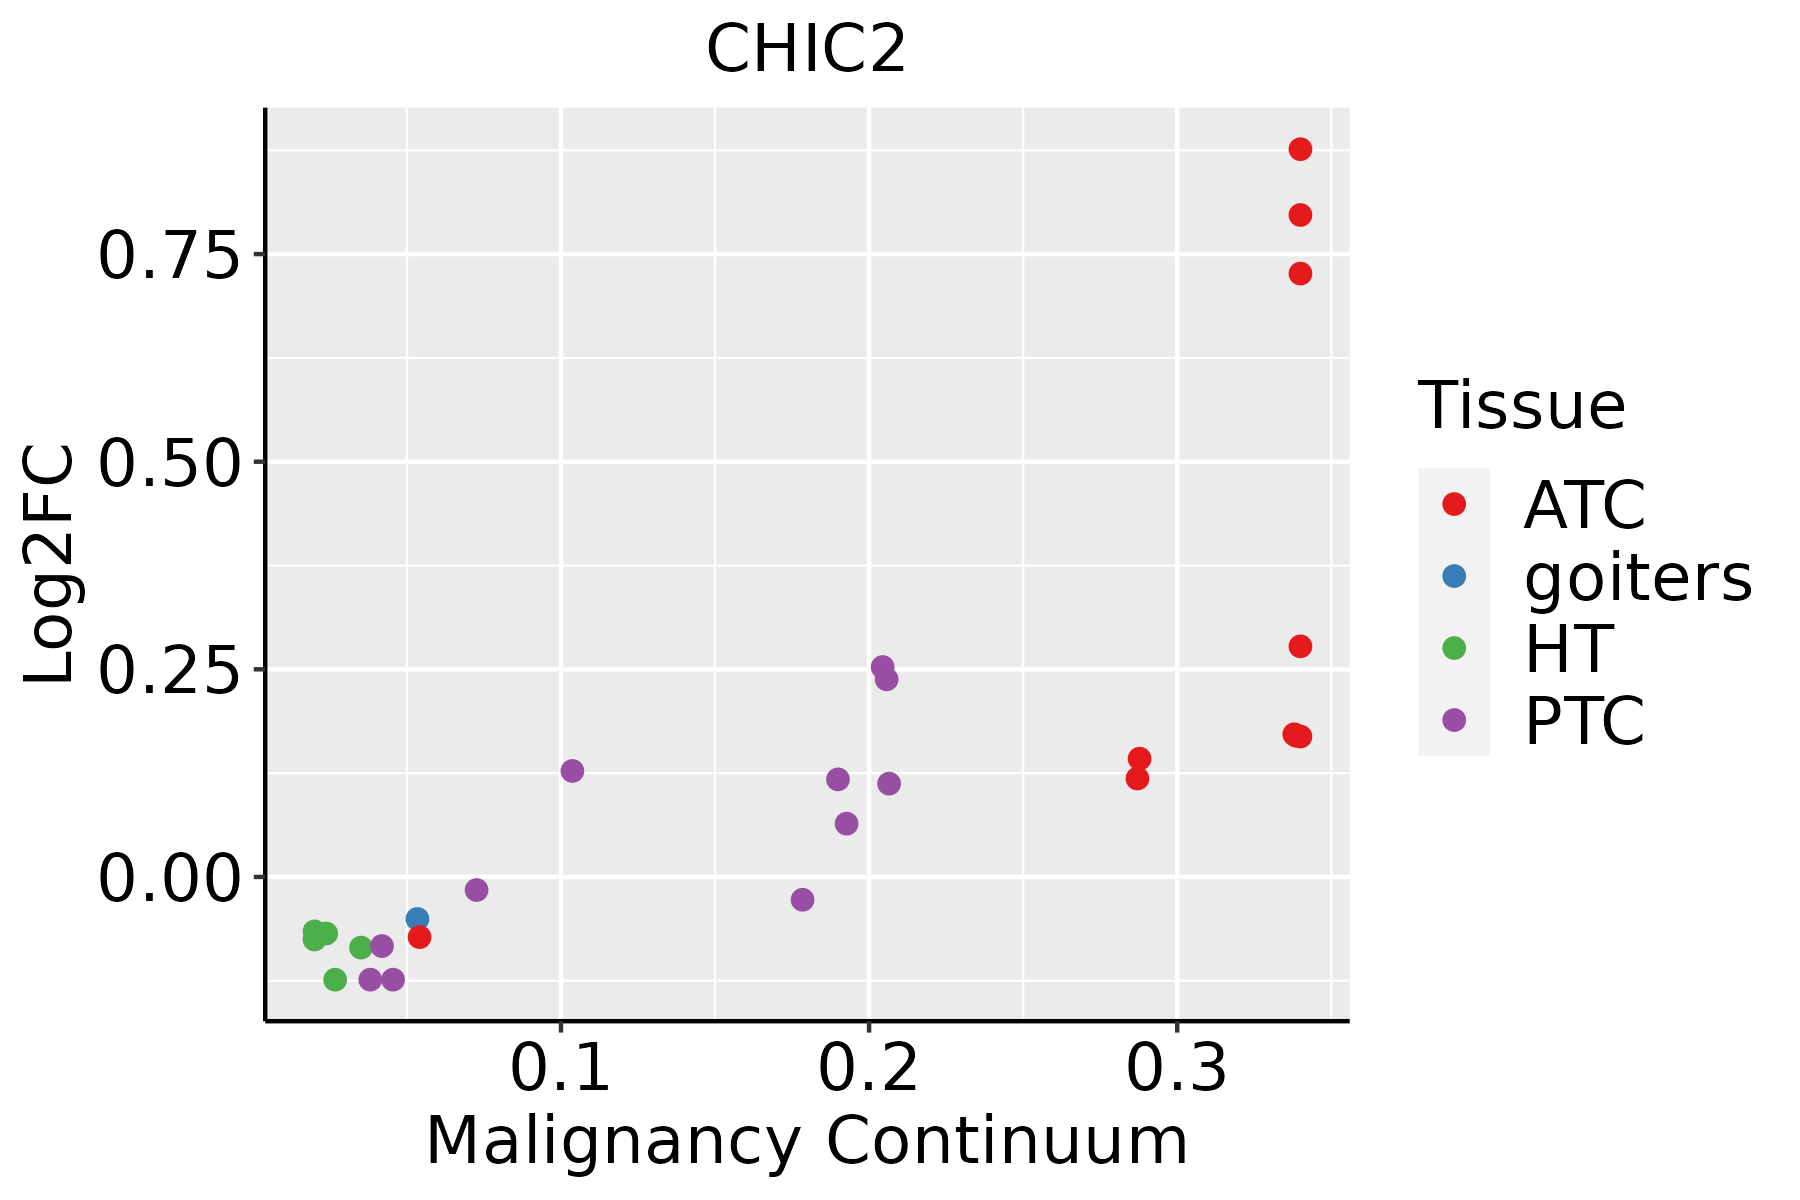 | ATC: Anaplastic thyroid cancer |
| HT: Hashimoto's thyroiditis | ||
| PTC: Papillary thyroid cancer |
| ∗log2FC in expression of this searched gene in stem-like cells from each diseased tissue sample relative to stem-like cells in normal samples in each tissue plotted against the malignancy continuum. Samples are colored based on if they are from different disease stage. |
Top |
Malignant transformation related pathway analysis |
| Find out the enriched GO biological processes and KEGG pathways involved in transition from healthy to precancer to cancer |
| Tissue | Disease Stage | Enriched GO biological Processes |
| Colorectum | AD |  |
| Colorectum | SER |  |
| Colorectum | MSS |  |
| Colorectum | MSI-H |  |
| Colorectum | FAP |  |
| ∗Top 15 enriched GO BP terms are showed in the bar plot of each disease state in each tissue. Each row represents a significant GO biological process which is colored according to the -log10(p.adjust). |
| Page: 1 2 3 4 5 6 7 8 9 |
| GO ID | Tissue | Disease Stage | Description | Gene Ratio | Bg Ratio | pvalue | p.adjust | Count |
| Page: 1 |
| Pathway ID | Tissue | Disease Stage | Description | Gene Ratio | Bg Ratio | pvalue | p.adjust | qvalue | Count |
| Page: 1 |
Top |
Cell-cell communication analysis |
| Identification of potential cell-cell interactions between two cell types and their ligand-receptor pairs for different disease states |
| Ligand | Receptor | LRpair | Pathway | Tissue | Disease Stage |
| Page: 1 |
Top |
Single-cell gene regulatory network inference analysis |
| Find out the significant the regulons (TFs) and the target genes of each regulon across cell types for different disease states |
| TF | Cell Type | Tissue | Disease Stage | Target Gene | RSS | Regulon Activity |
| ∗The dot plots of a searched regulon are shown for all cell subpopulations in each disease state of each tissue based on the regulon specific score inferred using pySCENIC and by calculating the average expression. |
| Page: 1 |
Top |
Somatic mutation of malignant transformation related genes |
| Annotation of somatic variants for genes involved in malignant transformation |
| Hugo Symbol | Variant Class | Variant Classification | dbSNP RS | HGVSc | HGVSp | HGVSp Short | SWISSPROT | BIOTYPE | SIFT | PolyPhen | Tumor Sample Barcode | Tissue | Histology | Sex | Age | Stage | Therapy Types | Drugs | Outcome |
| CHIC2 | SNV | Missense_Mutation | c.335N>A | p.Arg112Gln | p.R112Q | Q9UKJ5 | protein_coding | tolerated(0.3) | possibly_damaging(0.714) | TCGA-BH-A204-01 | Breast | breast invasive carcinoma | Female | >=65 | I/II | Unknown | Unknown | SD | |
| CHIC2 | SNV | Missense_Mutation | novel | c.38N>C | p.Asp13Ala | p.D13A | Q9UKJ5 | protein_coding | tolerated(0.23) | probably_damaging(0.968) | TCGA-D8-A1JK-01 | Breast | breast invasive carcinoma | Female | >=65 | I/II | Unknown | Unknown | SD |
| CHIC2 | SNV | Missense_Mutation | rs750921405 | c.488N>A | p.Arg163Gln | p.R163Q | Q9UKJ5 | protein_coding | tolerated(0.2) | benign(0.019) | TCGA-AA-A00N-01 | Colorectum | colon adenocarcinoma | Male | >=65 | I/II | Unknown | Unknown | PD |
| CHIC2 | SNV | Missense_Mutation | c.493N>T | p.Asp165Tyr | p.D165Y | Q9UKJ5 | protein_coding | deleterious(0) | probably_damaging(0.982) | TCGA-AA-A010-01 | Colorectum | colon adenocarcinoma | Female | <65 | I/II | Chemotherapy | folinic | CR | |
| CHIC2 | SNV | Missense_Mutation | c.464N>A | p.Phe155Tyr | p.F155Y | Q9UKJ5 | protein_coding | tolerated(0.11) | benign(0.015) | TCGA-CA-6717-01 | Colorectum | colon adenocarcinoma | Male | <65 | I/II | Chemotherapy | oxaliplatin | CR | |
| CHIC2 | SNV | Missense_Mutation | novel | c.338G>T | p.Arg113Ile | p.R113I | Q9UKJ5 | protein_coding | tolerated(0.11) | benign(0.029) | TCGA-A5-A0G2-01 | Endometrium | uterine corpus endometrioid carcinoma | Female | <65 | III/IV | Unknown | Unknown | SD |
| CHIC2 | SNV | Missense_Mutation | c.250C>T | p.Arg84Cys | p.R84C | Q9UKJ5 | protein_coding | deleterious(0) | possibly_damaging(0.873) | TCGA-AP-A051-01 | Endometrium | uterine corpus endometrioid carcinoma | Female | >=65 | I/II | Unknown | Unknown | SD | |
| CHIC2 | SNV | Missense_Mutation | rs772144534 | c.131N>A | p.Ser44Asn | p.S44N | Q9UKJ5 | protein_coding | tolerated(0.31) | benign(0.096) | TCGA-AP-A0LM-01 | Endometrium | uterine corpus endometrioid carcinoma | Female | <65 | III/IV | Chemotherapy | cisplatin | SD |
| CHIC2 | SNV | Missense_Mutation | c.146N>A | p.Ser49Tyr | p.S49Y | Q9UKJ5 | protein_coding | deleterious(0.01) | possibly_damaging(0.544) | TCGA-AX-A0J0-01 | Endometrium | uterine corpus endometrioid carcinoma | Female | <65 | I/II | Unknown | Unknown | SD | |
| CHIC2 | SNV | Missense_Mutation | novel | c.197C>T | p.Ala66Val | p.A66V | Q9UKJ5 | protein_coding | tolerated(0.14) | benign(0.238) | TCGA-B5-A3FC-01 | Endometrium | uterine corpus endometrioid carcinoma | Female | <65 | I/II | Unknown | Unknown | SD |
| Page: 1 2 |
Top |
Related drugs of malignant transformation related genes |
| Identification of chemicals and drugs interact with genes involved in malignant transfromation |
| (DGIdb 4.0) |
| Entrez ID | Symbol | Category | Interaction Types | Drug Claim Name | Drug Name | PMIDs |
| Page: 1 |

Copyright 2023-Present -The University of Texas Health Science Center at Houston |