
|
|||||
|
 | |
| |
| |
| |
| |
| |
|
Gene: CHI3L2 |
Gene summary for CHI3L2 |
| Gene information | Species | Human | Gene symbol | CHI3L2 | Gene ID | 1117 |
| Gene name | chitinase 3 like 2 | |
| Gene Alias | CHIL2 | |
| Cytomap | 1p13.2 | |
| Gene Type | protein-coding | GO ID | GO:0005975 | UniProtAcc | Q15782 |
Top |
Malignant transformation analysis |
| Identification of the aberrant gene expression in precancerous and cancerous lesions by comparing the gene expression of stem-like cells in diseased tissues with normal stem cells |
| Entrez ID | Symbol | Replicates | Species | Organ | Tissue | Adj P-value | Log2FC | Malignancy |
| 1117 | CHI3L2 | P2T-E | Human | Esophagus | ESCC | 1.61e-14 | 5.09e-01 | 0.1177 |
| 1117 | CHI3L2 | P16T-E | Human | Esophagus | ESCC | 2.74e-02 | 4.28e-01 | 0.1153 |
| 1117 | CHI3L2 | P76T-E | Human | Esophagus | ESCC | 2.02e-06 | 6.52e-01 | 0.1207 |
| 1117 | CHI3L2 | S027 | Human | Liver | HCC | 1.13e-07 | 6.32e-01 | 0.2446 |
| 1117 | CHI3L2 | S028 | Human | Liver | HCC | 2.09e-20 | 7.75e-01 | 0.2503 |
| 1117 | CHI3L2 | S029 | Human | Liver | HCC | 2.60e-35 | 1.27e+00 | 0.2581 |
| 1117 | CHI3L2 | C09 | Human | Oral cavity | OSCC | 6.86e-03 | 7.16e-01 | 0.1431 |
| 1117 | CHI3L2 | SYSMH6 | Human | Oral cavity | OSCC | 1.24e-03 | 6.34e-01 | 0.1275 |
| Page: 1 |
| Tissue | Expression Dynamics | Abbreviation |
| Esophagus | 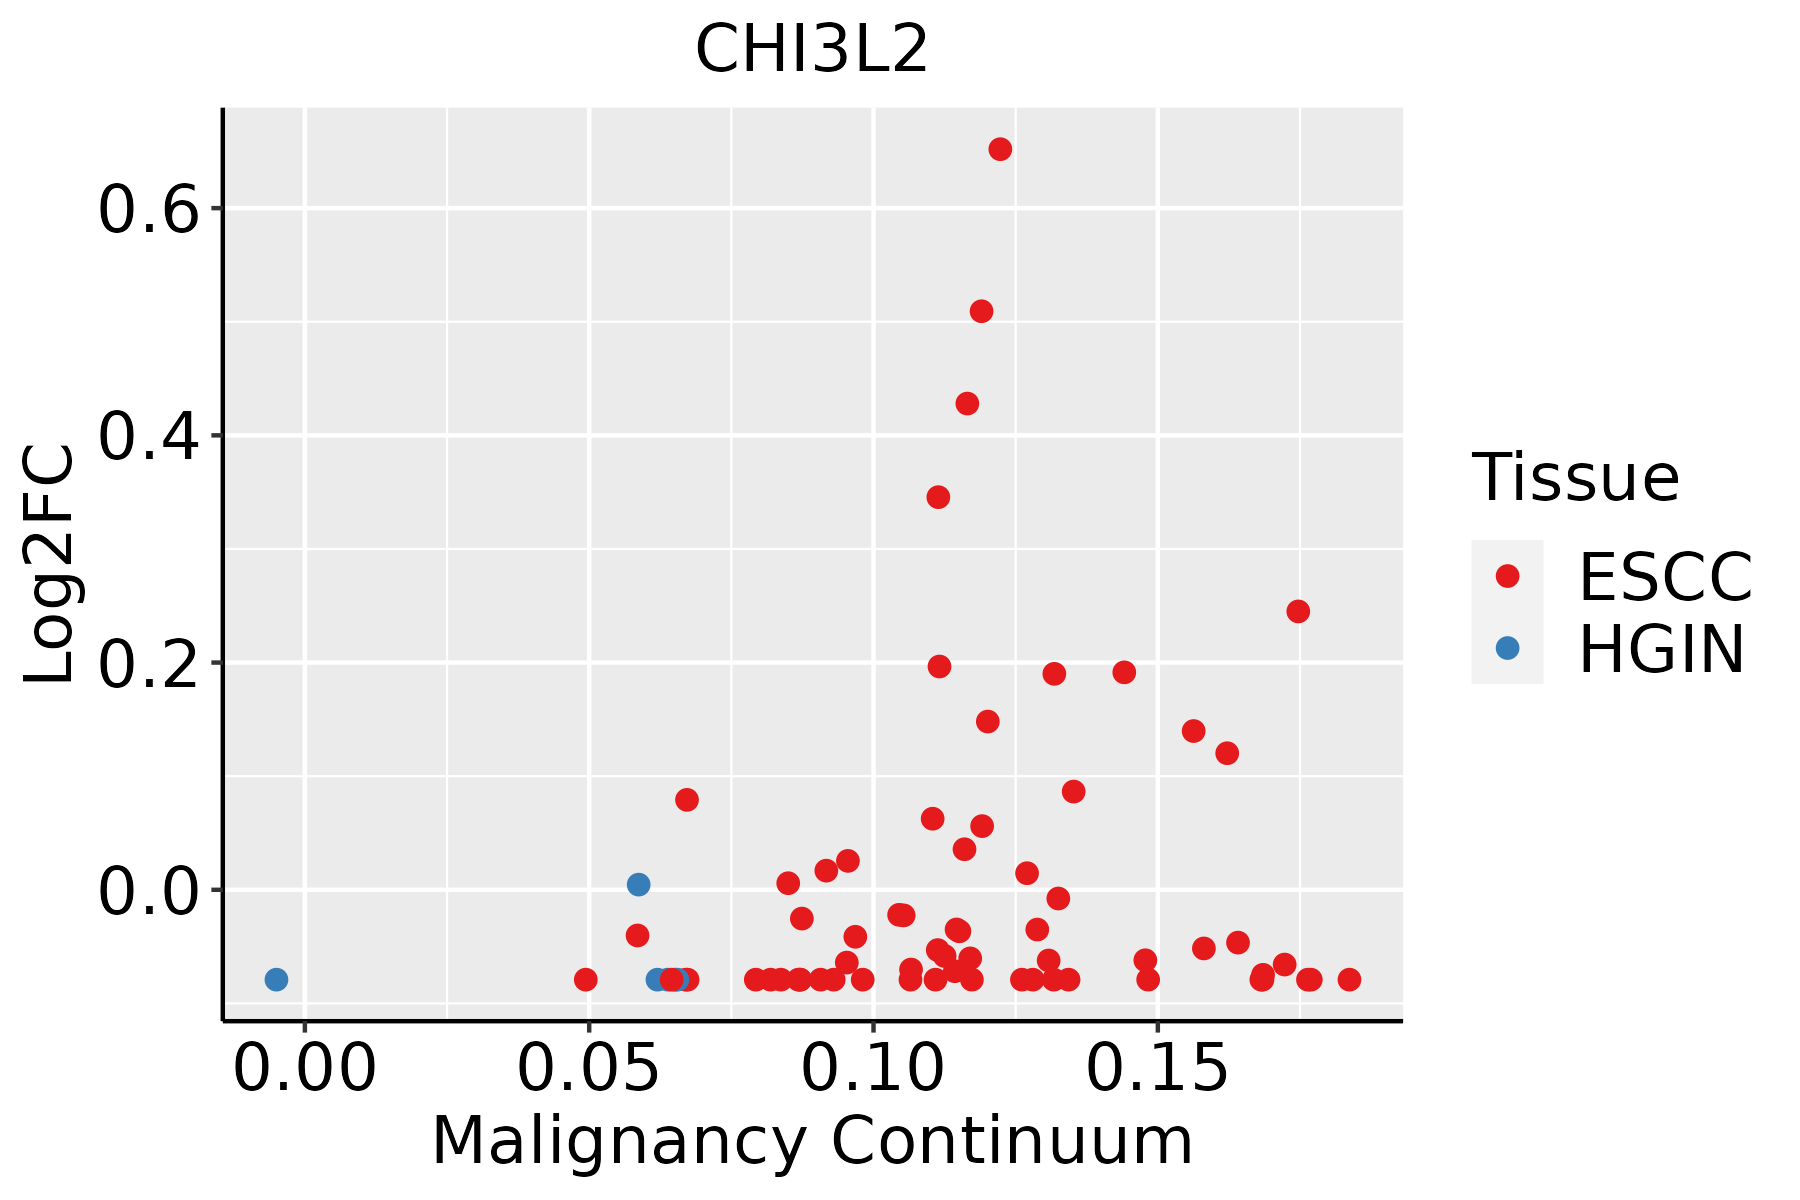 | ESCC: Esophageal squamous cell carcinoma |
| HGIN: High-grade intraepithelial neoplasias | ||
| LGIN: Low-grade intraepithelial neoplasias | ||
| Liver |  | HCC: Hepatocellular carcinoma |
| NAFLD: Non-alcoholic fatty liver disease | ||
| Oral Cavity |  | EOLP: Erosive Oral lichen planus |
| LP: leukoplakia | ||
| NEOLP: Non-erosive oral lichen planus | ||
| OSCC: Oral squamous cell carcinoma |
| ∗log2FC in expression of this searched gene in stem-like cells from each diseased tissue sample relative to stem-like cells in normal samples in each tissue plotted against the malignancy continuum. Samples are colored based on if they are from different disease stage. |
Top |
Malignant transformation related pathway analysis |
| Find out the enriched GO biological processes and KEGG pathways involved in transition from healthy to precancer to cancer |
| Tissue | Disease Stage | Enriched GO biological Processes |
| Colorectum | AD |  |
| Colorectum | SER |  |
| Colorectum | MSS |  |
| Colorectum | MSI-H |  |
| Colorectum | FAP |  |
| ∗Top 15 enriched GO BP terms are showed in the bar plot of each disease state in each tissue. Each row represents a significant GO biological process which is colored according to the -log10(p.adjust). |
| Page: 1 2 3 4 5 6 7 8 9 |
| GO ID | Tissue | Disease Stage | Description | Gene Ratio | Bg Ratio | pvalue | p.adjust | Count |
| GO:19011362 | Esophagus | ESCC | carbohydrate derivative catabolic process | 99/8552 | 172/18723 | 1.11e-03 | 5.54e-03 | 99 |
| GO:1901136 | Liver | HCC | carbohydrate derivative catabolic process | 98/7958 | 172/18723 | 8.71e-05 | 7.62e-04 | 98 |
| GO:19011361 | Oral cavity | OSCC | carbohydrate derivative catabolic process | 89/7305 | 172/18723 | 4.52e-04 | 2.73e-03 | 89 |
| GO:0006040 | Oral cavity | OSCC | amino sugar metabolic process | 24/7305 | 42/18723 | 1.30e-02 | 4.34e-02 | 24 |
| GO:0046348 | Oral cavity | OSCC | amino sugar catabolic process | 10/7305 | 14/18723 | 1.44e-02 | 4.69e-02 | 10 |
| Page: 1 |
| Pathway ID | Tissue | Disease Stage | Description | Gene Ratio | Bg Ratio | pvalue | p.adjust | qvalue | Count |
| Page: 1 |
Top |
Cell-cell communication analysis |
| Identification of potential cell-cell interactions between two cell types and their ligand-receptor pairs for different disease states |
| Ligand | Receptor | LRpair | Pathway | Tissue | Disease Stage |
| Page: 1 |
Top |
Single-cell gene regulatory network inference analysis |
| Find out the significant the regulons (TFs) and the target genes of each regulon across cell types for different disease states |
| TF | Cell Type | Tissue | Disease Stage | Target Gene | RSS | Regulon Activity |
| ∗The dot plots of a searched regulon are shown for all cell subpopulations in each disease state of each tissue based on the regulon specific score inferred using pySCENIC and by calculating the average expression. |
| Page: 1 |
Top |
Somatic mutation of malignant transformation related genes |
| Annotation of somatic variants for genes involved in malignant transformation |
| Hugo Symbol | Variant Class | Variant Classification | dbSNP RS | HGVSc | HGVSp | HGVSp Short | SWISSPROT | BIOTYPE | SIFT | PolyPhen | Tumor Sample Barcode | Tissue | Histology | Sex | Age | Stage | Therapy Types | Drugs | Outcome |
| CHI3L2 | SNV | Missense_Mutation | c.117C>A | p.Asp39Glu | p.D39E | Q15782 | protein_coding | deleterious(0.05) | possibly_damaging(0.613) | TCGA-A8-A082-01 | Breast | breast invasive carcinoma | Female | <65 | I/II | Chemotherapy | 5-fluorouracil | CR | |
| CHI3L2 | SNV | Missense_Mutation | c.117N>A | p.Asp39Glu | p.D39E | Q15782 | protein_coding | deleterious(0.05) | possibly_damaging(0.613) | TCGA-A8-A09C-01 | Breast | breast invasive carcinoma | Female | >=65 | I/II | Unknown | Unknown | SD | |
| CHI3L2 | SNV | Missense_Mutation | c.359N>T | p.Ser120Leu | p.S120L | Q15782 | protein_coding | deleterious(0.02) | probably_damaging(0.96) | TCGA-AO-A0J9-01 | Breast | breast invasive carcinoma | Female | <65 | III/IV | Chemotherapy | cyclophosphamide | PD | |
| CHI3L2 | SNV | Missense_Mutation | c.117N>A | p.Asp39Glu | p.D39E | Q15782 | protein_coding | deleterious(0.05) | possibly_damaging(0.613) | TCGA-BH-A0BW-01 | Breast | breast invasive carcinoma | Female | >=65 | I/II | Chemotherapy | adriamycin | CR | |
| CHI3L2 | SNV | Missense_Mutation | c.1106G>A | p.Gly369Asp | p.G369D | Q15782 | protein_coding | deleterious(0.01) | probably_damaging(0.999) | TCGA-D8-A1XQ-01 | Breast | breast invasive carcinoma | Female | >=65 | I/II | Unknown | Unknown | SD | |
| CHI3L2 | SNV | Missense_Mutation | novel | c.776N>T | p.Ser259Leu | p.S259L | Q15782 | protein_coding | deleterious(0.04) | benign(0.034) | TCGA-EW-A1J5-01 | Breast | breast invasive carcinoma | Female | <65 | I/II | Chemotherapy | adriamycin | SD |
| CHI3L2 | SNV | Missense_Mutation | novel | c.433N>G | p.Ile145Val | p.I145V | Q15782 | protein_coding | tolerated(0.09) | possibly_damaging(0.505) | TCGA-EA-A410-01 | Cervix | cervical & endocervical cancer | Female | <65 | I/II | Unknown | Unknown | SD |
| CHI3L2 | SNV | Missense_Mutation | c.369N>T | p.Glu123Asp | p.E123D | Q15782 | protein_coding | tolerated(0.07) | benign(0.109) | TCGA-EK-A2PM-01 | Cervix | cervical & endocervical cancer | Female | >=65 | I/II | Unknown | Unknown | SD | |
| CHI3L2 | SNV | Missense_Mutation | novel | c.637G>A | p.Asp213Asn | p.D213N | Q15782 | protein_coding | deleterious(0.04) | possibly_damaging(0.613) | TCGA-A6-3807-01 | Colorectum | colon adenocarcinoma | Female | <65 | III/IV | Ancillary | leucovorin | SD |
| CHI3L2 | SNV | Missense_Mutation | rs778552657 | c.979G>A | p.Ala327Thr | p.A327T | Q15782 | protein_coding | deleterious(0.03) | probably_damaging(0.983) | TCGA-A6-6781-01 | Colorectum | colon adenocarcinoma | Male | <65 | III/IV | Chemotherapy | oxaliplatin | SD |
| Page: 1 2 3 4 5 6 |
Top |
Related drugs of malignant transformation related genes |
| Identification of chemicals and drugs interact with genes involved in malignant transfromation |
| (DGIdb 4.0) |
| Entrez ID | Symbol | Category | Interaction Types | Drug Claim Name | Drug Name | PMIDs |
| Page: 1 |

Copyright 2023-Present -The University of Texas Health Science Center at Houston |