Schematic overview of the cellular and molecular mechanisms involved in the cancer progression, including the proposed cellular and molecular mechanisms in cancer cells trajectory. AT1: alveolar type 1 cells; AT2: alveolar type 2 cells; AAH: atypical adenomatous hyperplasia; AIS: adenocarcinoma in situ; MIA: minimally invasive adenocarcinoma; IA: invasive adenocarcinoma; EMT: epithelial-mesenchymal transition

Home

Download

Statistics

Help

Contact

Center for Computational Systems Medicine
leaf

Gene summary

leaf

Malignant transformation analysis

leaf

Malignant transformation related pathway analysis

leaf

Cell-cell communication analysis

leaf

Single-cell gene regulatory network inference analysis

leaf

Somatic mutation of malignant transformation related genes

leaf

Related drugs of malignant transformation related genes

Gene: CHI3L1

Gene summary for CHI3L1

check button Gene summary.

Gene informationSpeciesHuman
Gene symbol

CHI3L1

Gene ID

1116

Gene namechitinase 3 like 1
Gene AliasASRT7
Cytomap1q32.1
Gene Typeprotein-coding
GO ID

GO:0000165

UniProtAcc

A0A024R969


Top

Malignant transformation analysis

check button Identification of the aberrant gene expression in precancerous and cancerous lesions by comparing the gene expression of stem-like cells in diseased tissues with normal stem cells
check button Malignant transformation involving gene list.
Entrez IDSymbolReplicatesSpeciesOrganTissueAdj P-valueLog2FCMalignancy
1116CHI3L1GSM4909282HumanBreastIDC3.58e-123.25e-01-0.0288
1116CHI3L1GSM4909285HumanBreastIDC4.46e-04-2.30e-010.21
1116CHI3L1GSM4909286HumanBreastIDC1.76e-12-4.27e-010.1081
1116CHI3L1GSM4909290HumanBreastIDC3.77e-08-4.27e-010.2096
1116CHI3L1GSM4909291HumanBreastIDC2.68e-08-4.33e-010.1753
1116CHI3L1GSM4909293HumanBreastIDC6.19e-04-3.36e-010.1581
1116CHI3L1GSM4909294HumanBreastIDC5.36e-13-4.02e-010.2022
1116CHI3L1GSM4909296HumanBreastIDC5.75e-12-4.29e-010.1524
1116CHI3L1GSM4909297HumanBreastIDC9.60e-13-4.12e-010.1517
1116CHI3L1GSM4909298HumanBreastIDC1.81e-04-3.44e-010.1551
1116CHI3L1GSM4909299HumanBreastIDC8.97e-065.51e-010.035
1116CHI3L1GSM4909301HumanBreastIDC2.12e-16-4.33e-010.1577
1116CHI3L1GSM4909302HumanBreastIDC1.05e-08-3.98e-010.1545
1116CHI3L1GSM4909304HumanBreastIDC1.17e-02-3.11e-010.1636
1116CHI3L1GSM4909308HumanBreastIDC2.56e-06-3.95e-010.158
1116CHI3L1GSM4909311HumanBreastIDC3.34e-08-3.63e-010.1534
1116CHI3L1GSM4909312HumanBreastIDC1.44e-09-4.16e-010.1552
1116CHI3L1GSM4909313HumanBreastIDC2.89e-024.26e-010.0391
1116CHI3L1GSM4909315HumanBreastIDC4.80e-16-4.31e-010.21
1116CHI3L1GSM4909316HumanBreastIDC2.04e-03-4.33e-010.21
Page: 1 2 3 4 

check button Transcriptomic changes along malignancy continuum.
TissueExpression DynamicsAbbreviation
BreastThe image shows the transcriptomic changes along malignancy continuum.log2FC in expression of this searched gene in stem-like cells from each diseased tissue sample relative to stem-like cells in normal samples in each tissue plotted against the malignancy continuum. Samples are colored based on if they are from different disease stage.IDC: Invasive ductal carcinoma
DCIS: Ductal carcinoma in situ
Precancer(BRCA1-mut): Precancerous lesion from BRCA1 mutation carriers
EsophagusThe image shows the transcriptomic changes along malignancy continuum.log2FC in expression of this searched gene in stem-like cells from each diseased tissue sample relative to stem-like cells in normal samples in each tissue plotted against the malignancy continuum. Samples are colored based on if they are from different disease stage.
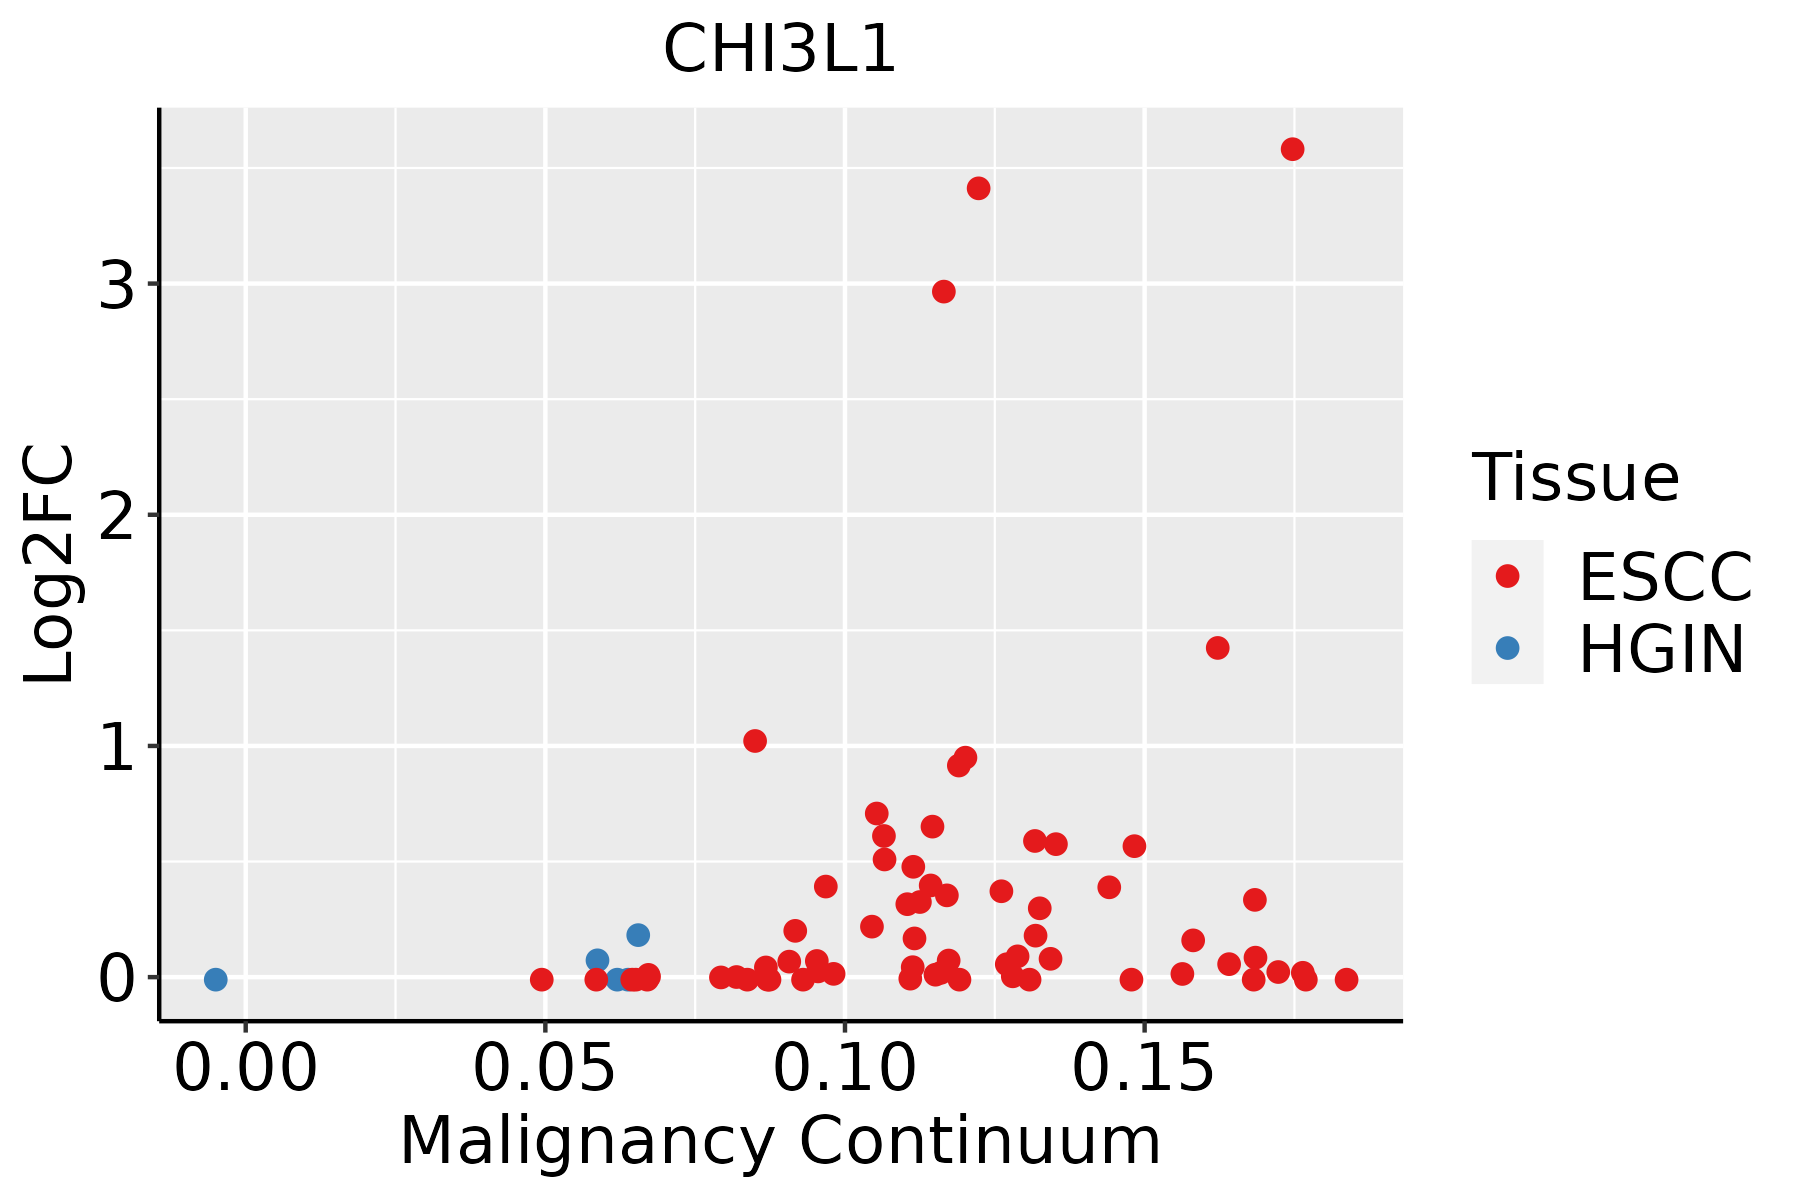
ESCC: Esophageal squamous cell carcinoma
HGIN: High-grade intraepithelial neoplasias
LGIN: Low-grade intraepithelial neoplasias
LiverThe image shows the transcriptomic changes along malignancy continuum.log2FC in expression of this searched gene in stem-like cells from each diseased tissue sample relative to stem-like cells in normal samples in each tissue plotted against the malignancy continuum. Samples are colored based on if they are from different disease stage.
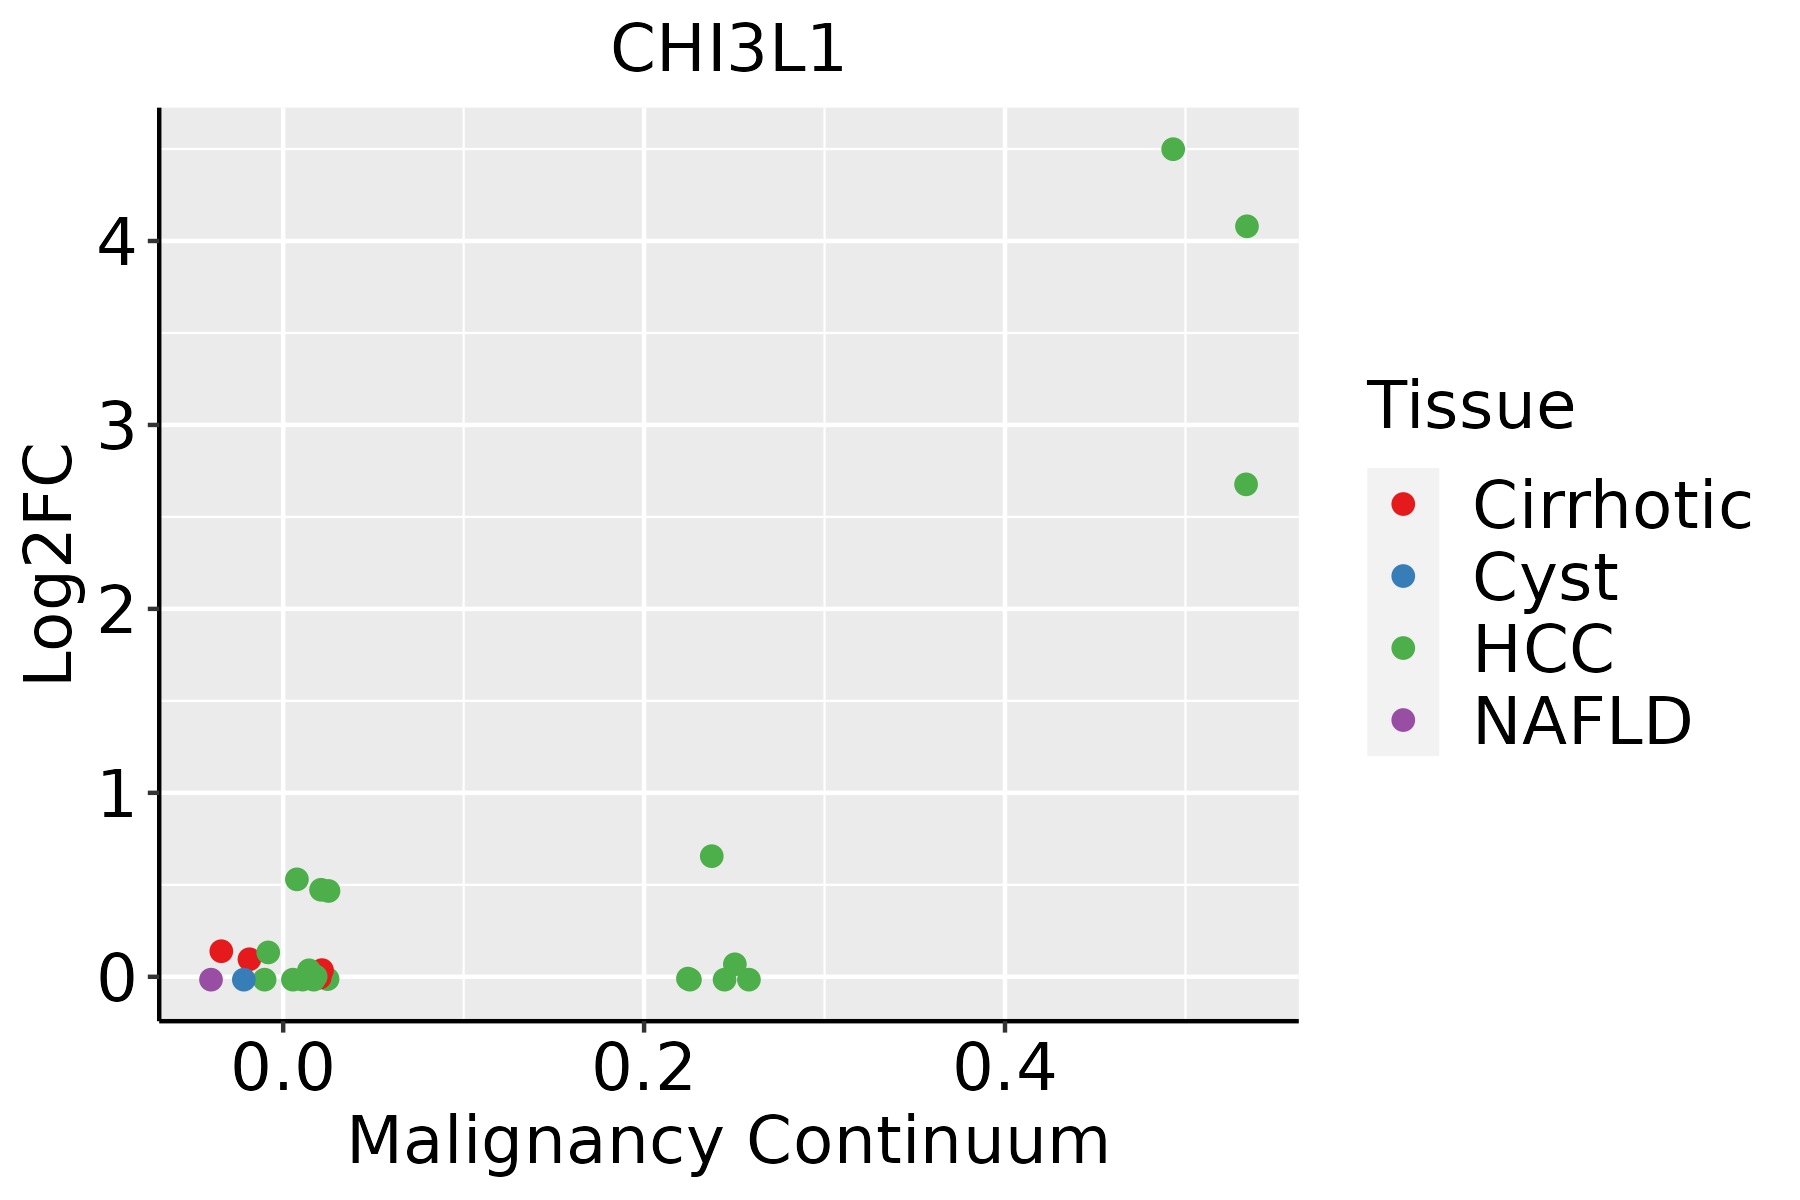
HCC: Hepatocellular carcinoma
NAFLD: Non-alcoholic fatty liver disease
LungThe image shows the transcriptomic changes along malignancy continuum.log2FC in expression of this searched gene in stem-like cells from each diseased tissue sample relative to stem-like cells in normal samples in each tissue plotted against the malignancy continuum. Samples are colored based on if they are from different disease stage.AAH: Atypical adenomatous hyperplasia
AIS: Adenocarcinoma in situ
IAC: Invasive lung adenocarcinoma
MIA: Minimally invasive adenocarcinoma
Oral CavityThe image shows the transcriptomic changes along malignancy continuum.log2FC in expression of this searched gene in stem-like cells from each diseased tissue sample relative to stem-like cells in normal samples in each tissue plotted against the malignancy continuum. Samples are colored based on if they are from different disease stage.
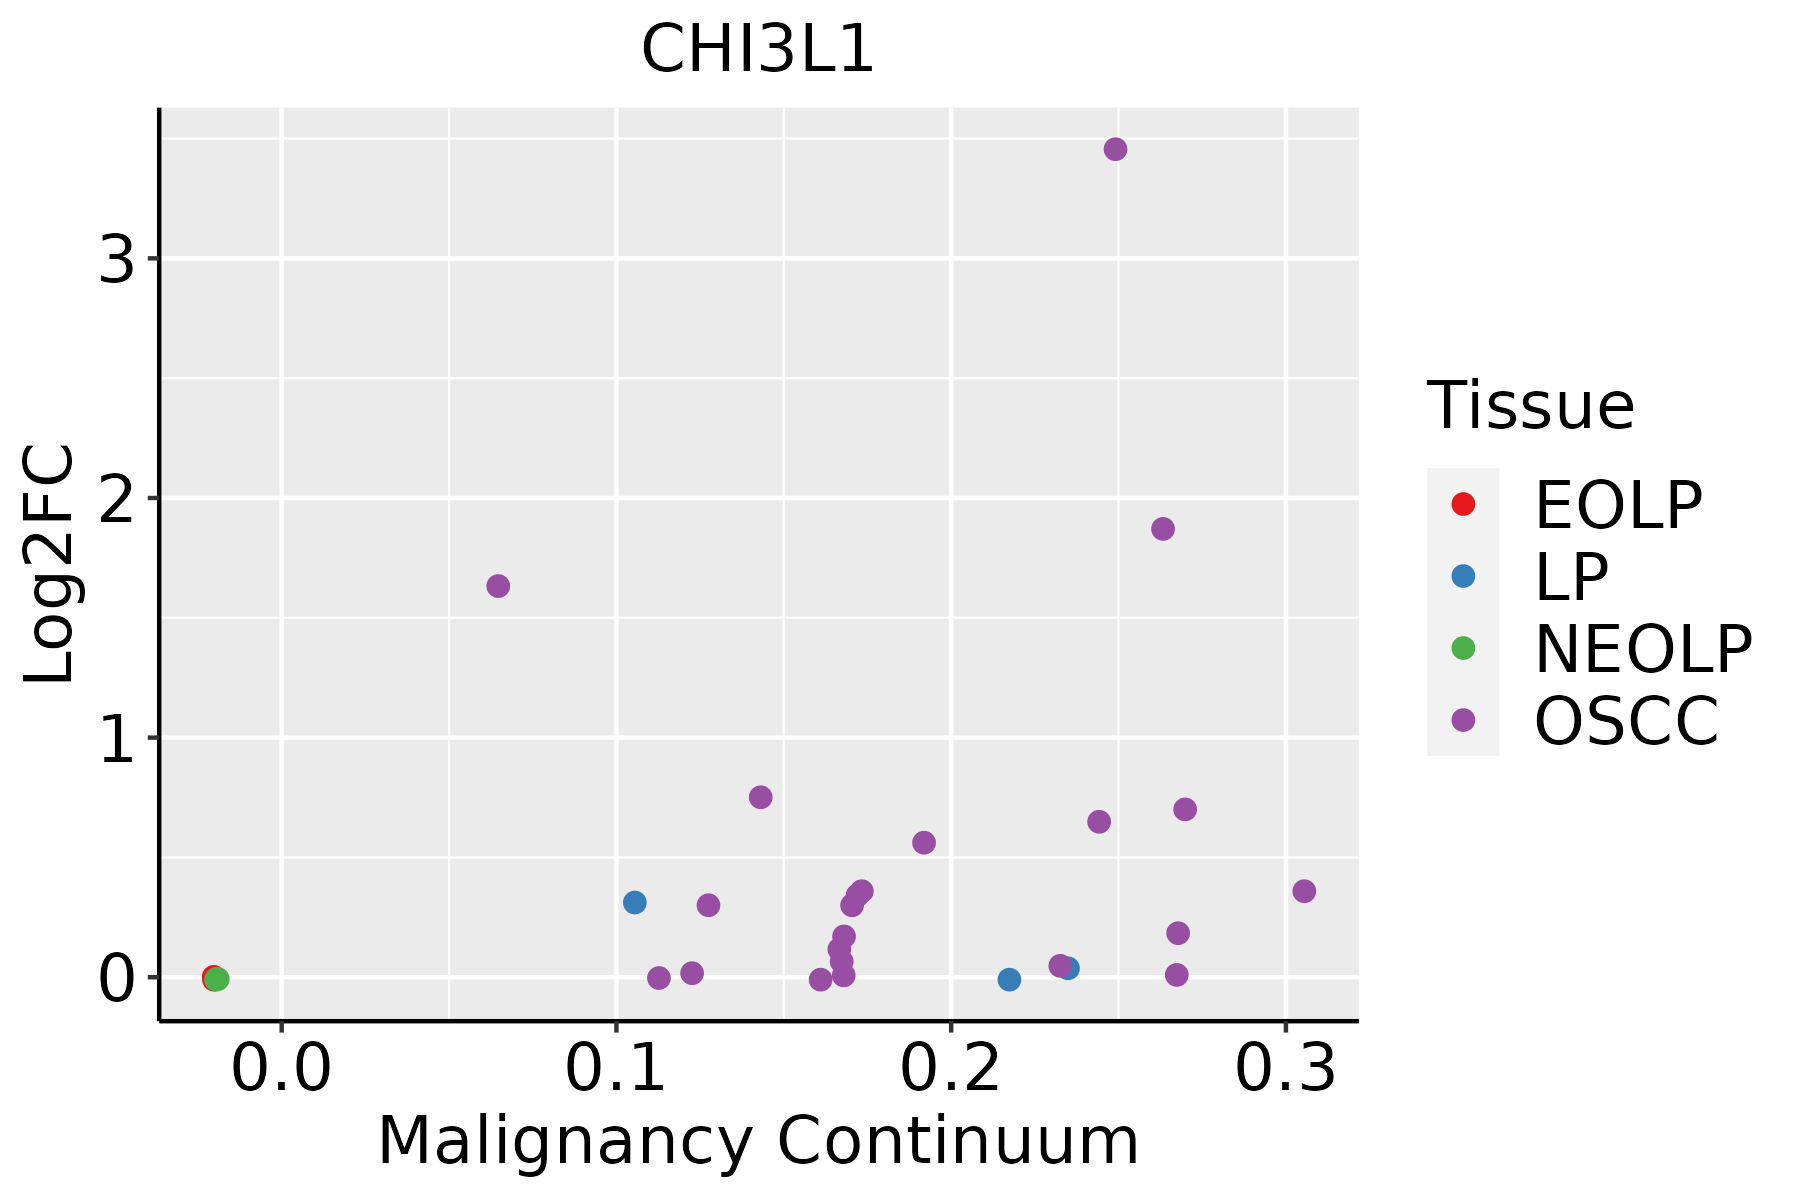
EOLP: Erosive Oral lichen planus
LP: leukoplakia
NEOLP: Non-erosive oral lichen planus
OSCC: Oral squamous cell carcinoma
SkinThe image shows the transcriptomic changes along malignancy continuum.log2FC in expression of this searched gene in stem-like cells from each diseased tissue sample relative to stem-like cells in normal samples in each tissue plotted against the malignancy continuum. Samples are colored based on if they are from different disease stage.
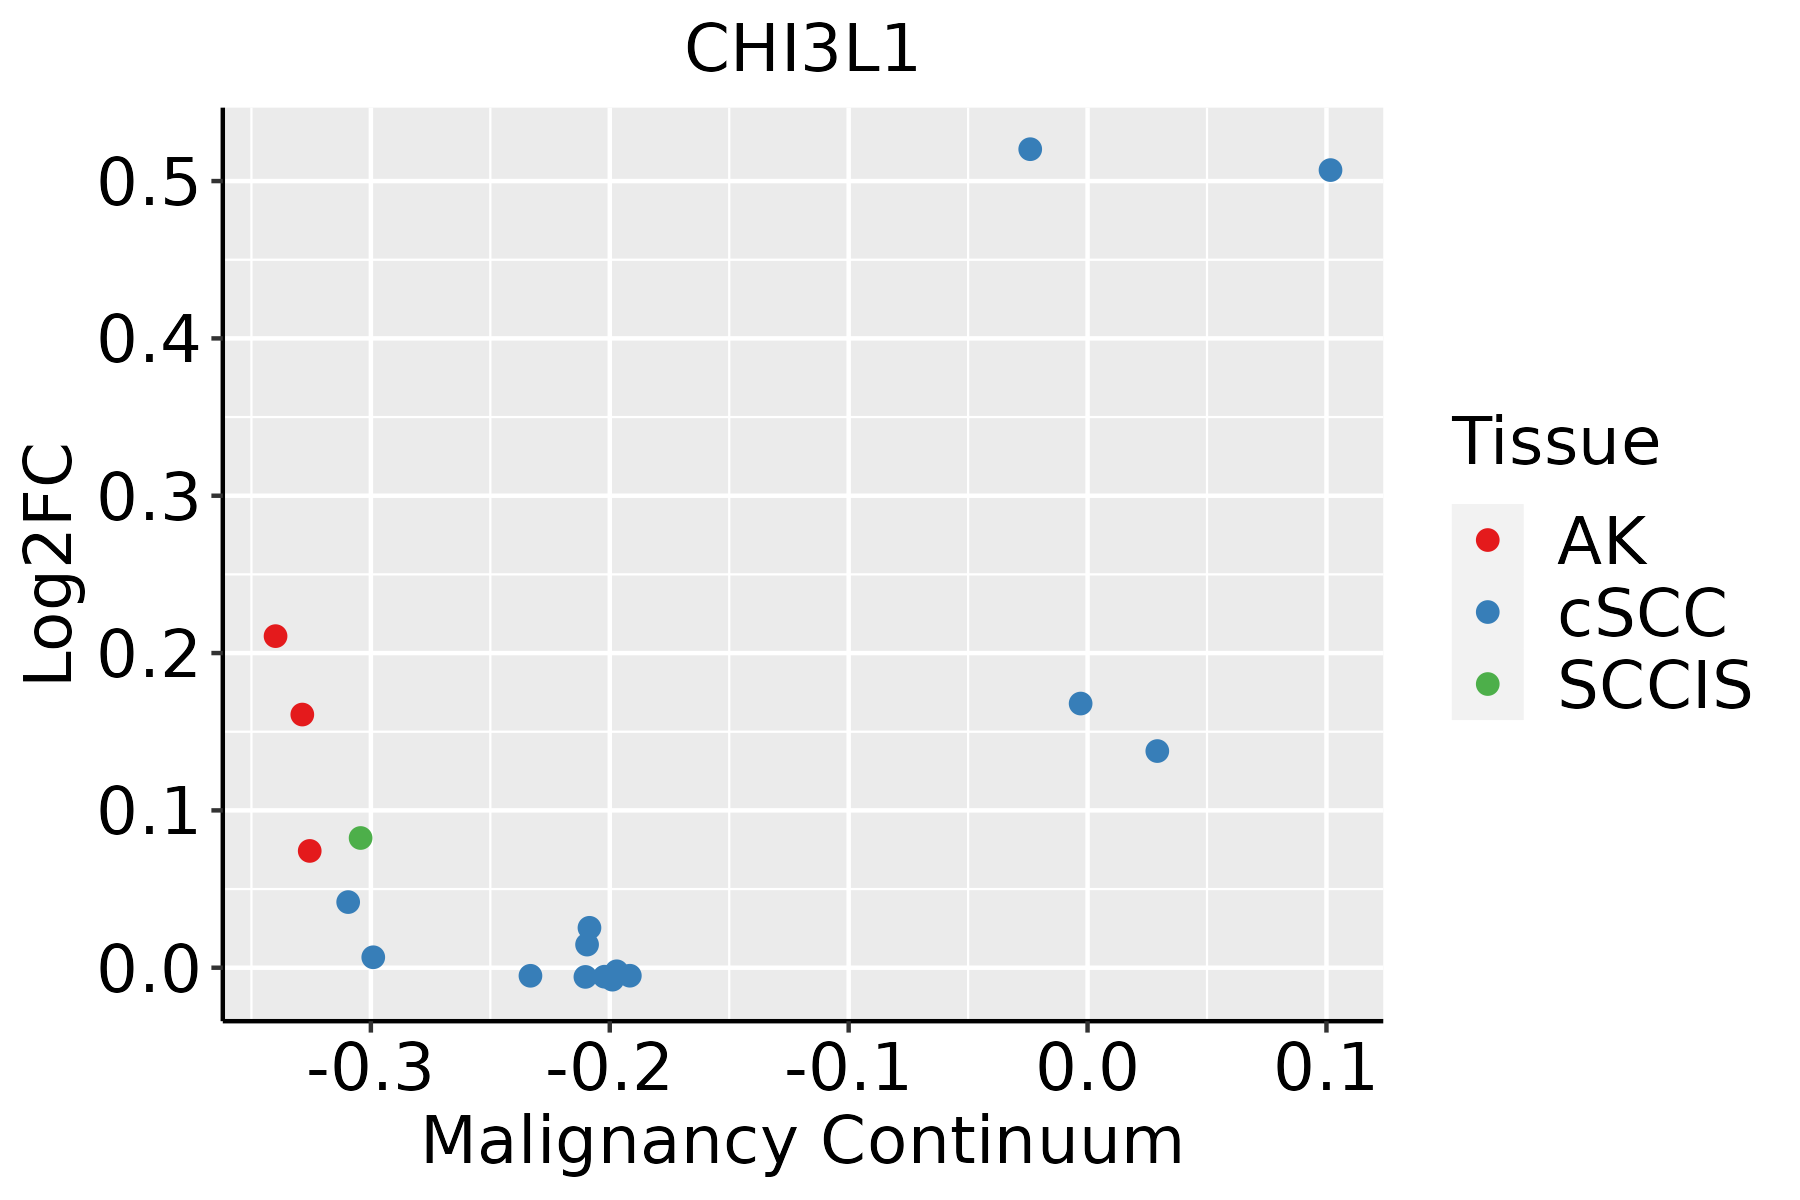
AK: Actinic keratosis
cSCC: Cutaneous squamous cell carcinoma
SCCIS:squamous cell carcinoma in situ
ThyroidThe image shows the transcriptomic changes along malignancy continuum.log2FC in expression of this searched gene in stem-like cells from each diseased tissue sample relative to stem-like cells in normal samples in each tissue plotted against the malignancy continuum. Samples are colored based on if they are from different disease stage.ATC: Anaplastic thyroid cancer
HT: Hashimoto's thyroiditis
PTC: Papillary thyroid cancer
∗log2FC in expression of this searched gene in stem-like cells from each diseased tissue sample relative to stem-like cells in normal samples in each tissue plotted against the malignancy continuum. Samples are colored based on if they are from different disease stage.

Top

Malignant transformation related pathway analysis

check buttonFind out the enriched GO biological processes and KEGG pathways involved in transition from healthy to precancer to cancer
check button Figure of enriched GO biological processes.
TissueDisease StageEnriched GO biological Processes
ColorectumADGO analysis - Figure of enriched GO biological processes: Top 15 enriched GO BP terms are showed in the bar plot of each disease state in each tissue. Each row represents a significant GO biological process which is colored according to the -log10(p.adjust).
ColorectumSERGO analysis - Figure of enriched GO biological processes: Top 15 enriched GO BP terms are showed in the bar plot of each disease state in each tissue. Each row represents a significant GO biological process which is colored according to the -log10(p.adjust).
ColorectumMSSGO analysis - Figure of enriched GO biological processes: Top 15 enriched GO BP terms are showed in the bar plot of each disease state in each tissue. Each row represents a significant GO biological process which is colored according to the -log10(p.adjust).
ColorectumMSI-HGO analysis - Figure of enriched GO biological processes: Top 15 enriched GO BP terms are showed in the bar plot of each disease state in each tissue. Each row represents a significant GO biological process which is colored according to the -log10(p.adjust).
ColorectumFAPGO analysis - Figure of enriched GO biological processes: Top 15 enriched GO BP terms are showed in the bar plot of each disease state in each tissue. Each row represents a significant GO biological process which is colored according to the -log10(p.adjust).
∗Top 15 enriched GO BP terms are showed in the bar plot of each disease state in each tissue. Each row represents a significant GO biological process which is colored according to the -log10(p.adjust).
Page: 1 2 3 4 5 6 7 8 9 

check button Enriched GO biological processes.
GO IDTissueDisease StageDescriptionGene RatioBg Ratiopvaluep.adjustCount
GO:00018196BreastPrecancerpositive regulation of cytokine production52/1080467/187234.18e-061.29e-0452
GO:00713568BreastPrecancercellular response to tumor necrosis factor28/1080229/187231.42e-042.45e-0328
GO:0045766BreastPrecancerpositive regulation of angiogenesis23/1080181/187233.09e-044.43e-0323
GO:1904018BreastPrecancerpositive regulation of vasculature development23/1080181/187233.09e-044.43e-0323
GO:00346128BreastPrecancerresponse to tumor necrosis factor29/1080253/187233.32e-044.70e-0329
GO:0045765BreastPrecancerregulation of angiogenesis35/1080342/187237.35e-048.80e-0335
GO:1901342BreastPrecancerregulation of vasculature development35/1080348/187231.00e-031.12e-0235
GO:00434912BreastPrecancerprotein kinase B signaling23/1080211/187232.53e-032.30e-0223
GO:00336749BreastPrecancerpositive regulation of kinase activity42/1080467/187232.94e-032.54e-0242
GO:00096126BreastPrecancerresponse to mechanical stimulus23/1080216/187233.41e-032.85e-0223
GO:000181911BreastIDCpositive regulation of cytokine production61/1434467/187232.81e-056.58e-0461
GO:000961211BreastIDCresponse to mechanical stimulus34/1434216/187234.59e-051.03e-0334
GO:007135613BreastIDCcellular response to tumor necrosis factor35/1434229/187236.64e-051.35e-0335
GO:00303244BreastIDClung development28/1434177/187231.90e-043.15e-0328
GO:003461213BreastIDCresponse to tumor necrosis factor36/1434253/187232.29e-043.64e-0336
GO:00457651BreastIDCregulation of angiogenesis45/1434342/187232.57e-043.98e-0345
GO:00303234BreastIDCrespiratory tube development28/1434181/187232.78e-044.26e-0328
GO:19013421BreastIDCregulation of vasculature development45/1434348/187233.78e-045.38e-0345
GO:00605412BreastIDCrespiratory system development30/1434203/187233.85e-045.40e-0330
GO:00703713BreastIDCERK1 and ERK2 cascade43/1434330/187234.28e-045.84e-0343
Page: 1 2 3 4 5 6 7 8 9 

check button Enriched KEGG pathways.
Pathway IDTissueDisease StageDescriptionGene RatioBg Ratiopvaluep.adjustqvalueCount
Page: 1 

Top

Cell-cell communication analysis

check buttonIdentification of potential cell-cell interactions between two cell types and their ligand-receptor pairs for different disease states
LigandReceptorLRpairPathwayTissueDisease Stage
Page: 1 

Top

Single-cell gene regulatory network inference analysis

check buttonFind out the significant the regulons (TFs) and the target genes of each regulon across cell types for different disease states
TFCell TypeTissueDisease StageTarget GeneRSSRegulon Activity
∗The dot plots of a searched regulon are shown for all cell subpopulations in each disease state of each tissue based on the regulon specific score inferred using pySCENIC and by calculating the average expression.
Page: 1 

Top

Somatic mutation of malignant transformation related genes

check buttonAnnotation of somatic variants for genes involved in malignant transformation
Hugo SymbolVariant ClassVariant ClassificationdbSNP RSHGVScHGVSpHGVSp ShortSWISSPROTBIOTYPESIFTPolyPhenTumor Sample BarcodeTissueHistologySexAgeStageTherapy TypesDrugsOutcome
CHI3L1SNVMissense_Mutationc.113N>Tp.Asp38Valp.D38VP36222protein_codingtolerated(0.4)benign(0.007)TCGA-AN-A0XN-01Breastbreast invasive carcinomaFemale>=65III/IVUnknownUnknownSD
CHI3L1SNVMissense_Mutationc.139G>Ap.Asp47Asnp.D47NP36222protein_codingdeleterious(0.03)possibly_damaging(0.811)TCGA-AR-A24H-01Breastbreast invasive carcinomaFemale>=65I/IIHormone TherapytamoxiphenSD
CHI3L1SNVMissense_Mutationc.217N>Ap.Asp73Asnp.D73NP36222protein_codingdeleterious(0.01)probably_damaging(0.995)TCGA-BH-A0HF-01Breastbreast invasive carcinomaFemale>=65I/IIHormone TherapyarimidexSD
CHI3L1SNVMissense_Mutationrs376864309c.267C>Ap.Asn89Lysp.N89KP36222protein_codingtolerated(0.95)benign(0.007)TCGA-BH-A8FZ-01Breastbreast invasive carcinomaFemale<65I/IIUnknownUnknownSD
CHI3L1SNVMissense_Mutationc.620N>Gp.Asp207Glyp.D207GP36222protein_codingdeleterious(0)probably_damaging(0.96)TCGA-C8-A135-01Breastbreast invasive carcinomaFemale<65I/IIChemotherapy5-fluorouracilCR
CHI3L1SNVMissense_Mutationc.379N>Gp.Leu127Valp.L127VP36222protein_codingdeleterious(0)probably_damaging(0.998)TCGA-E2-A15E-01Breastbreast invasive carcinomaFemale<65I/IIChemotherapydoxorubicinSD
CHI3L1SNVMissense_Mutationrs762736598c.185N>Ap.Ser62Asnp.S62NP36222protein_codingtolerated(0.86)benign(0.033)TCGA-E9-A22E-01Breastbreast invasive carcinomaFemale<65III/IVChemotherapycyclophosphaneSD
CHI3L1insertionNonsense_Mutationnovelc.779_780insTAGGCACCTGGGATAGCCCTCTGGCTATGGGGCTGAGGTCp.Phe261ArgfsTer5p.F261Rfs*5P36222protein_codingTCGA-A8-A07U-01Breastbreast invasive carcinomaFemale>=65III/IVChemotherapy5-fluorouracilSD
CHI3L1insertionNonsense_Mutationnovelc.502_503insAGCTGCTATGAAAGTATTTTGGAAAGGGAAGTp.Gly168GlufsTer4p.G168Efs*4P36222protein_codingTCGA-B6-A0IA-01Breastbreast invasive carcinomaFemale<65I/IIUnknownUnknownSD
CHI3L1insertionFrame_Shift_Insnovelc.225_226insGp.Leu76AlafsTer58p.L76Afs*58P36222protein_codingTCGA-E2-A1LK-01Breastbreast invasive carcinomaFemale>=65III/IVUnknownUnknownPD
Page: 1 2 3 4 5 

Top

Related drugs of malignant transformation related genes

check buttonIdentification of chemicals and drugs interact with genes involved in malignant transfromation
(DGIdb 4.0)
Entrez IDSymbolCategoryInteraction TypesDrug Claim NameDrug NamePMIDs
1116CHI3L1CELL SURFACE, DRUGGABLE GENOMEANTI-INFLAMMATORY DRUGS16035398
1116CHI3L1CELL SURFACE, DRUGGABLE GENOMECHEMOKINES15015934
Page: 1