
|
|||||
|
 | |
| |
| |
| |
| |
| |
|
Gene: CHFR |
Gene summary for CHFR |
| Gene information | Species | Human | Gene symbol | CHFR | Gene ID | 55743 |
| Gene name | checkpoint with forkhead and ring finger domains | |
| Gene Alias | RNF116 | |
| Cytomap | 12q24.33 | |
| Gene Type | protein-coding | GO ID | GO:0000003 | UniProtAcc | Q96EP1 |
Top |
Malignant transformation analysis |
| Identification of the aberrant gene expression in precancerous and cancerous lesions by comparing the gene expression of stem-like cells in diseased tissues with normal stem cells |
| Entrez ID | Symbol | Replicates | Species | Organ | Tissue | Adj P-value | Log2FC | Malignancy |
| 55743 | CHFR | LZE7T | Human | Esophagus | ESCC | 5.99e-06 | 3.27e-01 | 0.0667 |
| 55743 | CHFR | LZE20T | Human | Esophagus | ESCC | 1.09e-02 | 7.23e-02 | 0.0662 |
| 55743 | CHFR | LZE24T | Human | Esophagus | ESCC | 1.98e-05 | 6.03e-02 | 0.0596 |
| 55743 | CHFR | LZE6T | Human | Esophagus | ESCC | 1.98e-02 | 9.86e-02 | 0.0845 |
| 55743 | CHFR | P1T-E | Human | Esophagus | ESCC | 3.57e-08 | 3.07e-01 | 0.0875 |
| 55743 | CHFR | P4T-E | Human | Esophagus | ESCC | 8.86e-10 | 1.98e-01 | 0.1323 |
| 55743 | CHFR | P8T-E | Human | Esophagus | ESCC | 3.89e-22 | 2.45e-01 | 0.0889 |
| 55743 | CHFR | P9T-E | Human | Esophagus | ESCC | 4.00e-02 | 4.90e-02 | 0.1131 |
| 55743 | CHFR | P10T-E | Human | Esophagus | ESCC | 1.53e-16 | 1.70e-01 | 0.116 |
| 55743 | CHFR | P11T-E | Human | Esophagus | ESCC | 6.84e-17 | 4.04e-01 | 0.1426 |
| 55743 | CHFR | P12T-E | Human | Esophagus | ESCC | 8.52e-13 | 1.21e-01 | 0.1122 |
| 55743 | CHFR | P15T-E | Human | Esophagus | ESCC | 6.24e-12 | 1.74e-01 | 0.1149 |
| 55743 | CHFR | P16T-E | Human | Esophagus | ESCC | 1.44e-10 | 1.02e-01 | 0.1153 |
| 55743 | CHFR | P19T-E | Human | Esophagus | ESCC | 5.08e-07 | 4.39e-01 | 0.1662 |
| 55743 | CHFR | P21T-E | Human | Esophagus | ESCC | 4.43e-16 | 2.60e-01 | 0.1617 |
| 55743 | CHFR | P22T-E | Human | Esophagus | ESCC | 4.32e-09 | 1.25e-01 | 0.1236 |
| 55743 | CHFR | P23T-E | Human | Esophagus | ESCC | 5.02e-19 | 3.32e-01 | 0.108 |
| 55743 | CHFR | P24T-E | Human | Esophagus | ESCC | 6.57e-13 | 1.32e-01 | 0.1287 |
| 55743 | CHFR | P27T-E | Human | Esophagus | ESCC | 6.83e-23 | 3.25e-01 | 0.1055 |
| 55743 | CHFR | P28T-E | Human | Esophagus | ESCC | 2.91e-15 | 1.43e-01 | 0.1149 |
| Page: 1 2 3 |
| Tissue | Expression Dynamics | Abbreviation |
| Esophagus | 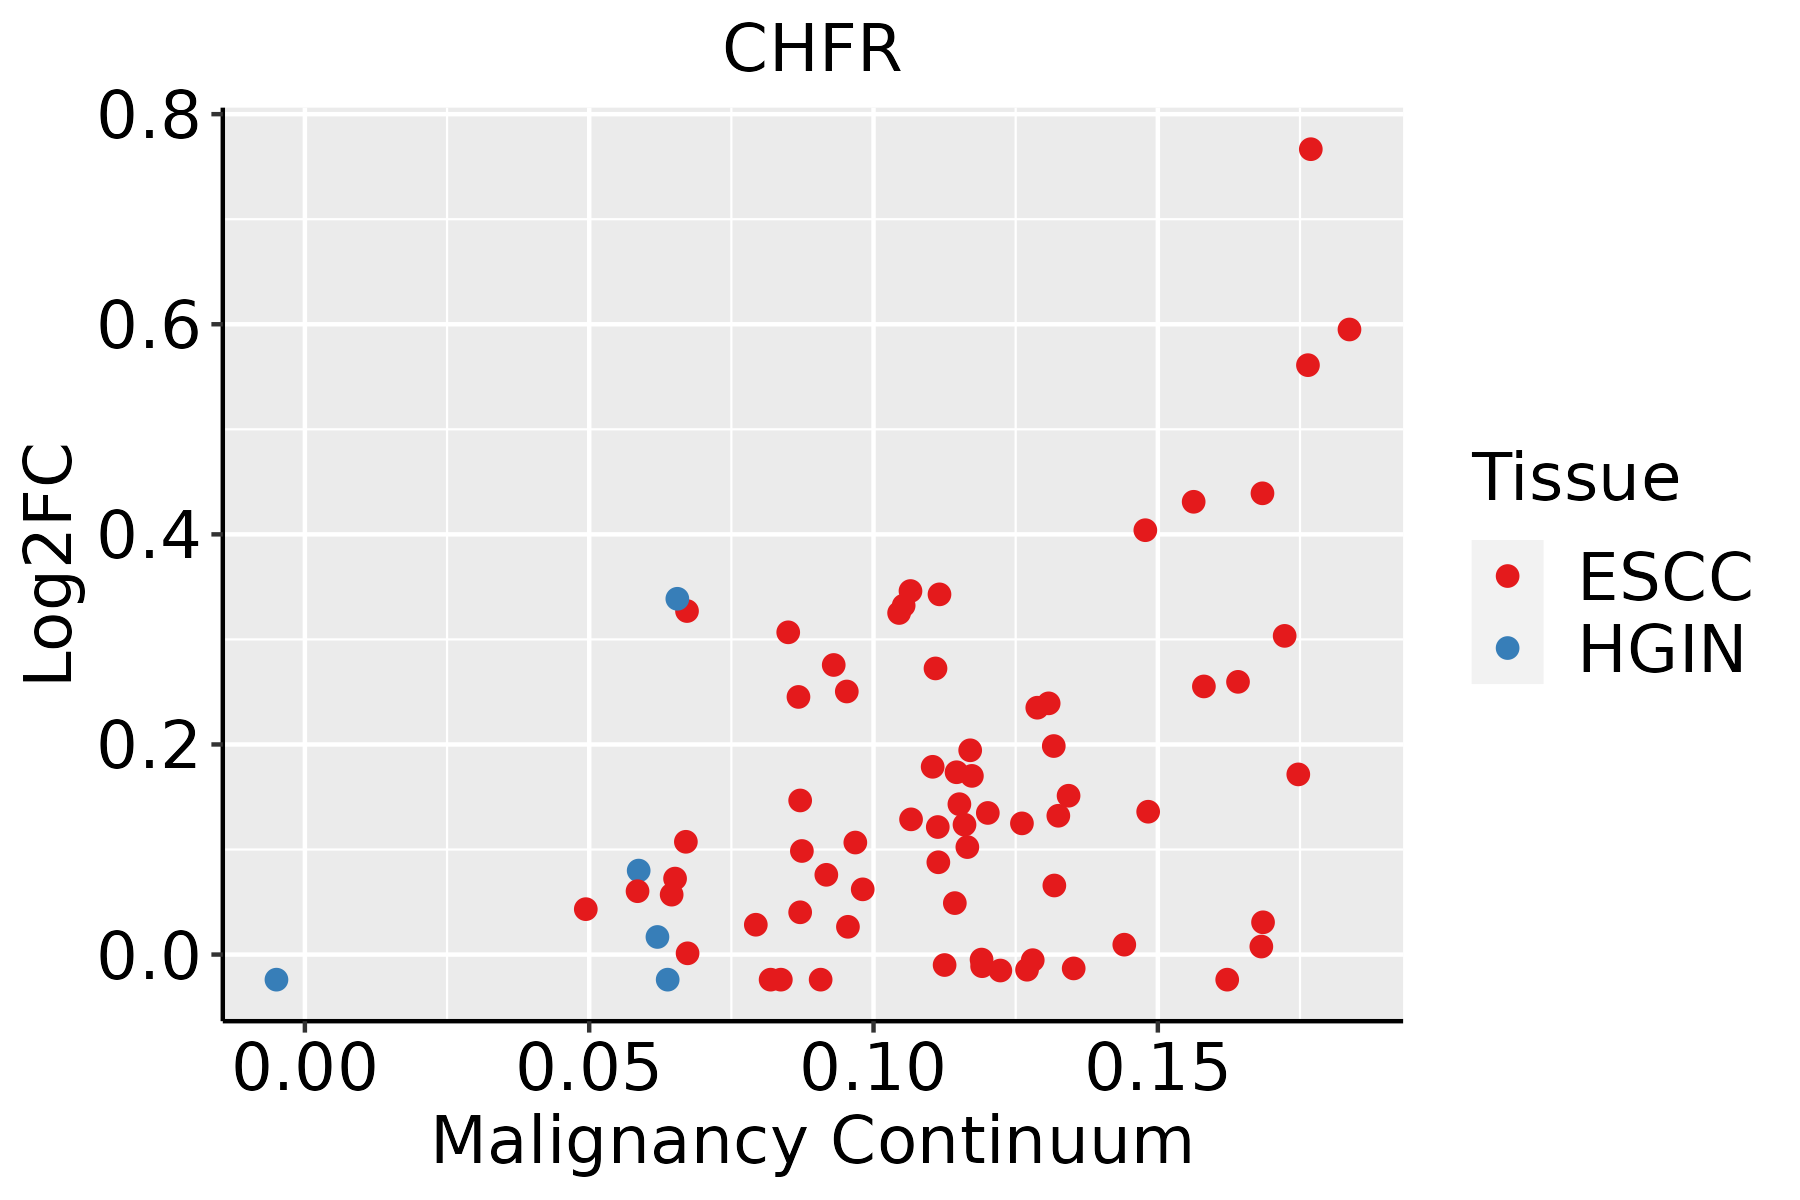 | ESCC: Esophageal squamous cell carcinoma |
| HGIN: High-grade intraepithelial neoplasias | ||
| LGIN: Low-grade intraepithelial neoplasias |
| ∗log2FC in expression of this searched gene in stem-like cells from each diseased tissue sample relative to stem-like cells in normal samples in each tissue plotted against the malignancy continuum. Samples are colored based on if they are from different disease stage. |
Top |
Malignant transformation related pathway analysis |
| Find out the enriched GO biological processes and KEGG pathways involved in transition from healthy to precancer to cancer |
| Tissue | Disease Stage | Enriched GO biological Processes |
| Colorectum | AD |  |
| Colorectum | SER |  |
| Colorectum | MSS |  |
| Colorectum | MSI-H |  |
| Colorectum | FAP |  |
| ∗Top 15 enriched GO BP terms are showed in the bar plot of each disease state in each tissue. Each row represents a significant GO biological process which is colored according to the -log10(p.adjust). |
| Page: 1 2 3 4 5 6 7 8 9 |
| GO ID | Tissue | Disease Stage | Description | Gene Ratio | Bg Ratio | pvalue | p.adjust | Count |
| GO:005134620 | Esophagus | HGIN | negative regulation of hydrolase activity | 72/2587 | 379/18723 | 2.81e-03 | 2.75e-02 | 72 |
| GO:0010498111 | Esophagus | ESCC | proteasomal protein catabolic process | 369/8552 | 490/18723 | 1.13e-41 | 1.80e-38 | 369 |
| GO:0043161111 | Esophagus | ESCC | proteasome-mediated ubiquitin-dependent protein catabolic process | 312/8552 | 412/18723 | 3.53e-36 | 4.48e-33 | 312 |
| GO:0042176111 | Esophagus | ESCC | regulation of protein catabolic process | 280/8552 | 391/18723 | 8.65e-26 | 2.39e-23 | 280 |
| GO:0031647111 | Esophagus | ESCC | regulation of protein stability | 223/8552 | 298/18723 | 5.76e-25 | 1.52e-22 | 223 |
| GO:0009896111 | Esophagus | ESCC | positive regulation of catabolic process | 332/8552 | 492/18723 | 4.36e-23 | 9.22e-21 | 332 |
| GO:0031331111 | Esophagus | ESCC | positive regulation of cellular catabolic process | 292/8552 | 427/18723 | 8.67e-22 | 1.53e-19 | 292 |
| GO:00008194 | Esophagus | ESCC | sister chromatid segregation | 157/8552 | 202/18723 | 8.41e-21 | 1.33e-18 | 157 |
| GO:1903320111 | Esophagus | ESCC | regulation of protein modification by small protein conjugation or removal | 181/8552 | 242/18723 | 1.80e-20 | 2.60e-18 | 181 |
| GO:1903362111 | Esophagus | ESCC | regulation of cellular protein catabolic process | 188/8552 | 255/18723 | 5.12e-20 | 6.62e-18 | 188 |
| GO:0045862111 | Esophagus | ESCC | positive regulation of proteolysis | 256/8552 | 372/18723 | 7.88e-20 | 9.43e-18 | 256 |
| GO:003304416 | Esophagus | ESCC | regulation of chromosome organization | 145/8552 | 187/18723 | 3.80e-19 | 4.31e-17 | 145 |
| GO:000705911 | Esophagus | ESCC | chromosome segregation | 238/8552 | 346/18723 | 1.72e-18 | 1.82e-16 | 238 |
| GO:004477216 | Esophagus | ESCC | mitotic cell cycle phase transition | 281/8552 | 424/18723 | 4.63e-18 | 4.45e-16 | 281 |
| GO:1903050111 | Esophagus | ESCC | regulation of proteolysis involved in cellular protein catabolic process | 163/8552 | 221/18723 | 1.44e-17 | 1.27e-15 | 163 |
| GO:0061136111 | Esophagus | ESCC | regulation of proteasomal protein catabolic process | 142/8552 | 187/18723 | 2.40e-17 | 2.00e-15 | 142 |
| GO:000020917 | Esophagus | ESCC | protein polyubiquitination | 170/8552 | 236/18723 | 1.40e-16 | 1.09e-14 | 170 |
| GO:0045732111 | Esophagus | ESCC | positive regulation of protein catabolic process | 167/8552 | 231/18723 | 1.47e-16 | 1.14e-14 | 167 |
| GO:0031396111 | Esophagus | ESCC | regulation of protein ubiquitination | 154/8552 | 210/18723 | 2.70e-16 | 2.04e-14 | 154 |
| GO:0032434111 | Esophagus | ESCC | regulation of proteasomal ubiquitin-dependent protein catabolic process | 107/8552 | 134/18723 | 4.06e-16 | 2.93e-14 | 107 |
| Page: 1 2 3 4 |
| Pathway ID | Tissue | Disease Stage | Description | Gene Ratio | Bg Ratio | pvalue | p.adjust | qvalue | Count |
| Page: 1 |
Top |
Cell-cell communication analysis |
| Identification of potential cell-cell interactions between two cell types and their ligand-receptor pairs for different disease states |
| Ligand | Receptor | LRpair | Pathway | Tissue | Disease Stage |
| Page: 1 |
Top |
Single-cell gene regulatory network inference analysis |
| Find out the significant the regulons (TFs) and the target genes of each regulon across cell types for different disease states |
| TF | Cell Type | Tissue | Disease Stage | Target Gene | RSS | Regulon Activity |
| ∗The dot plots of a searched regulon are shown for all cell subpopulations in each disease state of each tissue based on the regulon specific score inferred using pySCENIC and by calculating the average expression. |
| Page: 1 |
Top |
Somatic mutation of malignant transformation related genes |
| Annotation of somatic variants for genes involved in malignant transformation |
| Hugo Symbol | Variant Class | Variant Classification | dbSNP RS | HGVSc | HGVSp | HGVSp Short | SWISSPROT | BIOTYPE | SIFT | PolyPhen | Tumor Sample Barcode | Tissue | Histology | Sex | Age | Stage | Therapy Types | Drugs | Outcome |
| CHFR | SNV | Missense_Mutation | c.331N>A | p.Glu111Lys | p.E111K | Q96EP1 | protein_coding | deleterious(0.02) | probably_damaging(0.997) | TCGA-A2-A0YK-01 | Breast | breast invasive carcinoma | Female | <65 | I/II | Chemotherapy | cytoxan | SD | |
| CHFR | SNV | Missense_Mutation | c.517N>A | p.Glu173Lys | p.E173K | Q96EP1 | protein_coding | deleterious(0.01) | probably_damaging(0.938) | TCGA-D8-A27G-01 | Breast | breast invasive carcinoma | Female | >=65 | I/II | Unknown | Unknown | SD | |
| CHFR | insertion | In_Frame_Ins | novel | c.1734_1735insTGGGATTACAGGCATGTGCCACCACACCCAGCT | p.Ser578_Leu579insTrpAspTyrArgHisValProProHisProAla | p.S578_L579insWDYRHVPPHPA | Q96EP1 | protein_coding | TCGA-AN-A0FX-01 | Breast | breast invasive carcinoma | Female | <65 | I/II | Unknown | Unknown | SD | ||
| CHFR | insertion | In_Frame_Ins | novel | c.1125_1126insCCTGACCTCGTGATCCGCCCGCCTCAGCCTCCCAAA | p.Asp375_Val376insProAspLeuValIleArgProProGlnProProLys | p.D375_V376insPDLVIRPPQPPK | Q96EP1 | protein_coding | TCGA-B6-A0RE-01 | Breast | breast invasive carcinoma | Female | <65 | I/II | Unknown | Unknown | SD | ||
| CHFR | insertion | In_Frame_Ins | novel | c.1224_1225insACACCCTTCCCTTTGCTTCGACTCGTCATGGGTGTGGCATCT | p.Leu408_Leu409insThrProPheProLeuLeuArgLeuValMetGlyValAlaSer | p.L408_L409insTPFPLLRLVMGVAS | Q96EP1 | protein_coding | TCGA-B6-A0RG-01 | Breast | breast invasive carcinoma | Female | <65 | I/II | Unknown | Unknown | SD | ||
| CHFR | SNV | Missense_Mutation | c.572N>T | p.Ser191Phe | p.S191F | Q96EP1 | protein_coding | deleterious(0) | possibly_damaging(0.653) | TCGA-IR-A3LH-01 | Cervix | cervical & endocervical cancer | Female | <65 | I/II | Chemotherapy | cisplatin | CR | |
| CHFR | SNV | Missense_Mutation | rs533118486 | c.718N>A | p.Ala240Thr | p.A240T | Q96EP1 | protein_coding | tolerated(0.37) | benign(0.005) | TCGA-A6-6781-01 | Colorectum | colon adenocarcinoma | Male | <65 | III/IV | Chemotherapy | oxaliplatin | SD |
| CHFR | SNV | Missense_Mutation | c.1771N>T | p.Asp591Tyr | p.D591Y | Q96EP1 | protein_coding | deleterious(0) | probably_damaging(0.974) | TCGA-AA-3715-01 | Colorectum | colon adenocarcinoma | Male | >=65 | I/II | Unknown | Unknown | PD | |
| CHFR | SNV | Missense_Mutation | rs35206714 | c.700N>T | p.Leu234Phe | p.L234F | Q96EP1 | protein_coding | tolerated(0.61) | benign(0.007) | TCGA-AA-3984-01 | Colorectum | colon adenocarcinoma | Female | <65 | I/II | Unknown | Unknown | SD |
| CHFR | SNV | Missense_Mutation | novel | c.1190N>A | p.Ser397Tyr | p.S397Y | Q96EP1 | protein_coding | tolerated(0.09) | probably_damaging(0.956) | TCGA-CA-6717-01 | Colorectum | colon adenocarcinoma | Male | <65 | I/II | Chemotherapy | oxaliplatin | CR |
| Page: 1 2 3 4 5 6 7 |
Top |
Related drugs of malignant transformation related genes |
| Identification of chemicals and drugs interact with genes involved in malignant transfromation |
| (DGIdb 4.0) |
| Entrez ID | Symbol | Category | Interaction Types | Drug Claim Name | Drug Name | PMIDs |
| Page: 1 |

Copyright 2023-Present -The University of Texas Health Science Center at Houston |