
|
|||||
|
 | |
| |
| |
| |
| |
| |
|
Gene: CHDH |
Gene summary for CHDH |
| Gene information | Species | Human | Gene symbol | CHDH | Gene ID | 55349 |
| Gene name | choline dehydrogenase | |
| Gene Alias | CHDH | |
| Cytomap | 3p21.1 | |
| Gene Type | protein-coding | GO ID | GO:0006575 | UniProtAcc | Q8NE62 |
Top |
Malignant transformation analysis |
| Identification of the aberrant gene expression in precancerous and cancerous lesions by comparing the gene expression of stem-like cells in diseased tissues with normal stem cells |
| Entrez ID | Symbol | Replicates | Species | Organ | Tissue | Adj P-value | Log2FC | Malignancy |
| 55349 | CHDH | HTA11_1938_2000001011 | Human | Colorectum | AD | 8.97e-05 | 4.74e-01 | -0.0811 |
| 55349 | CHDH | HTA11_866_3004761011 | Human | Colorectum | AD | 5.88e-13 | 5.74e-01 | 0.096 |
| 55349 | CHDH | HTA11_7663_2000001011 | Human | Colorectum | SER | 2.44e-03 | 5.79e-01 | 0.0131 |
| 55349 | CHDH | HTA11_10711_2000001011 | Human | Colorectum | AD | 2.58e-04 | 4.88e-01 | 0.0338 |
| 55349 | CHDH | HTA11_7696_3000711011 | Human | Colorectum | AD | 1.52e-08 | 5.29e-01 | 0.0674 |
| 55349 | CHDH | HTA11_99999971662_82457 | Human | Colorectum | MSS | 4.20e-19 | 7.62e-01 | 0.3859 |
| 55349 | CHDH | A015-C-203 | Human | Colorectum | FAP | 5.77e-06 | 8.93e-02 | -0.1294 |
| 55349 | CHDH | A002-C-205 | Human | Colorectum | FAP | 3.99e-04 | 7.42e-03 | -0.1236 |
| 55349 | CHDH | A015-C-006 | Human | Colorectum | FAP | 3.19e-02 | 6.54e-02 | -0.0994 |
| 55349 | CHDH | A015-C-106 | Human | Colorectum | FAP | 7.71e-03 | 1.97e-01 | -0.0511 |
| 55349 | CHDH | A002-C-114 | Human | Colorectum | FAP | 3.24e-04 | 1.42e-01 | -0.1561 |
| 55349 | CHDH | A015-C-104 | Human | Colorectum | FAP | 3.87e-09 | 2.78e-01 | -0.1899 |
| 55349 | CHDH | A002-C-016 | Human | Colorectum | FAP | 1.15e-03 | -3.39e-02 | 0.0521 |
| 55349 | CHDH | A002-C-116 | Human | Colorectum | FAP | 6.61e-05 | -1.67e-01 | -0.0452 |
| 55349 | CHDH | A014-C-008 | Human | Colorectum | FAP | 2.46e-03 | 1.11e-01 | -0.191 |
| 55349 | CHDH | A018-E-020 | Human | Colorectum | FAP | 4.79e-03 | -3.46e-02 | -0.2034 |
| 55349 | CHDH | F034 | Human | Colorectum | FAP | 3.97e-02 | 2.67e-02 | -0.0665 |
| 55349 | CHDH | CRC-3-11773 | Human | Colorectum | CRC | 2.49e-02 | 2.43e-01 | 0.2564 |
| 55349 | CHDH | S43 | Human | Liver | Cirrhotic | 2.96e-07 | -1.42e-01 | -0.0187 |
| 55349 | CHDH | HCC1_Meng | Human | Liver | HCC | 4.14e-68 | -4.52e-02 | 0.0246 |
| Page: 1 2 |
| Tissue | Expression Dynamics | Abbreviation |
| Colorectum (GSE201348) |  | FAP: Familial adenomatous polyposis |
| CRC: Colorectal cancer | ||
| Colorectum (HTA11) |  | AD: Adenomas |
| SER: Sessile serrated lesions | ||
| MSI-H: Microsatellite-high colorectal cancer | ||
| MSS: Microsatellite stable colorectal cancer | ||
| Liver |  | HCC: Hepatocellular carcinoma |
| NAFLD: Non-alcoholic fatty liver disease | ||
| Prostate | 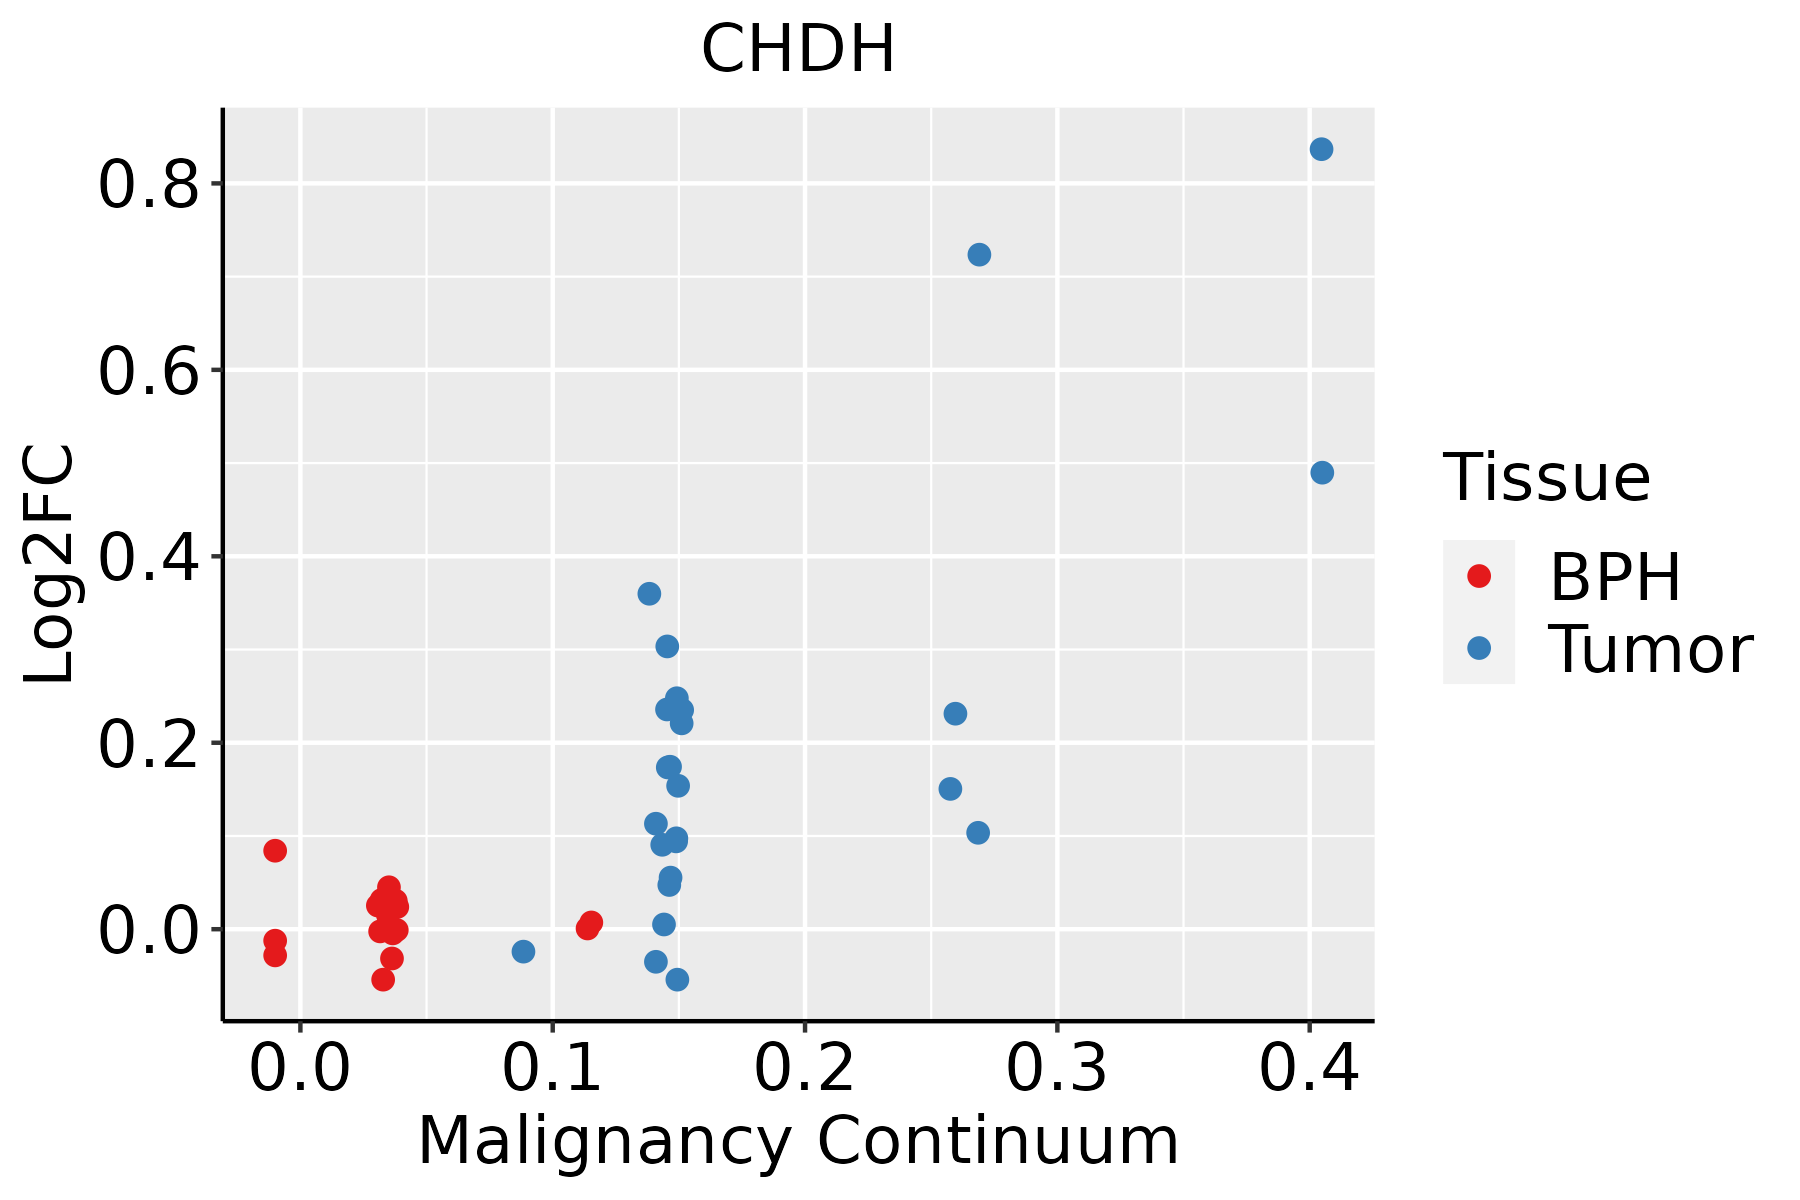 | BPH: Benign Prostatic Hyperplasia |
| ∗log2FC in expression of this searched gene in stem-like cells from each diseased tissue sample relative to stem-like cells in normal samples in each tissue plotted against the malignancy continuum. Samples are colored based on if they are from different disease stage. |
Top |
Malignant transformation related pathway analysis |
| Find out the enriched GO biological processes and KEGG pathways involved in transition from healthy to precancer to cancer |
| Tissue | Disease Stage | Enriched GO biological Processes |
| Colorectum | AD |  |
| Colorectum | SER |  |
| Colorectum | MSS |  |
| Colorectum | MSI-H |  |
| Colorectum | FAP |  |
| ∗Top 15 enriched GO BP terms are showed in the bar plot of each disease state in each tissue. Each row represents a significant GO biological process which is colored according to the -log10(p.adjust). |
| Page: 1 2 3 4 5 6 7 8 9 |
| GO ID | Tissue | Disease Stage | Description | Gene Ratio | Bg Ratio | pvalue | p.adjust | Count |
| GO:0006575 | Colorectum | AD | cellular modified amino acid metabolic process | 59/3918 | 188/18723 | 4.80e-04 | 5.27e-03 | 59 |
| GO:0042398 | Colorectum | AD | cellular modified amino acid biosynthetic process | 18/3918 | 46/18723 | 3.67e-03 | 2.60e-02 | 18 |
| GO:00423981 | Colorectum | MSS | cellular modified amino acid biosynthetic process | 20/3467 | 46/18723 | 8.26e-05 | 1.35e-03 | 20 |
| GO:00065751 | Colorectum | MSS | cellular modified amino acid metabolic process | 55/3467 | 188/18723 | 2.16e-04 | 3.01e-03 | 55 |
| GO:00423983 | Colorectum | FAP | cellular modified amino acid biosynthetic process | 13/2622 | 46/18723 | 8.71e-03 | 4.98e-02 | 13 |
| GO:004239811 | Liver | Cirrhotic | cellular modified amino acid biosynthetic process | 25/4634 | 46/18723 | 1.61e-05 | 2.19e-04 | 25 |
| GO:000657511 | Liver | Cirrhotic | cellular modified amino acid metabolic process | 70/4634 | 188/18723 | 9.04e-05 | 9.69e-04 | 70 |
| GO:00424021 | Liver | Cirrhotic | cellular biogenic amine catabolic process | 15/4634 | 27/18723 | 5.96e-04 | 4.63e-03 | 15 |
| GO:0044106 | Liver | Cirrhotic | cellular amine metabolic process | 43/4634 | 113/18723 | 1.15e-03 | 7.83e-03 | 43 |
| GO:00093101 | Liver | Cirrhotic | amine catabolic process | 15/4634 | 29/18723 | 1.59e-03 | 1.03e-02 | 15 |
| GO:0006576 | Liver | Cirrhotic | cellular biogenic amine metabolic process | 38/4634 | 101/18723 | 2.72e-03 | 1.59e-02 | 38 |
| GO:0009308 | Liver | Cirrhotic | amine metabolic process | 43/4634 | 118/18723 | 3.03e-03 | 1.72e-02 | 43 |
| GO:000657521 | Liver | HCC | cellular modified amino acid metabolic process | 119/7958 | 188/18723 | 6.47e-09 | 1.67e-07 | 119 |
| GO:004239821 | Liver | HCC | cellular modified amino acid biosynthetic process | 34/7958 | 46/18723 | 1.53e-05 | 1.67e-04 | 34 |
| GO:0006577 | Liver | HCC | amino-acid betaine metabolic process | 13/7958 | 17/18723 | 4.77e-03 | 2.02e-02 | 13 |
| GO:00065761 | Prostate | Tumor | cellular biogenic amine metabolic process | 27/3246 | 101/18723 | 1.18e-02 | 4.81e-02 | 27 |
| Page: 1 |
| Pathway ID | Tissue | Disease Stage | Description | Gene Ratio | Bg Ratio | pvalue | p.adjust | qvalue | Count |
| hsa00260 | Liver | Cirrhotic | Glycine, serine and threonine metabolism | 22/2530 | 40/8465 | 7.85e-04 | 4.51e-03 | 2.78e-03 | 22 |
| hsa002601 | Liver | Cirrhotic | Glycine, serine and threonine metabolism | 22/2530 | 40/8465 | 7.85e-04 | 4.51e-03 | 2.78e-03 | 22 |
| hsa002602 | Liver | HCC | Glycine, serine and threonine metabolism | 28/4020 | 40/8465 | 3.28e-03 | 1.07e-02 | 5.93e-03 | 28 |
| hsa002603 | Liver | HCC | Glycine, serine and threonine metabolism | 28/4020 | 40/8465 | 3.28e-03 | 1.07e-02 | 5.93e-03 | 28 |
| Page: 1 |
Top |
Cell-cell communication analysis |
| Identification of potential cell-cell interactions between two cell types and their ligand-receptor pairs for different disease states |
| Ligand | Receptor | LRpair | Pathway | Tissue | Disease Stage |
| Page: 1 |
Top |
Single-cell gene regulatory network inference analysis |
| Find out the significant the regulons (TFs) and the target genes of each regulon across cell types for different disease states |
| TF | Cell Type | Tissue | Disease Stage | Target Gene | RSS | Regulon Activity |
| ∗The dot plots of a searched regulon are shown for all cell subpopulations in each disease state of each tissue based on the regulon specific score inferred using pySCENIC and by calculating the average expression. |
| Page: 1 |
Top |
Somatic mutation of malignant transformation related genes |
| Annotation of somatic variants for genes involved in malignant transformation |
| Hugo Symbol | Variant Class | Variant Classification | dbSNP RS | HGVSc | HGVSp | HGVSp Short | SWISSPROT | BIOTYPE | SIFT | PolyPhen | Tumor Sample Barcode | Tissue | Histology | Sex | Age | Stage | Therapy Types | Drugs | Outcome |
| CHDH | SNV | Missense_Mutation | novel | c.1411N>C | p.Glu471Gln | p.E471Q | Q8NE62 | protein_coding | deleterious(0) | probably_damaging(0.995) | TCGA-AC-A6IW-01 | Breast | breast invasive carcinoma | Female | >=65 | I/II | Unknown | Unknown | SD |
| CHDH | insertion | Frame_Shift_Ins | novel | c.938_939insCTATAAGCATT | p.Asp314TyrfsTer98 | p.D314Yfs*98 | Q8NE62 | protein_coding | TCGA-A2-A0CQ-01 | Breast | breast invasive carcinoma | Female | <65 | I/II | Chemotherapy | adriamycin | SD | ||
| CHDH | insertion | Nonsense_Mutation | novel | c.906_907insTCTTCAAAATGGGGATGCACAGTTTCAACCTGA | p.Pro302_Gln303insSerSerLysTrpGlyCysThrValSerThrTer | p.P302_Q303insSSKWGCTVST* | Q8NE62 | protein_coding | TCGA-A8-A097-01 | Breast | breast invasive carcinoma | Female | >=65 | I/II | Hormone Therapy | tamoxiphen | SD | ||
| CHDH | SNV | Missense_Mutation | novel | c.358C>A | p.Leu120Met | p.L120M | Q8NE62 | protein_coding | tolerated(0.64) | benign(0.047) | TCGA-2W-A8YY-01 | Cervix | cervical & endocervical cancer | Female | <65 | I/II | Chemotherapy | cisplatin | CR |
| CHDH | SNV | Missense_Mutation | rs774317689 | c.1234C>T | p.Arg412Trp | p.R412W | Q8NE62 | protein_coding | deleterious(0) | probably_damaging(0.958) | TCGA-DR-A0ZL-01 | Cervix | cervical & endocervical cancer | Female | <65 | I/II | Unknown | Unknown | SD |
| CHDH | SNV | Missense_Mutation | c.1210C>T | p.Pro404Ser | p.P404S | Q8NE62 | protein_coding | deleterious(0.01) | probably_damaging(0.997) | TCGA-A6-6781-01 | Colorectum | colon adenocarcinoma | Male | <65 | III/IV | Chemotherapy | oxaliplatin | SD | |
| CHDH | SNV | Missense_Mutation | rs757045949 | c.1690N>A | p.Ala564Thr | p.A564T | Q8NE62 | protein_coding | deleterious(0) | probably_damaging(0.977) | TCGA-AA-3510-01 | Colorectum | colon adenocarcinoma | Male | >=65 | I/II | Unknown | Unknown | SD |
| CHDH | SNV | Missense_Mutation | rs780132366 | c.1043N>A | p.Arg348His | p.R348H | Q8NE62 | protein_coding | deleterious(0.02) | benign(0) | TCGA-QG-A5Z2-01 | Colorectum | colon adenocarcinoma | Male | <65 | I/II | Unknown | Unknown | SD |
| CHDH | SNV | Missense_Mutation | c.1087T>C | p.Cys363Arg | p.C363R | Q8NE62 | protein_coding | tolerated(0.43) | benign(0) | TCGA-AG-3885-01 | Colorectum | rectum adenocarcinoma | Female | >=65 | III/IV | Ancillary | zoledronic | SD | |
| CHDH | SNV | Missense_Mutation | rs756480475 | c.752N>A | p.Arg251His | p.R251H | Q8NE62 | protein_coding | deleterious(0) | probably_damaging(0.999) | TCGA-AG-A02N-01 | Colorectum | rectum adenocarcinoma | Male | >=65 | I/II | Chemotherapy | folinic | CR |
| Page: 1 2 3 4 |
Top |
Related drugs of malignant transformation related genes |
| Identification of chemicals and drugs interact with genes involved in malignant transfromation |
| (DGIdb 4.0) |
| Entrez ID | Symbol | Category | Interaction Types | Drug Claim Name | Drug Name | PMIDs |
| Page: 1 |

Copyright 2023-Present -The University of Texas Health Science Center at Houston |