
|
|||||
|
 | |
| |
| |
| |
| |
| |
|
Gene: CHD9 |
Gene summary for CHD9 |
| Gene information | Species | Human | Gene symbol | CHD9 | Gene ID | 80205 |
| Gene name | chromodomain helicase DNA binding protein 9 | |
| Gene Alias | AD013 | |
| Cytomap | 16q12.2 | |
| Gene Type | protein-coding | GO ID | GO:0006325 | UniProtAcc | Q3L8U1 |
Top |
Malignant transformation analysis |
| Identification of the aberrant gene expression in precancerous and cancerous lesions by comparing the gene expression of stem-like cells in diseased tissues with normal stem cells |
| Entrez ID | Symbol | Replicates | Species | Organ | Tissue | Adj P-value | Log2FC | Malignancy |
| 80205 | CHD9 | CA_HPV_1 | Human | Cervix | CC | 1.52e-05 | -2.12e-02 | 0.0264 |
| 80205 | CHD9 | CA_HPV_3 | Human | Cervix | CC | 5.01e-03 | 1.42e-01 | 0.0414 |
| 80205 | CHD9 | CCI_1 | Human | Cervix | CC | 3.24e-06 | 9.94e-01 | 0.528 |
| 80205 | CHD9 | CCI_2 | Human | Cervix | CC | 2.38e-10 | 1.15e+00 | 0.5249 |
| 80205 | CHD9 | CCI_3 | Human | Cervix | CC | 2.44e-14 | 1.17e+00 | 0.516 |
| 80205 | CHD9 | L1 | Human | Cervix | CC | 8.80e-03 | -2.50e-01 | 0.0802 |
| 80205 | CHD9 | HTA11_3410_2000001011 | Human | Colorectum | AD | 6.41e-44 | -8.84e-01 | 0.0155 |
| 80205 | CHD9 | HTA11_2487_2000001011 | Human | Colorectum | SER | 1.78e-11 | -5.26e-01 | -0.1808 |
| 80205 | CHD9 | HTA11_2951_2000001011 | Human | Colorectum | AD | 2.36e-02 | -7.31e-01 | 0.0216 |
| 80205 | CHD9 | HTA11_3361_2000001011 | Human | Colorectum | AD | 7.33e-16 | -8.50e-01 | -0.1207 |
| 80205 | CHD9 | HTA11_5212_2000001011 | Human | Colorectum | AD | 1.13e-04 | -6.29e-01 | -0.2061 |
| 80205 | CHD9 | HTA11_7862_2000001011 | Human | Colorectum | AD | 1.76e-08 | -6.54e-01 | -0.0179 |
| 80205 | CHD9 | HTA11_866_3004761011 | Human | Colorectum | AD | 6.04e-21 | -7.12e-01 | 0.096 |
| 80205 | CHD9 | HTA11_9408_2000001011 | Human | Colorectum | AD | 4.49e-03 | -7.76e-01 | 0.0451 |
| 80205 | CHD9 | HTA11_8622_2000001021 | Human | Colorectum | SER | 9.47e-06 | -7.68e-01 | 0.0528 |
| 80205 | CHD9 | HTA11_10711_2000001011 | Human | Colorectum | AD | 7.16e-11 | -5.71e-01 | 0.0338 |
| 80205 | CHD9 | HTA11_7696_3000711011 | Human | Colorectum | AD | 1.34e-02 | -3.63e-01 | 0.0674 |
| 80205 | CHD9 | HTA11_7469_2000001011 | Human | Colorectum | AD | 1.11e-02 | -7.94e-01 | -0.0124 |
| 80205 | CHD9 | HTA11_11156_2000001011 | Human | Colorectum | AD | 3.54e-04 | -8.97e-01 | 0.0397 |
| 80205 | CHD9 | HTA11_6818_2000001021 | Human | Colorectum | AD | 1.59e-04 | -5.77e-01 | 0.0588 |
| Page: 1 2 3 4 5 6 7 8 9 10 11 12 |
| Tissue | Expression Dynamics | Abbreviation |
| Cervix | 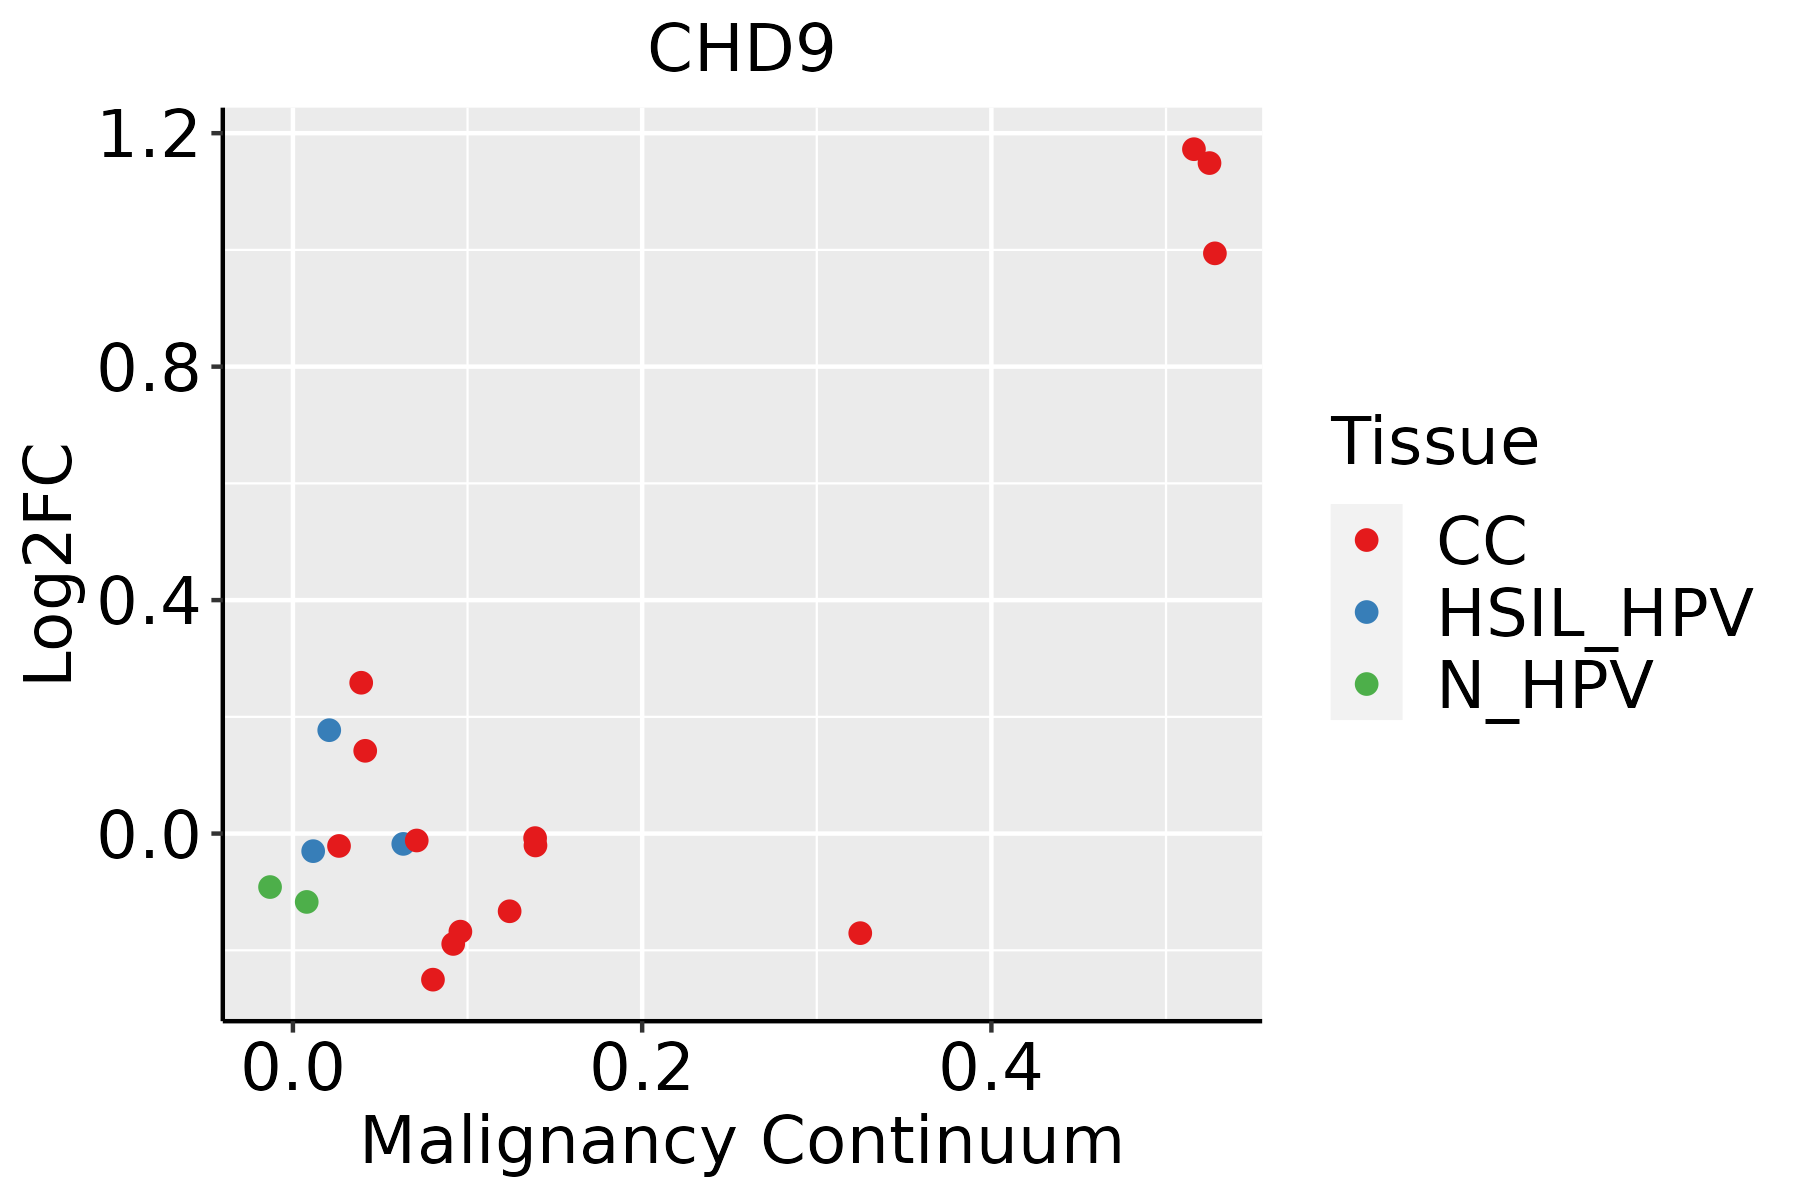 | CC: Cervix cancer |
| HSIL_HPV: HPV-infected high-grade squamous intraepithelial lesions | ||
| N_HPV: HPV-infected normal cervix | ||
| Colorectum (GSE201348) |  | FAP: Familial adenomatous polyposis |
| CRC: Colorectal cancer | ||
| Colorectum (HTA11) |  | AD: Adenomas |
| SER: Sessile serrated lesions | ||
| MSI-H: Microsatellite-high colorectal cancer | ||
| MSS: Microsatellite stable colorectal cancer | ||
| Esophagus | 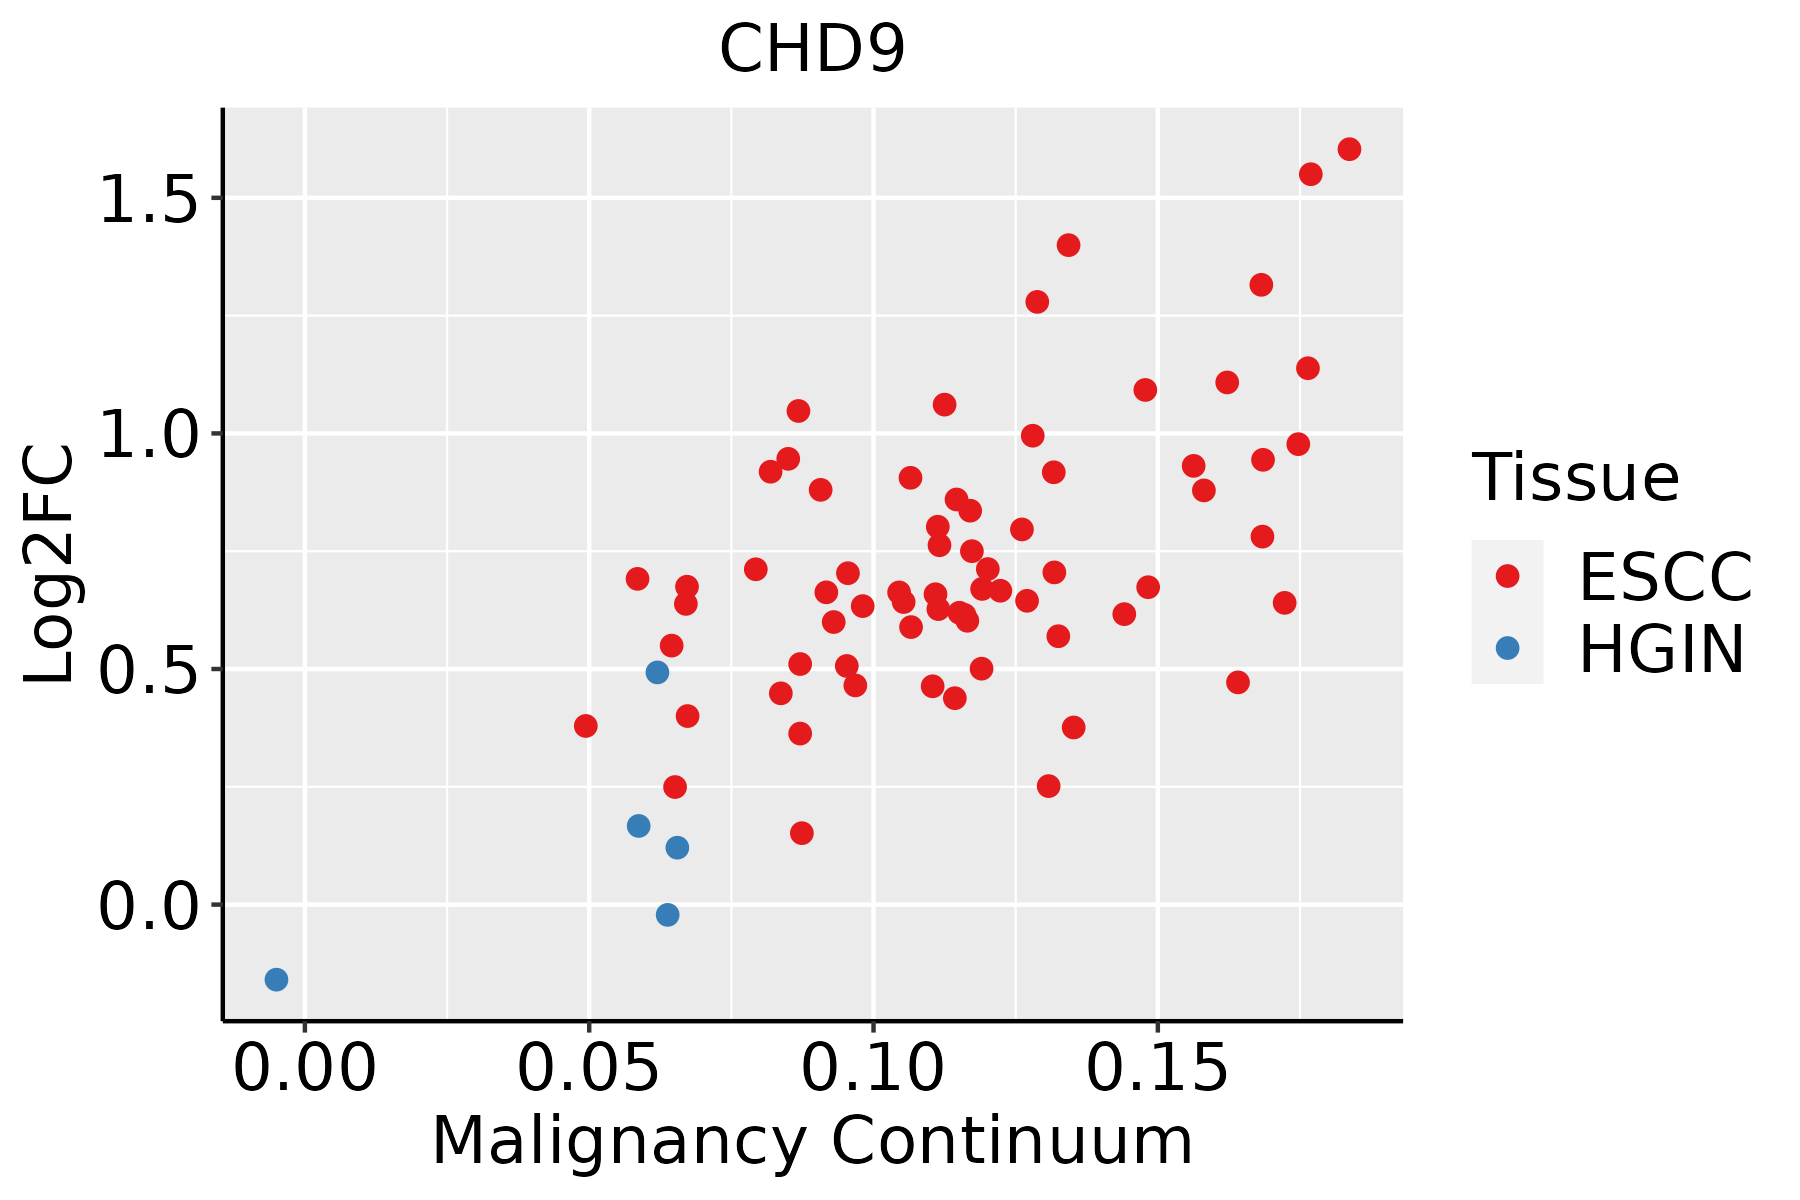 | ESCC: Esophageal squamous cell carcinoma |
| HGIN: High-grade intraepithelial neoplasias | ||
| LGIN: Low-grade intraepithelial neoplasias | ||
| Liver | 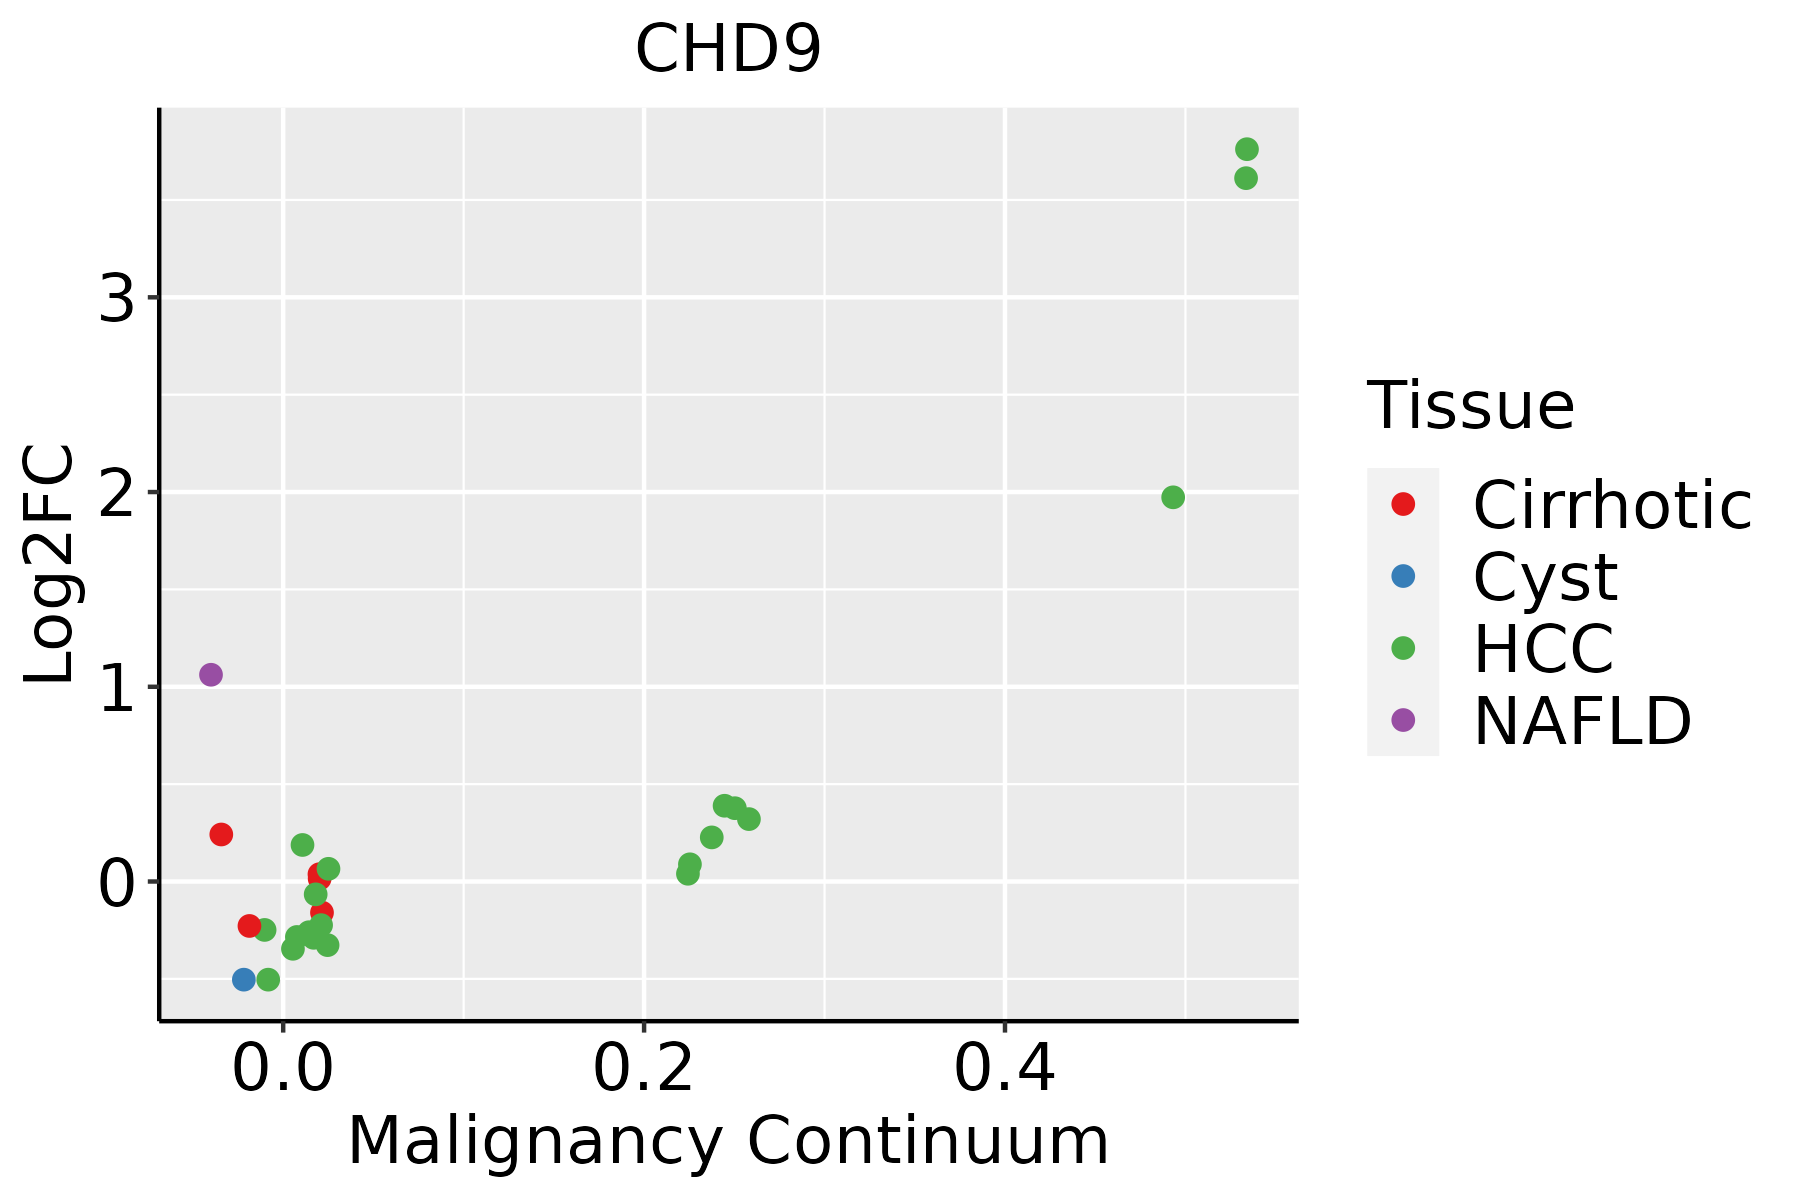 | HCC: Hepatocellular carcinoma |
| NAFLD: Non-alcoholic fatty liver disease | ||
| Lung | 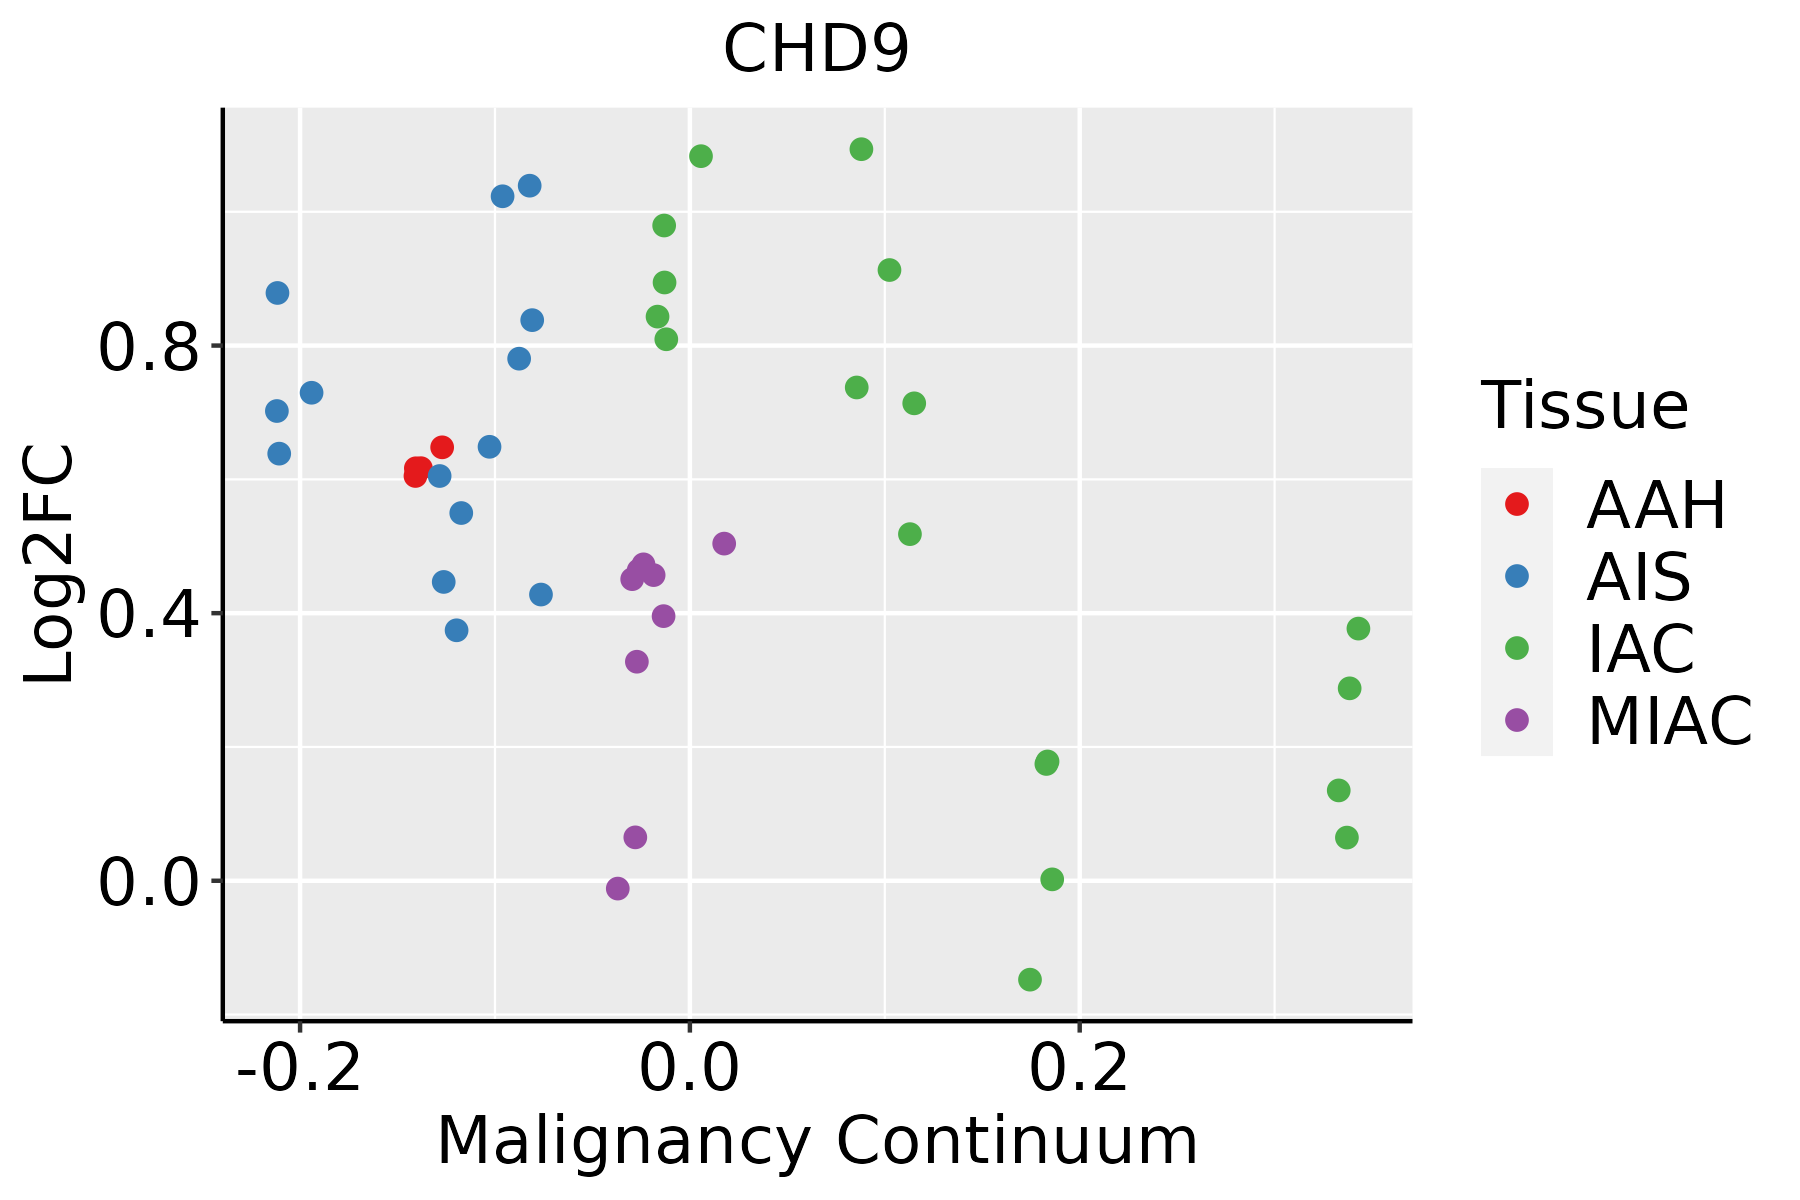 | AAH: Atypical adenomatous hyperplasia |
| AIS: Adenocarcinoma in situ | ||
| IAC: Invasive lung adenocarcinoma | ||
| MIA: Minimally invasive adenocarcinoma | ||
| Oral Cavity | 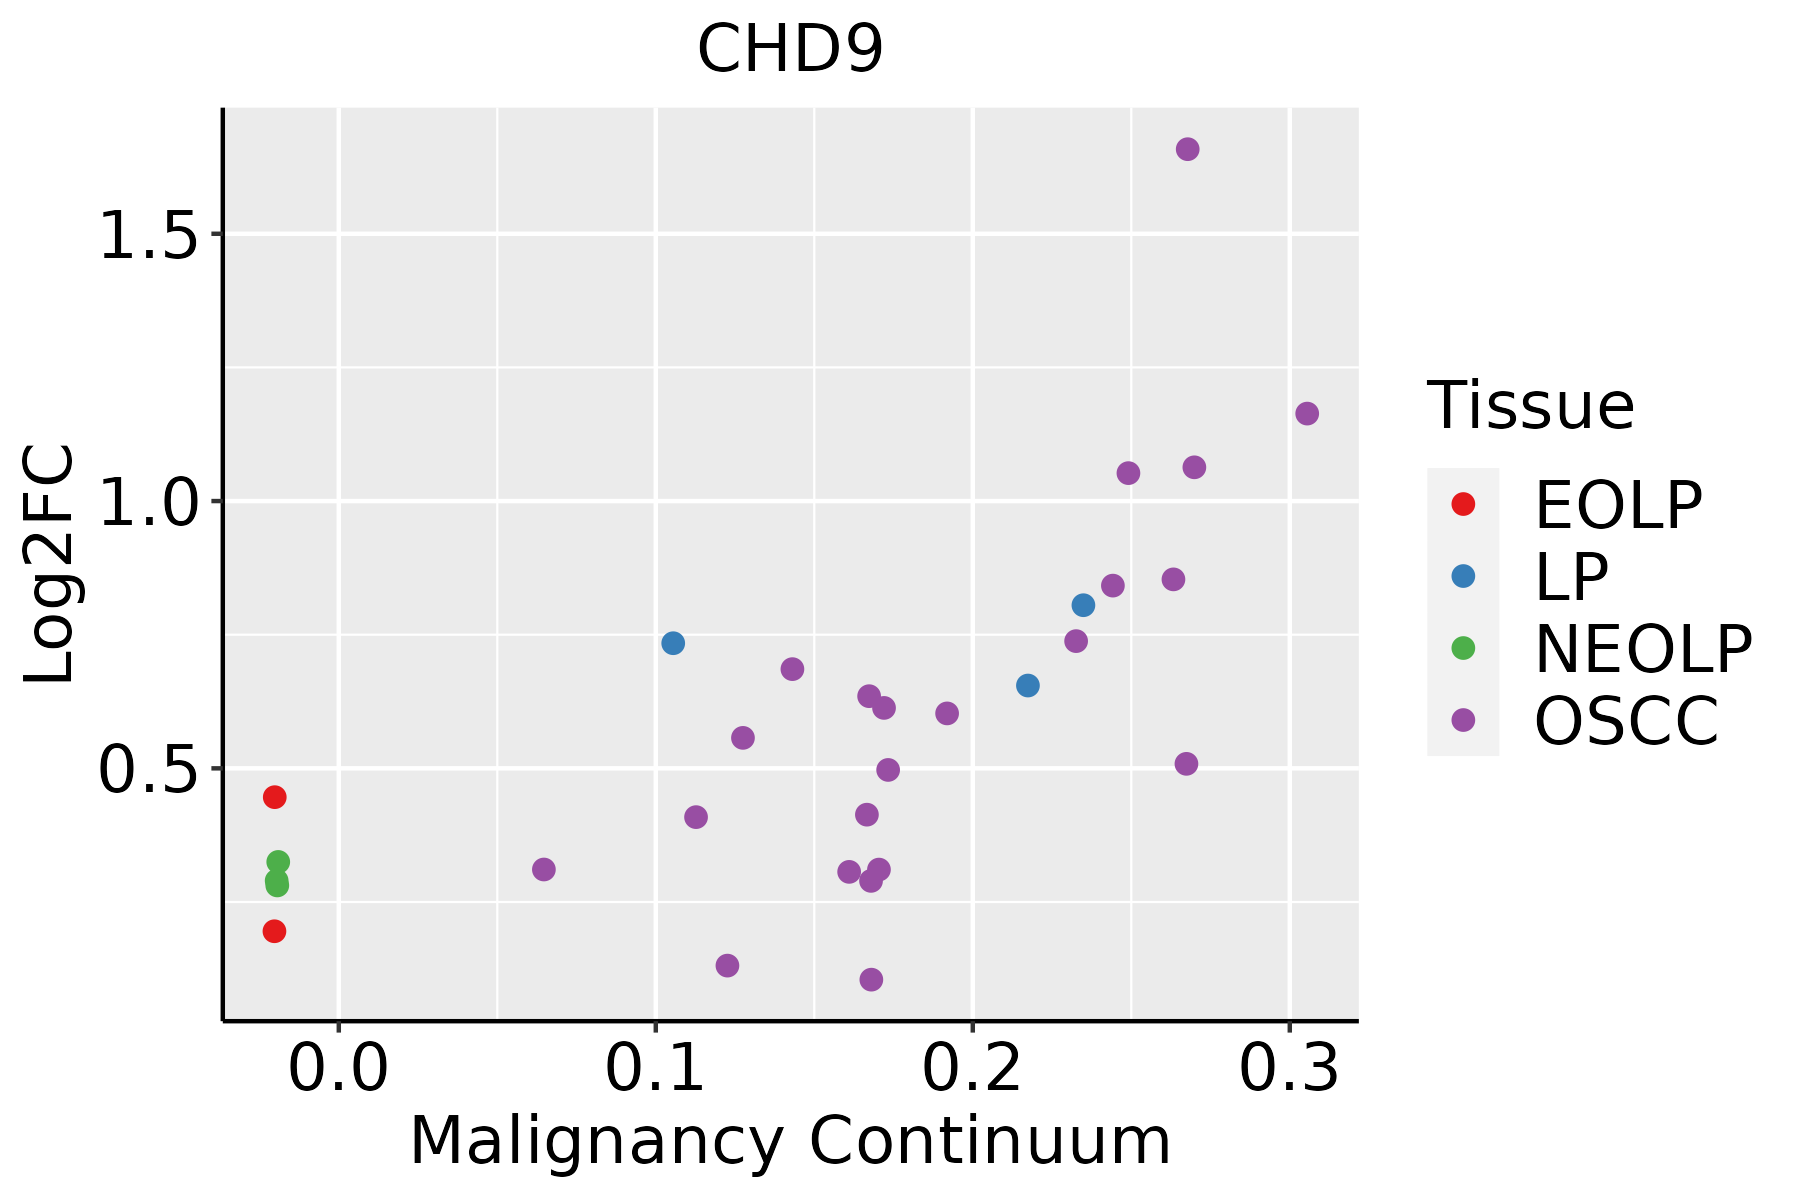 | EOLP: Erosive Oral lichen planus |
| LP: leukoplakia | ||
| NEOLP: Non-erosive oral lichen planus | ||
| OSCC: Oral squamous cell carcinoma | ||
| Prostate | 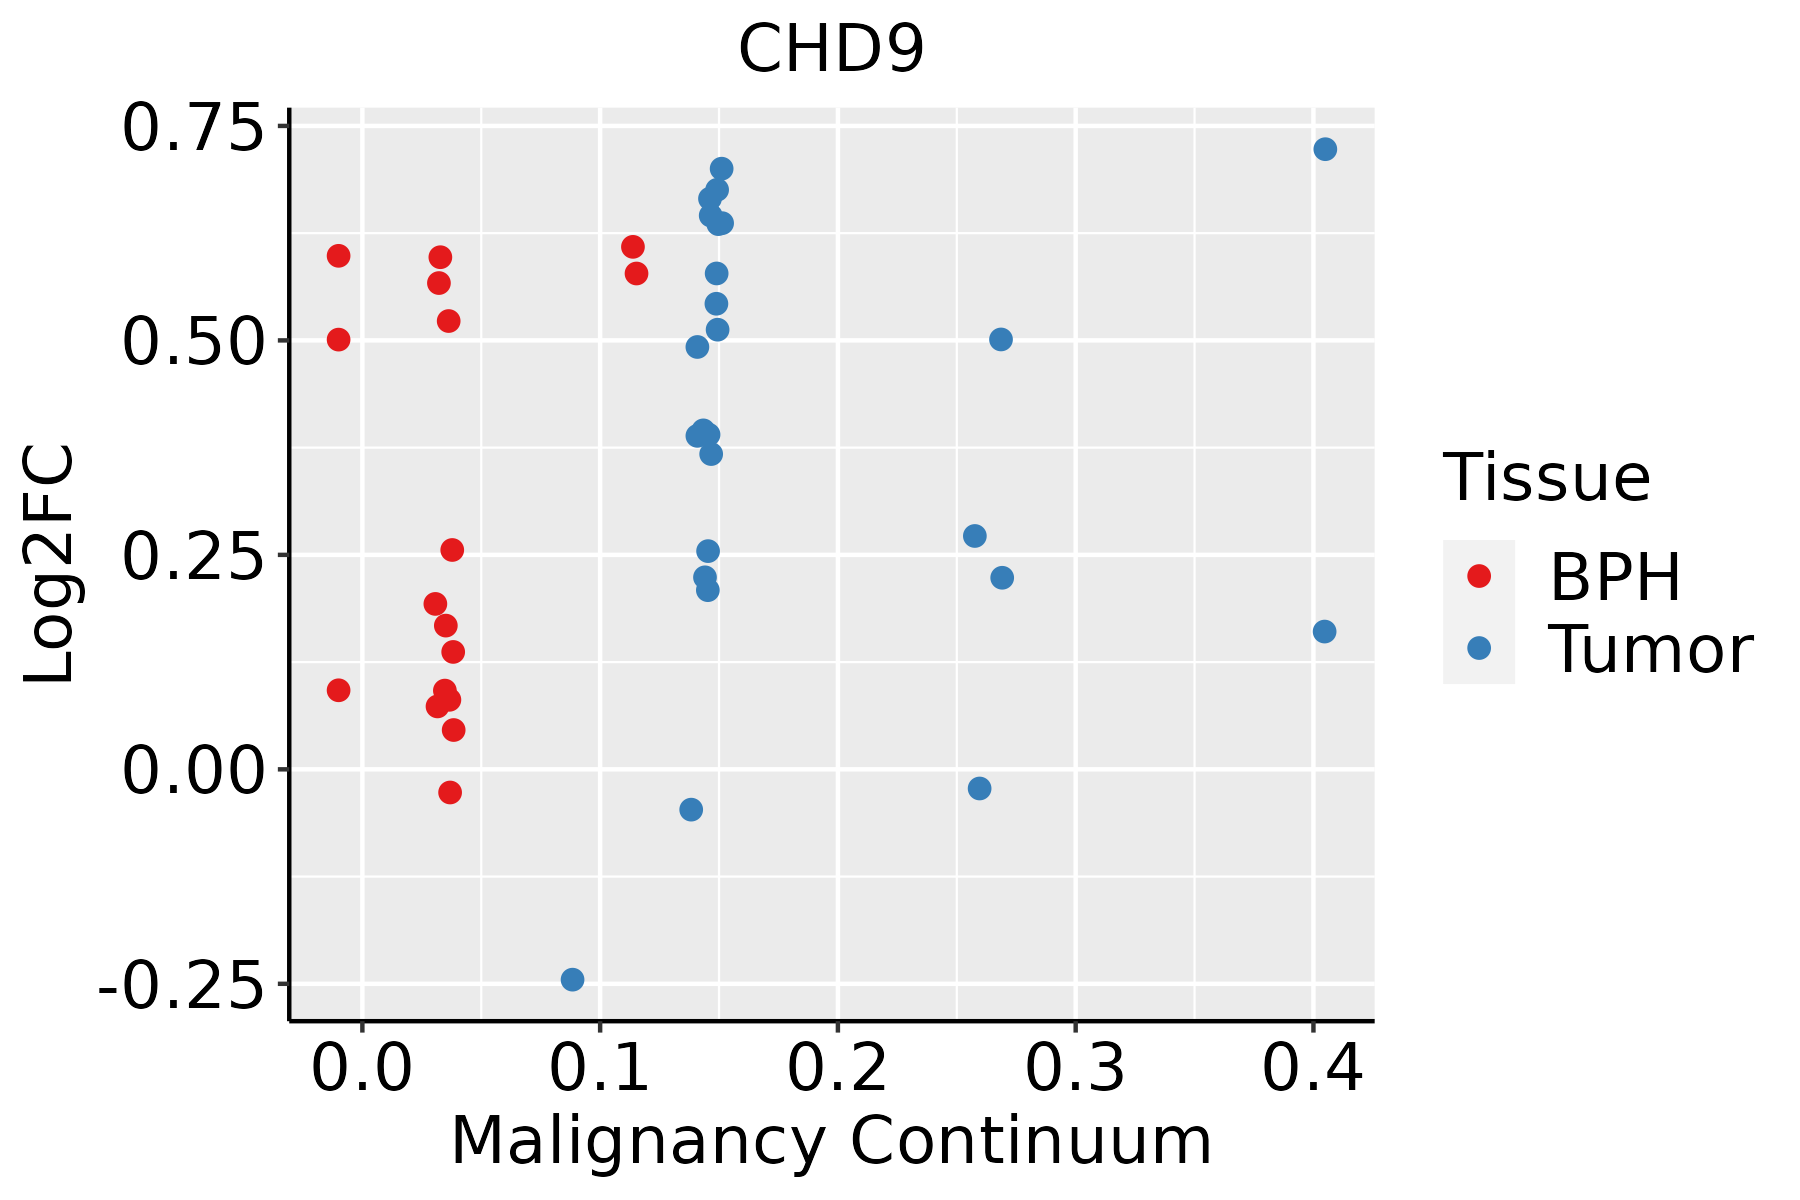 | BPH: Benign Prostatic Hyperplasia |
| Skin | 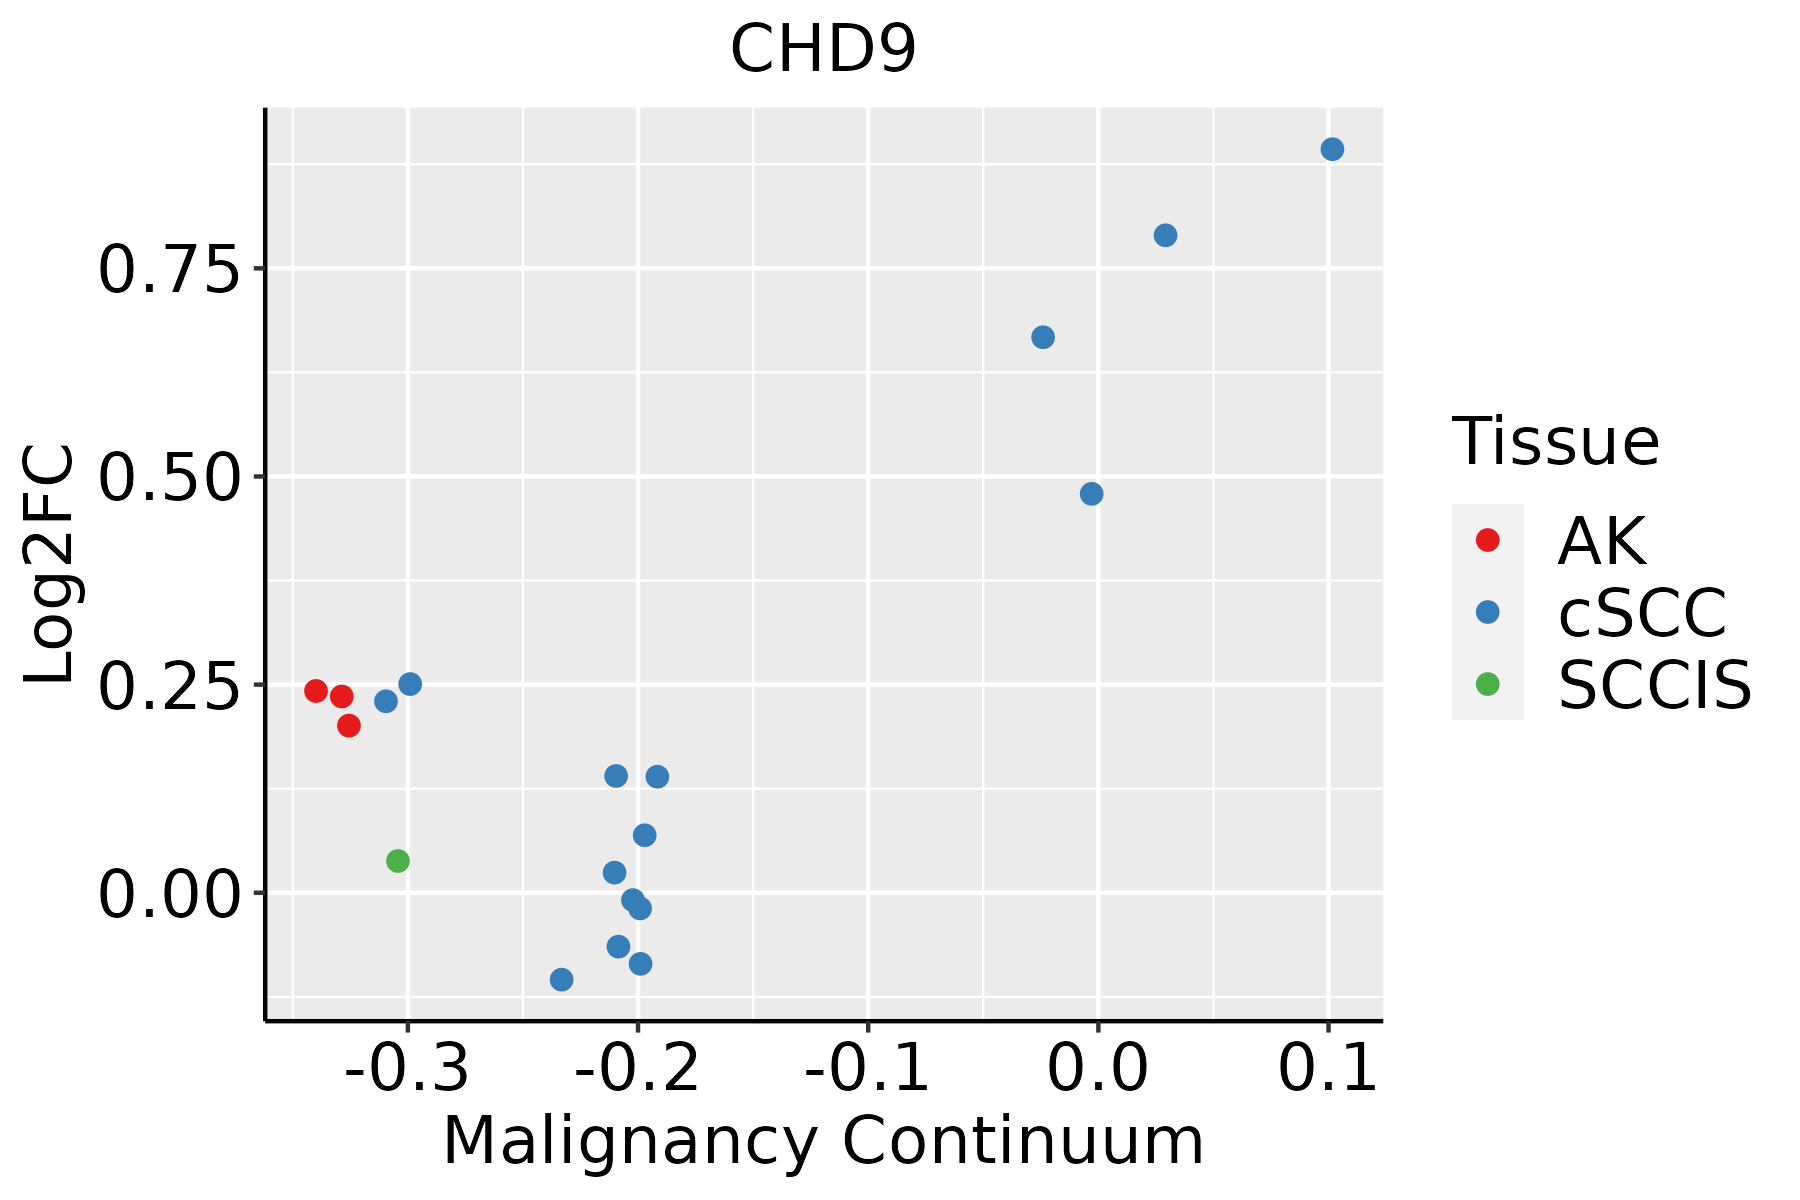 | AK: Actinic keratosis |
| cSCC: Cutaneous squamous cell carcinoma | ||
| SCCIS:squamous cell carcinoma in situ | ||
| Thyroid | 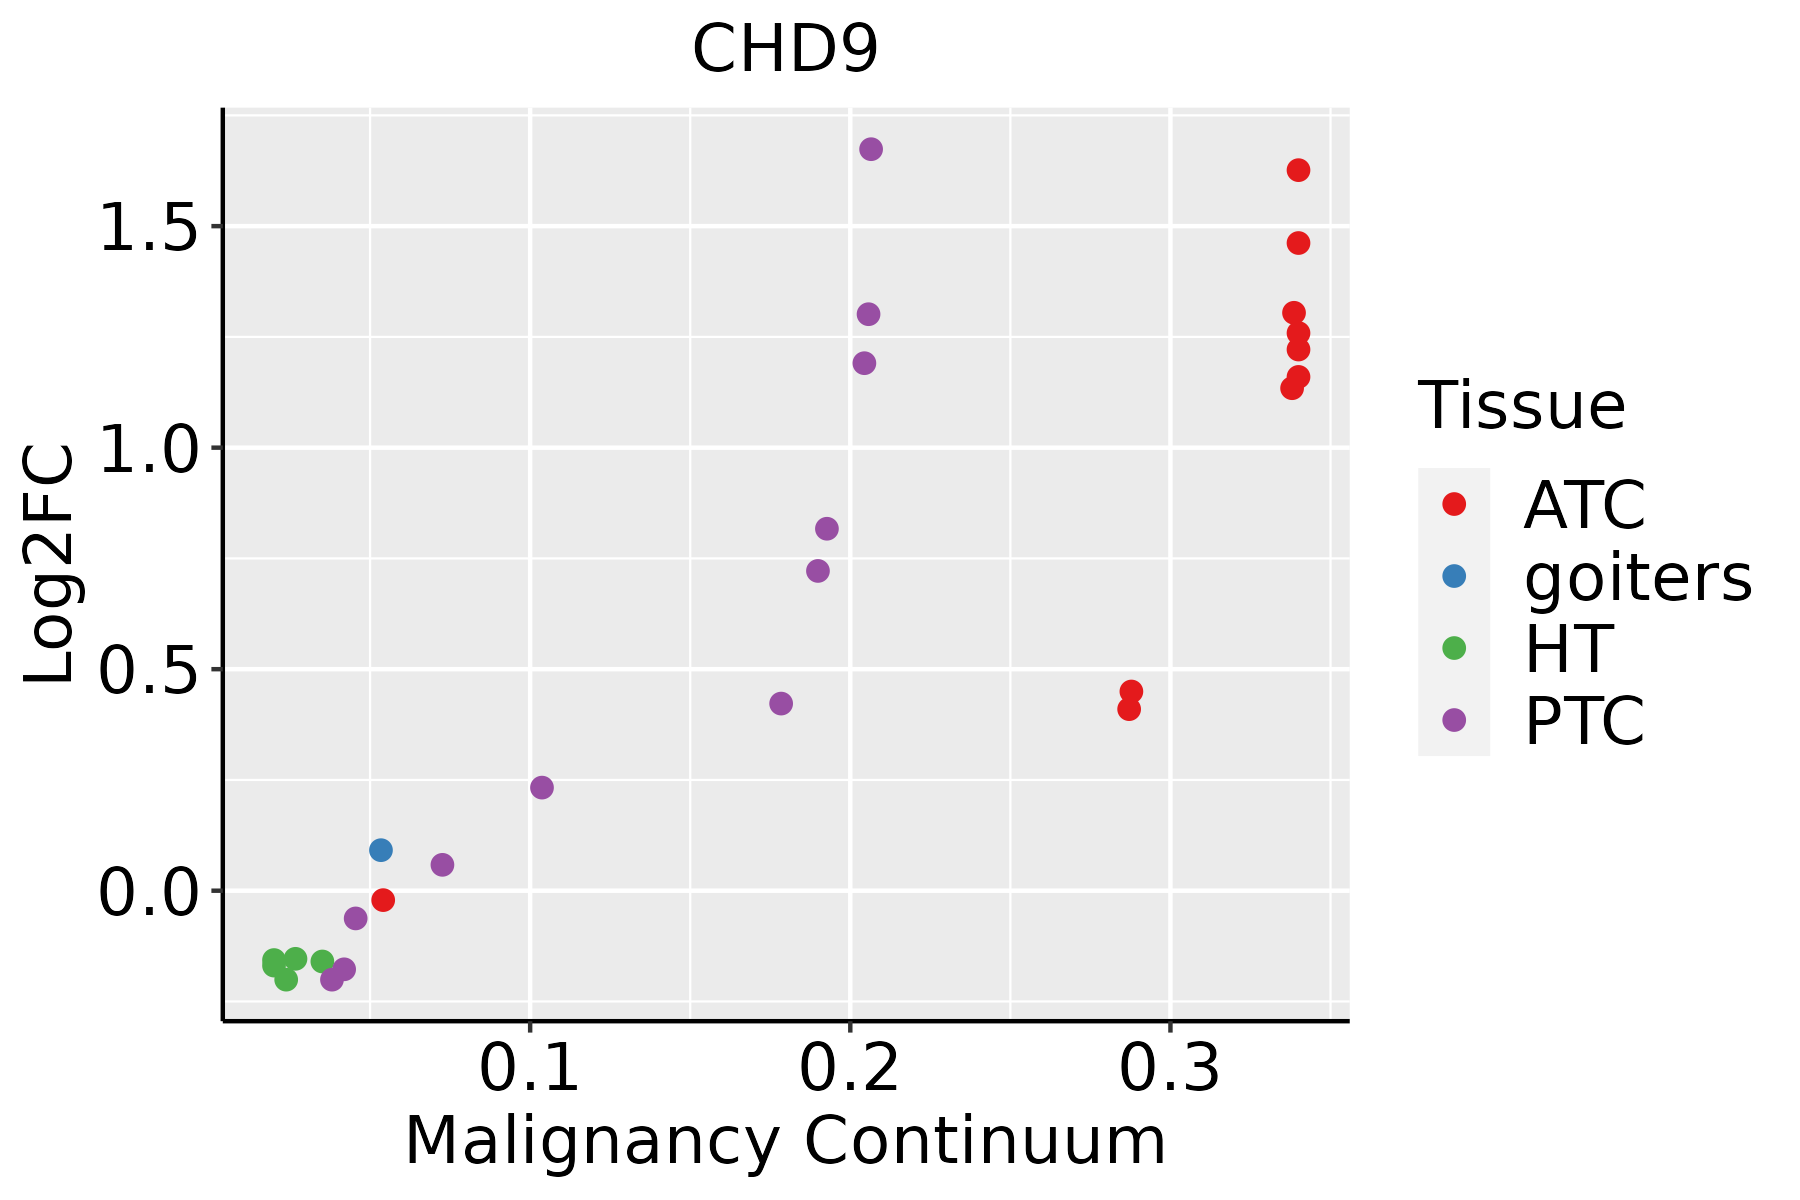 | ATC: Anaplastic thyroid cancer |
| HT: Hashimoto's thyroiditis | ||
| PTC: Papillary thyroid cancer |
| ∗log2FC in expression of this searched gene in stem-like cells from each diseased tissue sample relative to stem-like cells in normal samples in each tissue plotted against the malignancy continuum. Samples are colored based on if they are from different disease stage. |
Top |
Malignant transformation related pathway analysis |
| Find out the enriched GO biological processes and KEGG pathways involved in transition from healthy to precancer to cancer |
| Tissue | Disease Stage | Enriched GO biological Processes |
| Colorectum | AD |  |
| Colorectum | SER |  |
| Colorectum | MSS |  |
| Colorectum | MSI-H |  |
| Colorectum | FAP |  |
| ∗Top 15 enriched GO BP terms are showed in the bar plot of each disease state in each tissue. Each row represents a significant GO biological process which is colored according to the -log10(p.adjust). |
| Page: 1 2 3 4 5 6 7 8 9 |
| GO ID | Tissue | Disease Stage | Description | Gene Ratio | Bg Ratio | pvalue | p.adjust | Count |
| GO:00063257 | Cervix | CC | chromatin organization | 78/2311 | 409/18723 | 5.40e-05 | 8.02e-04 | 78 |
| GO:00323923 | Cervix | CC | DNA geometric change | 21/2311 | 90/18723 | 2.71e-03 | 1.85e-02 | 21 |
| GO:0006325 | Colorectum | AD | chromatin organization | 119/3918 | 409/18723 | 4.85e-05 | 8.33e-04 | 119 |
| GO:0032392 | Colorectum | AD | DNA geometric change | 31/3918 | 90/18723 | 2.02e-03 | 1.63e-02 | 31 |
| GO:00063251 | Colorectum | SER | chromatin organization | 89/2897 | 409/18723 | 4.15e-04 | 6.17e-03 | 89 |
| GO:00063252 | Colorectum | MSS | chromatin organization | 107/3467 | 409/18723 | 7.22e-05 | 1.21e-03 | 107 |
| GO:00323921 | Colorectum | MSS | DNA geometric change | 29/3467 | 90/18723 | 1.26e-03 | 1.20e-02 | 29 |
| GO:0032508 | Colorectum | MSS | DNA duplex unwinding | 25/3467 | 84/18723 | 8.27e-03 | 4.99e-02 | 25 |
| GO:00063253 | Colorectum | FAP | chromatin organization | 84/2622 | 409/18723 | 1.62e-04 | 2.47e-03 | 84 |
| GO:00063254 | Colorectum | CRC | chromatin organization | 74/2078 | 409/18723 | 1.48e-05 | 4.61e-04 | 74 |
| GO:000632516 | Esophagus | HGIN | chromatin organization | 92/2587 | 409/18723 | 1.05e-06 | 4.16e-05 | 92 |
| GO:00323926 | Esophagus | HGIN | DNA geometric change | 25/2587 | 90/18723 | 3.77e-04 | 5.85e-03 | 25 |
| GO:00325084 | Esophagus | HGIN | DNA duplex unwinding | 22/2587 | 84/18723 | 1.91e-03 | 2.03e-02 | 22 |
| GO:000632517 | Esophagus | ESCC | chromatin organization | 240/8552 | 409/18723 | 6.52e-08 | 1.14e-06 | 240 |
| GO:003239214 | Esophagus | ESCC | DNA geometric change | 62/8552 | 90/18723 | 7.02e-06 | 7.04e-05 | 62 |
| GO:003250813 | Esophagus | ESCC | DNA duplex unwinding | 58/8552 | 84/18723 | 1.23e-05 | 1.14e-04 | 58 |
| GO:00063255 | Liver | NAFLD | chromatin organization | 64/1882 | 409/18723 | 2.31e-04 | 3.89e-03 | 64 |
| GO:00323922 | Liver | NAFLD | DNA geometric change | 18/1882 | 90/18723 | 3.34e-03 | 2.93e-02 | 18 |
| GO:003239211 | Liver | HCC | DNA geometric change | 54/7958 | 90/18723 | 6.04e-04 | 3.79e-03 | 54 |
| GO:000632511 | Liver | HCC | chromatin organization | 206/7958 | 409/18723 | 7.23e-04 | 4.41e-03 | 206 |
| Page: 1 2 3 |
| Pathway ID | Tissue | Disease Stage | Description | Gene Ratio | Bg Ratio | pvalue | p.adjust | qvalue | Count |
| Page: 1 |
Top |
Cell-cell communication analysis |
| Identification of potential cell-cell interactions between two cell types and their ligand-receptor pairs for different disease states |
| Ligand | Receptor | LRpair | Pathway | Tissue | Disease Stage |
| Page: 1 |
Top |
Single-cell gene regulatory network inference analysis |
| Find out the significant the regulons (TFs) and the target genes of each regulon across cell types for different disease states |
| TF | Cell Type | Tissue | Disease Stage | Target Gene | RSS | Regulon Activity |
| ∗The dot plots of a searched regulon are shown for all cell subpopulations in each disease state of each tissue based on the regulon specific score inferred using pySCENIC and by calculating the average expression. |
| Page: 1 |
Top |
Somatic mutation of malignant transformation related genes |
| Annotation of somatic variants for genes involved in malignant transformation |
| Hugo Symbol | Variant Class | Variant Classification | dbSNP RS | HGVSc | HGVSp | HGVSp Short | SWISSPROT | BIOTYPE | SIFT | PolyPhen | Tumor Sample Barcode | Tissue | Histology | Sex | Age | Stage | Therapy Types | Drugs | Outcome |
| CHD9 | SNV | Missense_Mutation | novel | c.2545N>C | p.Asp849His | p.D849H | Q3L8U1 | protein_coding | deleterious(0) | benign(0.092) | TCGA-5L-AAT0-01 | Breast | breast invasive carcinoma | Female | <65 | I/II | Hormone Therapy | tamoxiphen | SD |
| CHD9 | SNV | Missense_Mutation | c.226T>G | p.Ser76Ala | p.S76A | Q3L8U1 | protein_coding | deleterious_low_confidence(0.02) | benign(0.01) | TCGA-A2-A04V-01 | Breast | breast invasive carcinoma | Female | <65 | I/II | Chemotherapy | cytoxan | PD | |
| CHD9 | SNV | Missense_Mutation | c.3223A>C | p.Lys1075Gln | p.K1075Q | Q3L8U1 | protein_coding | deleterious(0) | probably_damaging(0.998) | TCGA-A8-A09A-01 | Breast | breast invasive carcinoma | Female | <65 | I/II | Hormone Therapy | tamoxiphen | SD | |
| CHD9 | SNV | Missense_Mutation | c.7360N>T | p.His2454Tyr | p.H2454Y | Q3L8U1 | protein_coding | deleterious(0) | probably_damaging(0.921) | TCGA-AC-A23H-01 | Breast | breast invasive carcinoma | Female | >=65 | I/II | Unknown | Unknown | PD | |
| CHD9 | SNV | Missense_Mutation | c.575C>A | p.Ser192Tyr | p.S192Y | Q3L8U1 | protein_coding | deleterious_low_confidence(0.01) | benign(0.259) | TCGA-AN-A046-01 | Breast | breast invasive carcinoma | Female | >=65 | I/II | Unknown | Unknown | SD | |
| CHD9 | SNV | Missense_Mutation | c.3956G>A | p.Arg1319Gln | p.R1319Q | Q3L8U1 | protein_coding | deleterious(0) | possibly_damaging(0.629) | TCGA-AN-A046-01 | Breast | breast invasive carcinoma | Female | >=65 | I/II | Unknown | Unknown | SD | |
| CHD9 | SNV | Missense_Mutation | rs749086728 | c.4234N>T | p.Arg1412Trp | p.R1412W | Q3L8U1 | protein_coding | deleterious(0) | probably_damaging(0.99) | TCGA-AN-A0AK-01 | Breast | breast invasive carcinoma | Female | >=65 | I/II | Unknown | Unknown | SD |
| CHD9 | SNV | Missense_Mutation | c.944N>C | p.Arg315Thr | p.R315T | Q3L8U1 | protein_coding | tolerated_low_confidence(0.78) | benign(0) | TCGA-AN-A0XW-01 | Breast | breast invasive carcinoma | Female | <65 | III/IV | Unknown | Unknown | SD | |
| CHD9 | SNV | Missense_Mutation | c.1162N>C | p.Glu388Gln | p.E388Q | Q3L8U1 | protein_coding | deleterious_low_confidence(0.02) | benign(0.094) | TCGA-AN-A0XW-01 | Breast | breast invasive carcinoma | Female | <65 | III/IV | Unknown | Unknown | SD | |
| CHD9 | SNV | Missense_Mutation | c.1288N>G | p.His430Asp | p.H430D | Q3L8U1 | protein_coding | tolerated_low_confidence(0.14) | benign(0.027) | TCGA-AO-A0JD-01 | Breast | breast invasive carcinoma | Female | <65 | III/IV | Chemotherapy | cyclophosphamide | SD |
| Page: 1 2 3 4 5 6 7 8 9 10 11 12 13 14 15 16 17 18 19 20 21 22 23 24 25 26 27 28 |
Top |
Related drugs of malignant transformation related genes |
| Identification of chemicals and drugs interact with genes involved in malignant transfromation |
| (DGIdb 4.0) |
| Entrez ID | Symbol | Category | Interaction Types | Drug Claim Name | Drug Name | PMIDs |
| Page: 1 |

Copyright 2023-Present -The University of Texas Health Science Center at Houston |