Schematic overview of the cellular and molecular mechanisms involved in the cancer progression, including the proposed cellular and molecular mechanisms in cancer cells trajectory. AT1: alveolar type 1 cells; AT2: alveolar type 2 cells; AAH: atypical adenomatous hyperplasia; AIS: adenocarcinoma in situ; MIA: minimally invasive adenocarcinoma; IA: invasive adenocarcinoma; EMT: epithelial-mesenchymal transition

Home

Download

Statistics

Help

Contact

Center for Computational Systems Medicine
leaf

Gene summary

leaf

Malignant transformation analysis

leaf

Malignant transformation related pathway analysis

leaf

Cell-cell communication analysis

leaf

Single-cell gene regulatory network inference analysis

leaf

Somatic mutation of malignant transformation related genes

leaf

Related drugs of malignant transformation related genes

Gene: CHD6

Gene summary for CHD6

check button Gene summary.

Gene informationSpeciesHuman
Gene symbol

CHD6

Gene ID

84181

Gene namechromodomain helicase DNA binding protein 6
Gene AliasCHD-6
Cytomap20q12
Gene Typeprotein-coding
GO ID

GO:0006139

UniProtAcc

Q8TD26


Top

Malignant transformation analysis

check button Identification of the aberrant gene expression in precancerous and cancerous lesions by comparing the gene expression of stem-like cells in diseased tissues with normal stem cells
check button Malignant transformation involving gene list.
Entrez IDSymbolReplicatesSpeciesOrganTissueAdj P-valueLog2FCMalignancy
84181CHD6CCI_2HumanCervixCC9.21e-067.69e-010.5249
84181CHD6CCI_3HumanCervixCC6.08e-098.50e-010.516
84181CHD6HTA11_3410_2000001011HumanColorectumAD2.16e-20-5.75e-010.0155
84181CHD6HTA11_2487_2000001011HumanColorectumSER9.33e-09-5.94e-01-0.1808
84181CHD6HTA11_1938_2000001011HumanColorectumAD2.10e-05-4.86e-01-0.0811
84181CHD6HTA11_78_2000001011HumanColorectumAD3.23e-04-4.09e-01-0.1088
84181CHD6HTA11_2112_2000001011HumanColorectumSER2.13e-02-7.17e-01-0.2196
84181CHD6HTA11_3361_2000001011HumanColorectumAD5.64e-07-5.59e-01-0.1207
84181CHD6HTA11_83_2000001011HumanColorectumSER9.12e-07-5.95e-01-0.1526
84181CHD6HTA11_696_2000001011HumanColorectumAD4.00e-06-4.11e-01-0.1464
84181CHD6HTA11_866_2000001011HumanColorectumAD3.77e-07-4.39e-01-0.1001
84181CHD6HTA11_1391_2000001011HumanColorectumAD5.35e-05-4.01e-01-0.059
84181CHD6HTA11_5212_2000001011HumanColorectumAD2.20e-04-6.79e-01-0.2061
84181CHD6HTA11_7862_2000001011HumanColorectumAD1.36e-02-5.56e-01-0.0179
84181CHD6HTA11_866_3004761011HumanColorectumAD3.51e-05-4.02e-010.096
84181CHD6HTA11_8622_2000001021HumanColorectumSER1.85e-03-5.00e-010.0528
84181CHD6HTA11_10623_2000001011HumanColorectumAD2.61e-03-5.27e-01-0.0177
84181CHD6HTA11_10711_2000001011HumanColorectumAD7.12e-07-3.90e-010.0338
84181CHD6HTA11_7696_3000711011HumanColorectumAD3.75e-14-5.08e-010.0674
84181CHD6HTA11_99999970781_79442HumanColorectumMSS1.02e-05-3.59e-010.294
Page: 1 2 3 4 5 6 7 8 9 10 11 

check button Transcriptomic changes along malignancy continuum.
TissueExpression DynamicsAbbreviation
CervixThe image shows the transcriptomic changes along malignancy continuum.log2FC in expression of this searched gene in stem-like cells from each diseased tissue sample relative to stem-like cells in normal samples in each tissue plotted against the malignancy continuum. Samples are colored based on if they are from different disease stage.CC: Cervix cancer
HSIL_HPV: HPV-infected high-grade squamous intraepithelial lesions
N_HPV: HPV-infected normal cervix
Colorectum (GSE201348)The image shows the transcriptomic changes along malignancy continuum.log2FC in expression of this searched gene in stem-like cells from each diseased tissue sample relative to stem-like cells in normal samples in each tissue plotted against the malignancy continuum. Samples are colored based on if they are from different disease stage.FAP: Familial adenomatous polyposis
CRC: Colorectal cancer
Colorectum (HTA11)The image shows the transcriptomic changes along malignancy continuum.log2FC in expression of this searched gene in stem-like cells from each diseased tissue sample relative to stem-like cells in normal samples in each tissue plotted against the malignancy continuum. Samples are colored based on if they are from different disease stage.AD: Adenomas
SER: Sessile serrated lesions
MSI-H: Microsatellite-high colorectal cancer
MSS: Microsatellite stable colorectal cancer
EndometriumThe image shows the transcriptomic changes along malignancy continuum.log2FC in expression of this searched gene in stem-like cells from each diseased tissue sample relative to stem-like cells in normal samples in each tissue plotted against the malignancy continuum. Samples are colored based on if they are from different disease stage.AEH: Atypical endometrial hyperplasia
EEC: Endometrioid Cancer
EsophagusThe image shows the transcriptomic changes along malignancy continuum.log2FC in expression of this searched gene in stem-like cells from each diseased tissue sample relative to stem-like cells in normal samples in each tissue plotted against the malignancy continuum. Samples are colored based on if they are from different disease stage.
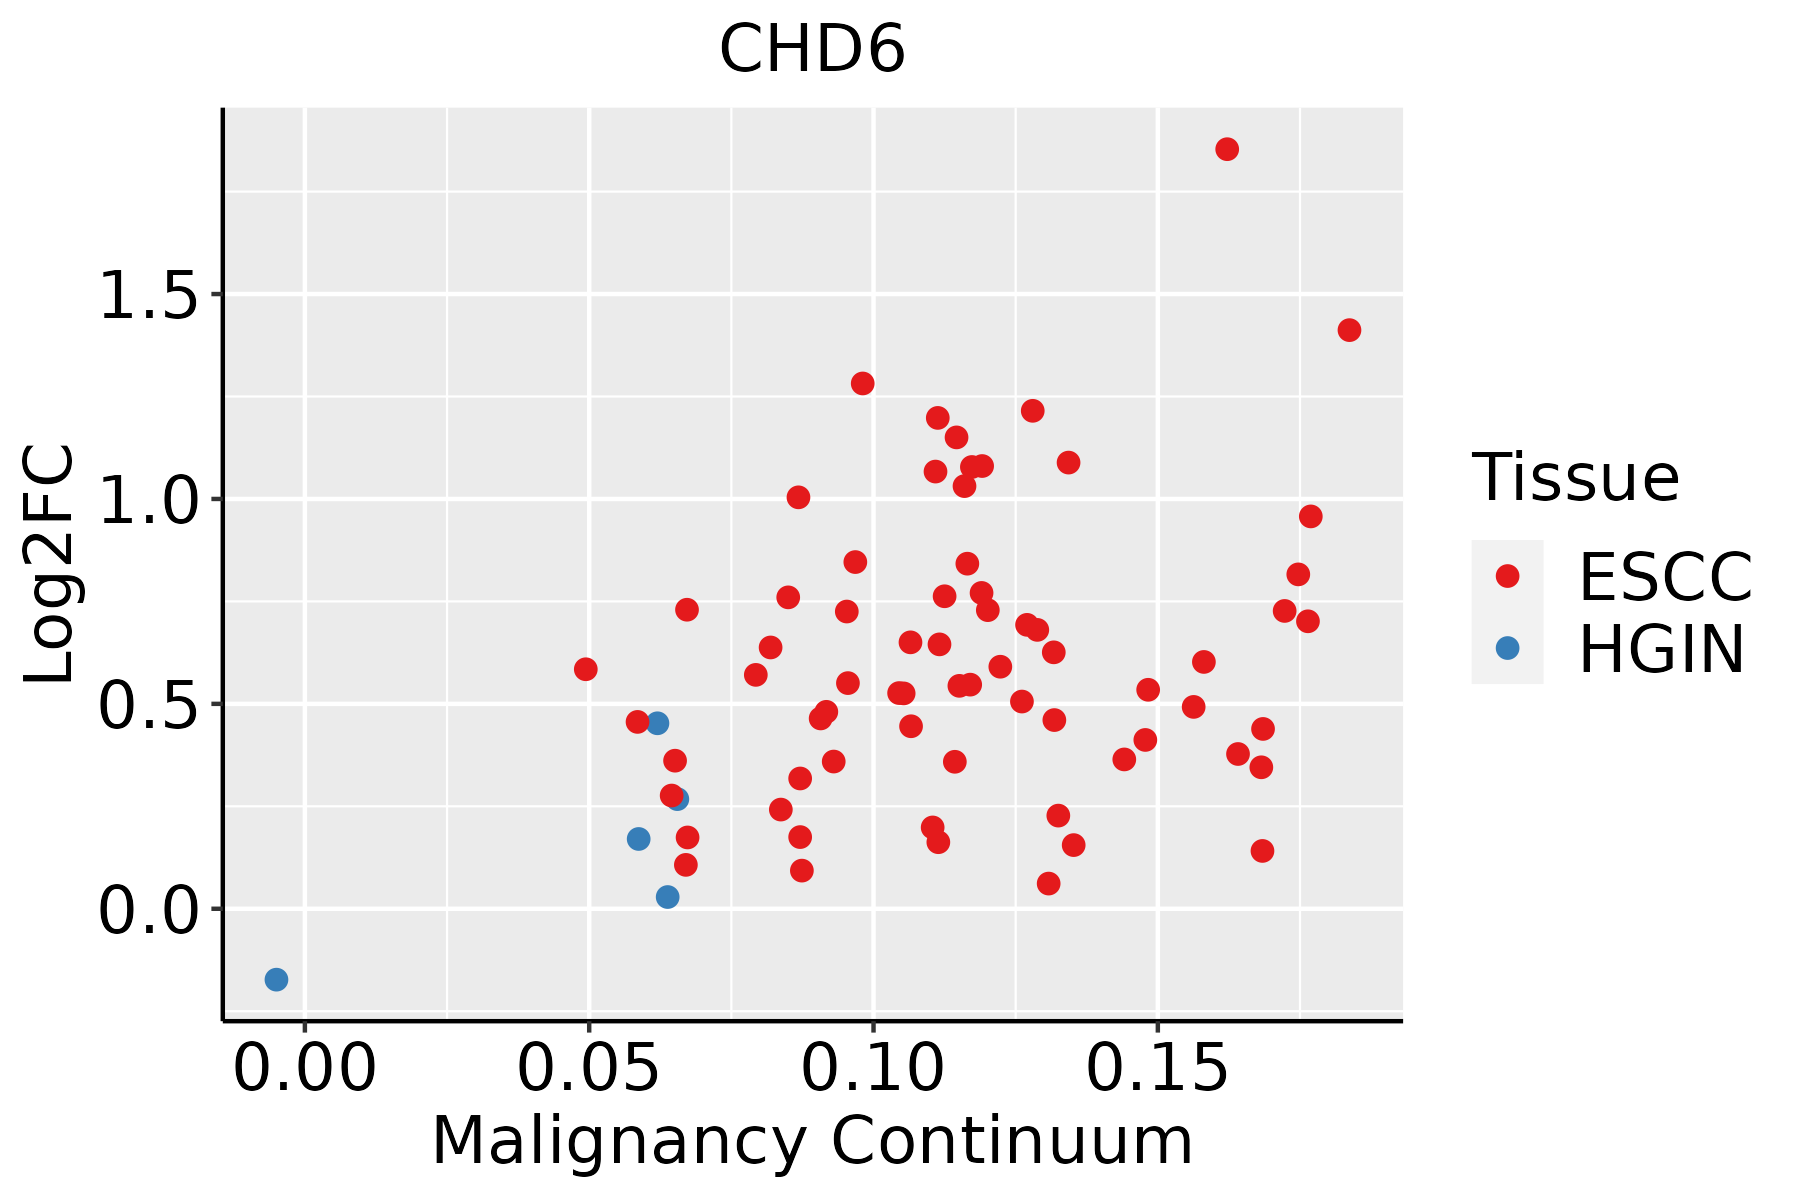
ESCC: Esophageal squamous cell carcinoma
HGIN: High-grade intraepithelial neoplasias
LGIN: Low-grade intraepithelial neoplasias
LiverThe image shows the transcriptomic changes along malignancy continuum.log2FC in expression of this searched gene in stem-like cells from each diseased tissue sample relative to stem-like cells in normal samples in each tissue plotted against the malignancy continuum. Samples are colored based on if they are from different disease stage.HCC: Hepatocellular carcinoma
NAFLD: Non-alcoholic fatty liver disease
LungThe image shows the transcriptomic changes along malignancy continuum.log2FC in expression of this searched gene in stem-like cells from each diseased tissue sample relative to stem-like cells in normal samples in each tissue plotted against the malignancy continuum. Samples are colored based on if they are from different disease stage.
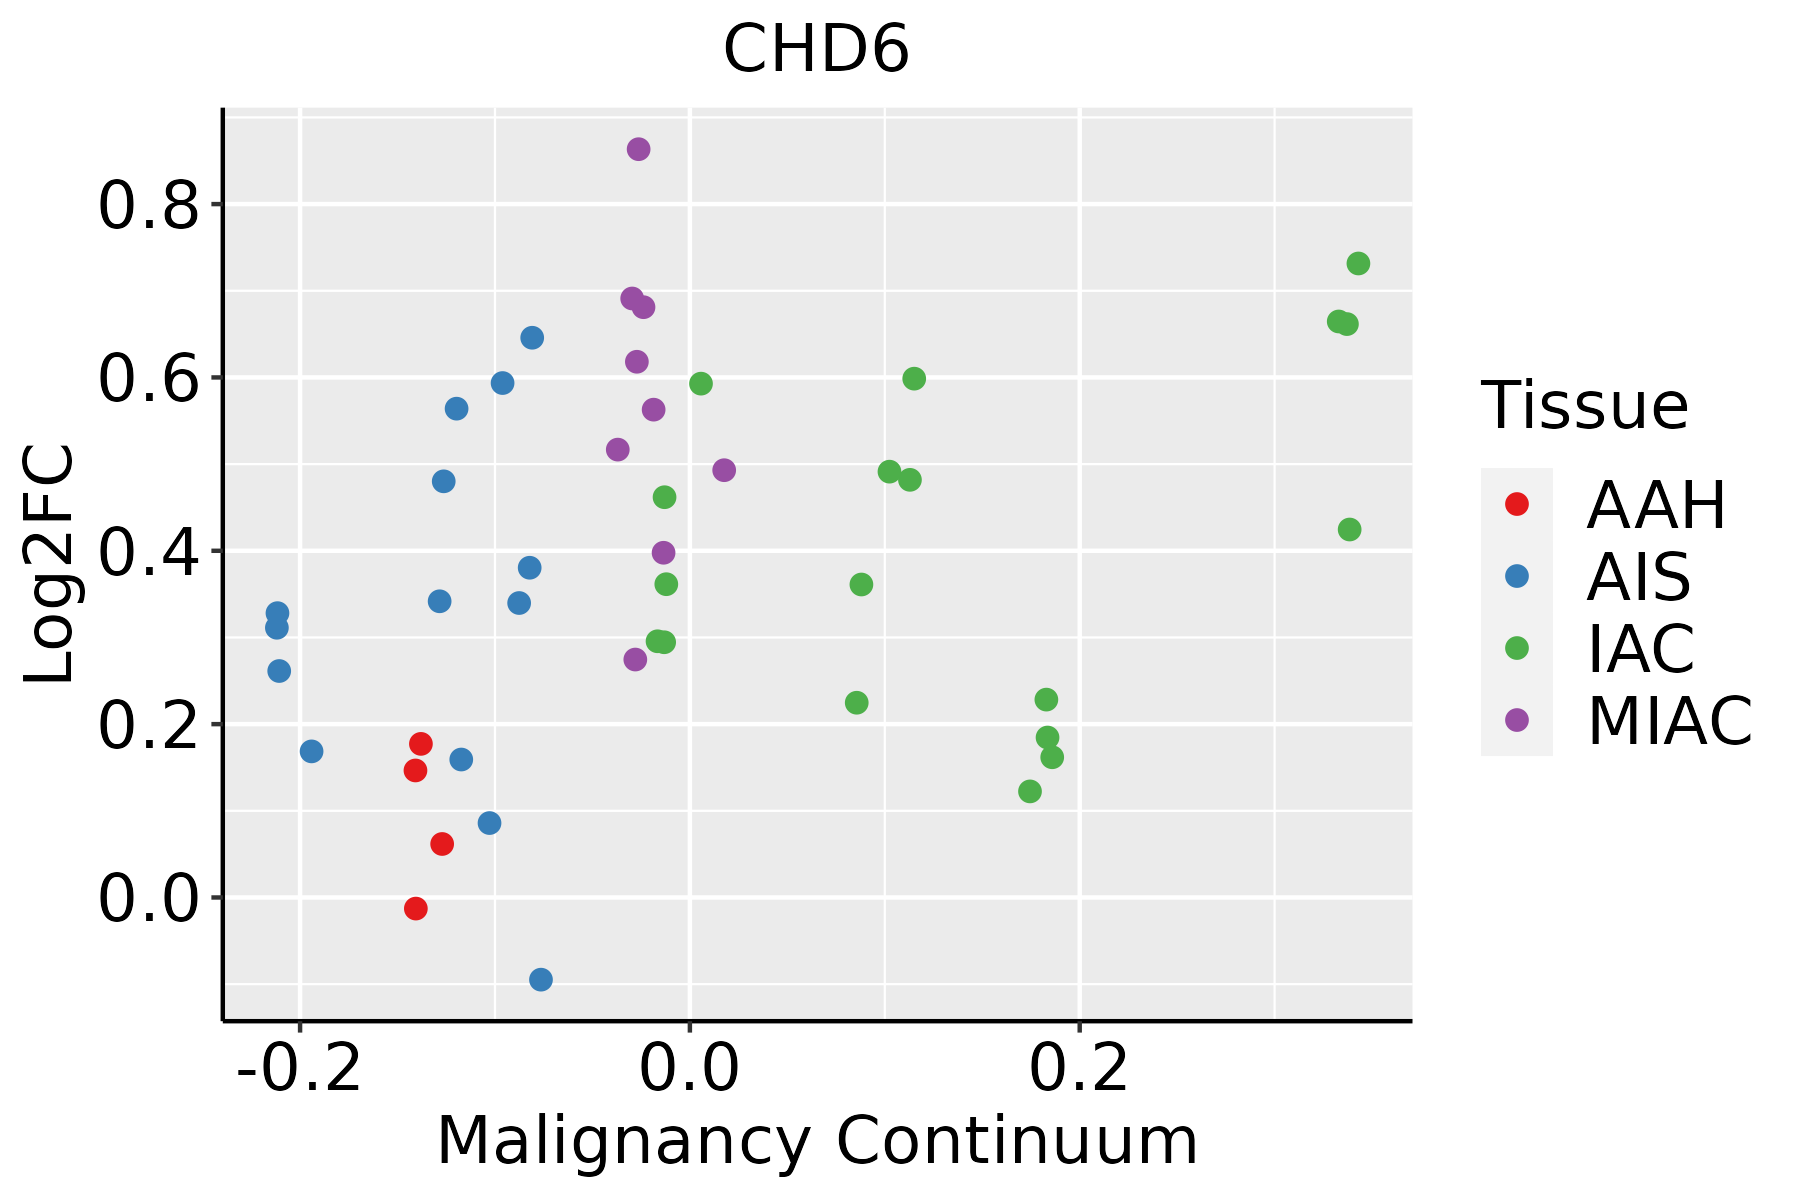
AAH: Atypical adenomatous hyperplasia
AIS: Adenocarcinoma in situ
IAC: Invasive lung adenocarcinoma
MIA: Minimally invasive adenocarcinoma
Oral CavityThe image shows the transcriptomic changes along malignancy continuum.log2FC in expression of this searched gene in stem-like cells from each diseased tissue sample relative to stem-like cells in normal samples in each tissue plotted against the malignancy continuum. Samples are colored based on if they are from different disease stage.
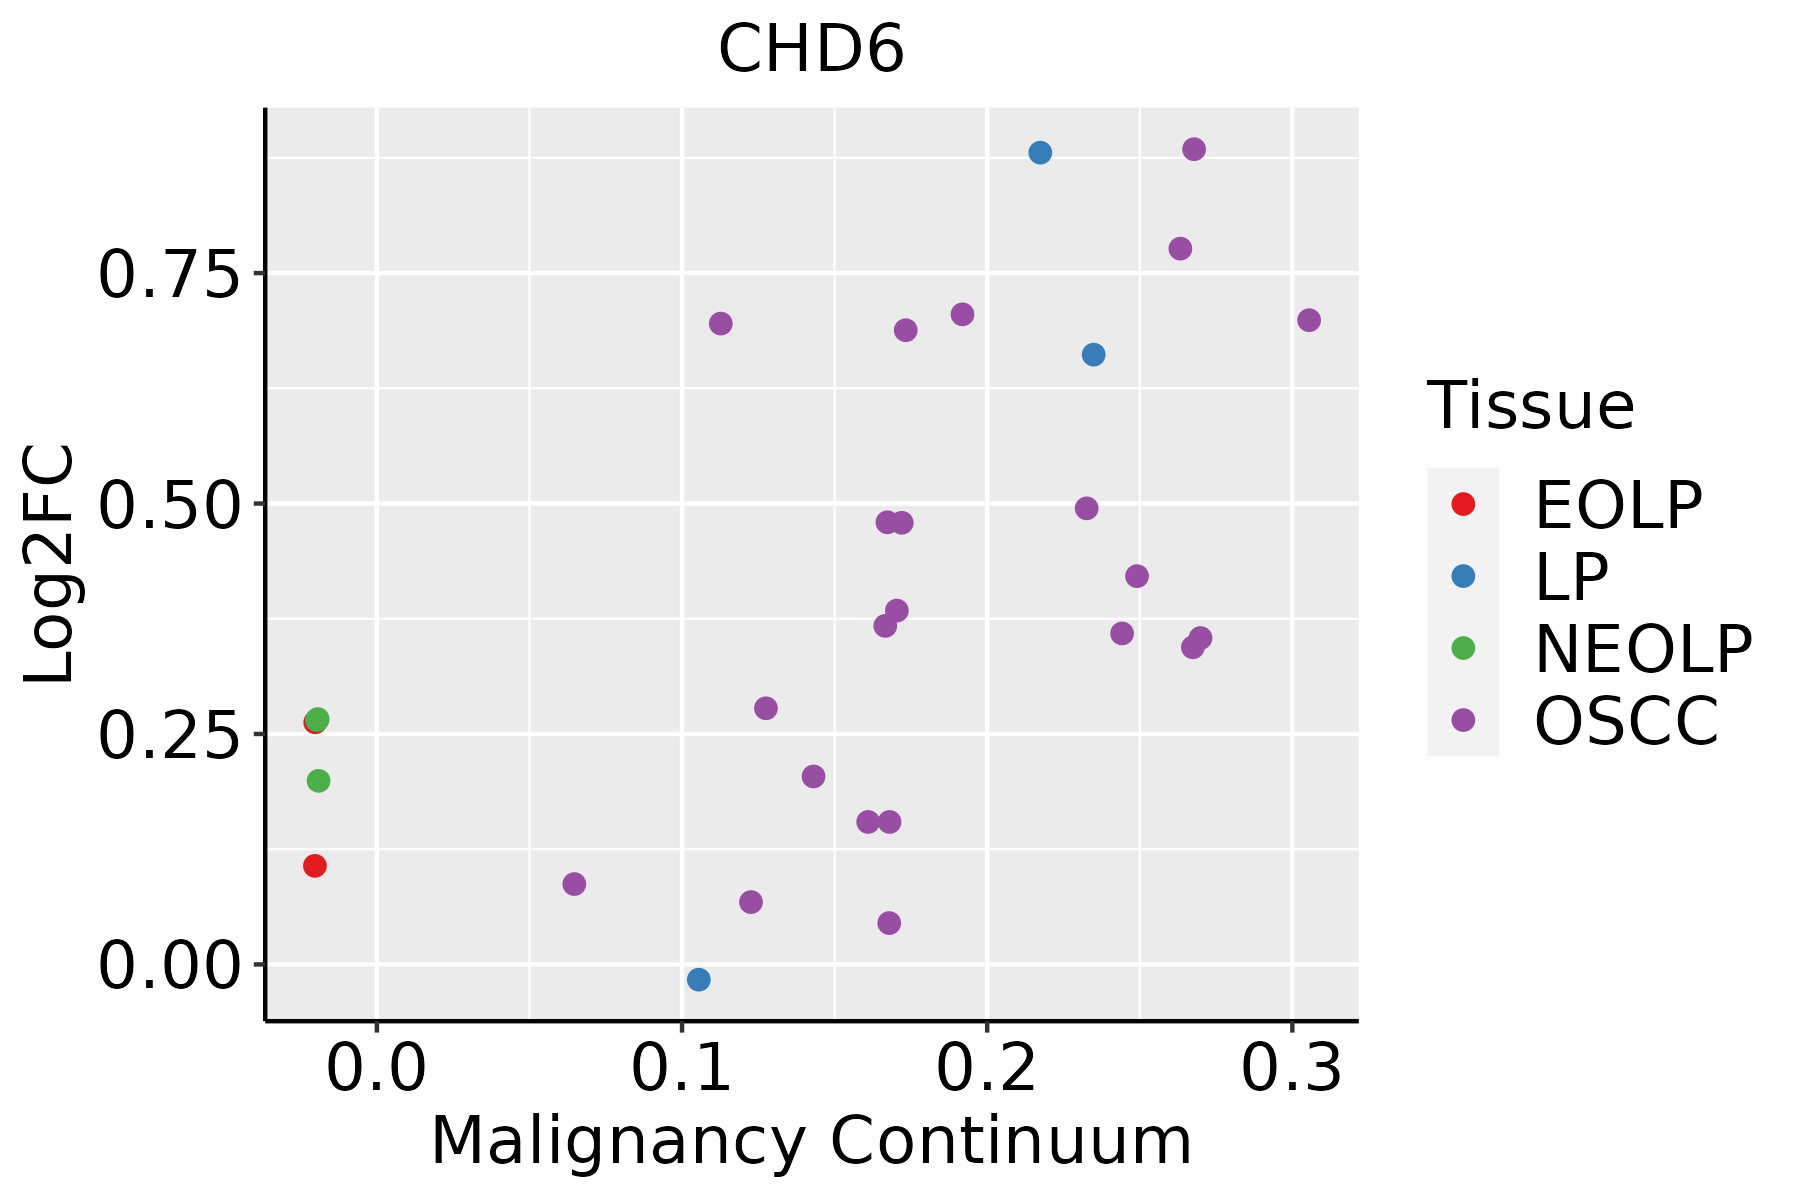
EOLP: Erosive Oral lichen planus
LP: leukoplakia
NEOLP: Non-erosive oral lichen planus
OSCC: Oral squamous cell carcinoma
ProstateThe image shows the transcriptomic changes along malignancy continuum.log2FC in expression of this searched gene in stem-like cells from each diseased tissue sample relative to stem-like cells in normal samples in each tissue plotted against the malignancy continuum. Samples are colored based on if they are from different disease stage.BPH: Benign Prostatic Hyperplasia
ThyroidThe image shows the transcriptomic changes along malignancy continuum.log2FC in expression of this searched gene in stem-like cells from each diseased tissue sample relative to stem-like cells in normal samples in each tissue plotted against the malignancy continuum. Samples are colored based on if they are from different disease stage.
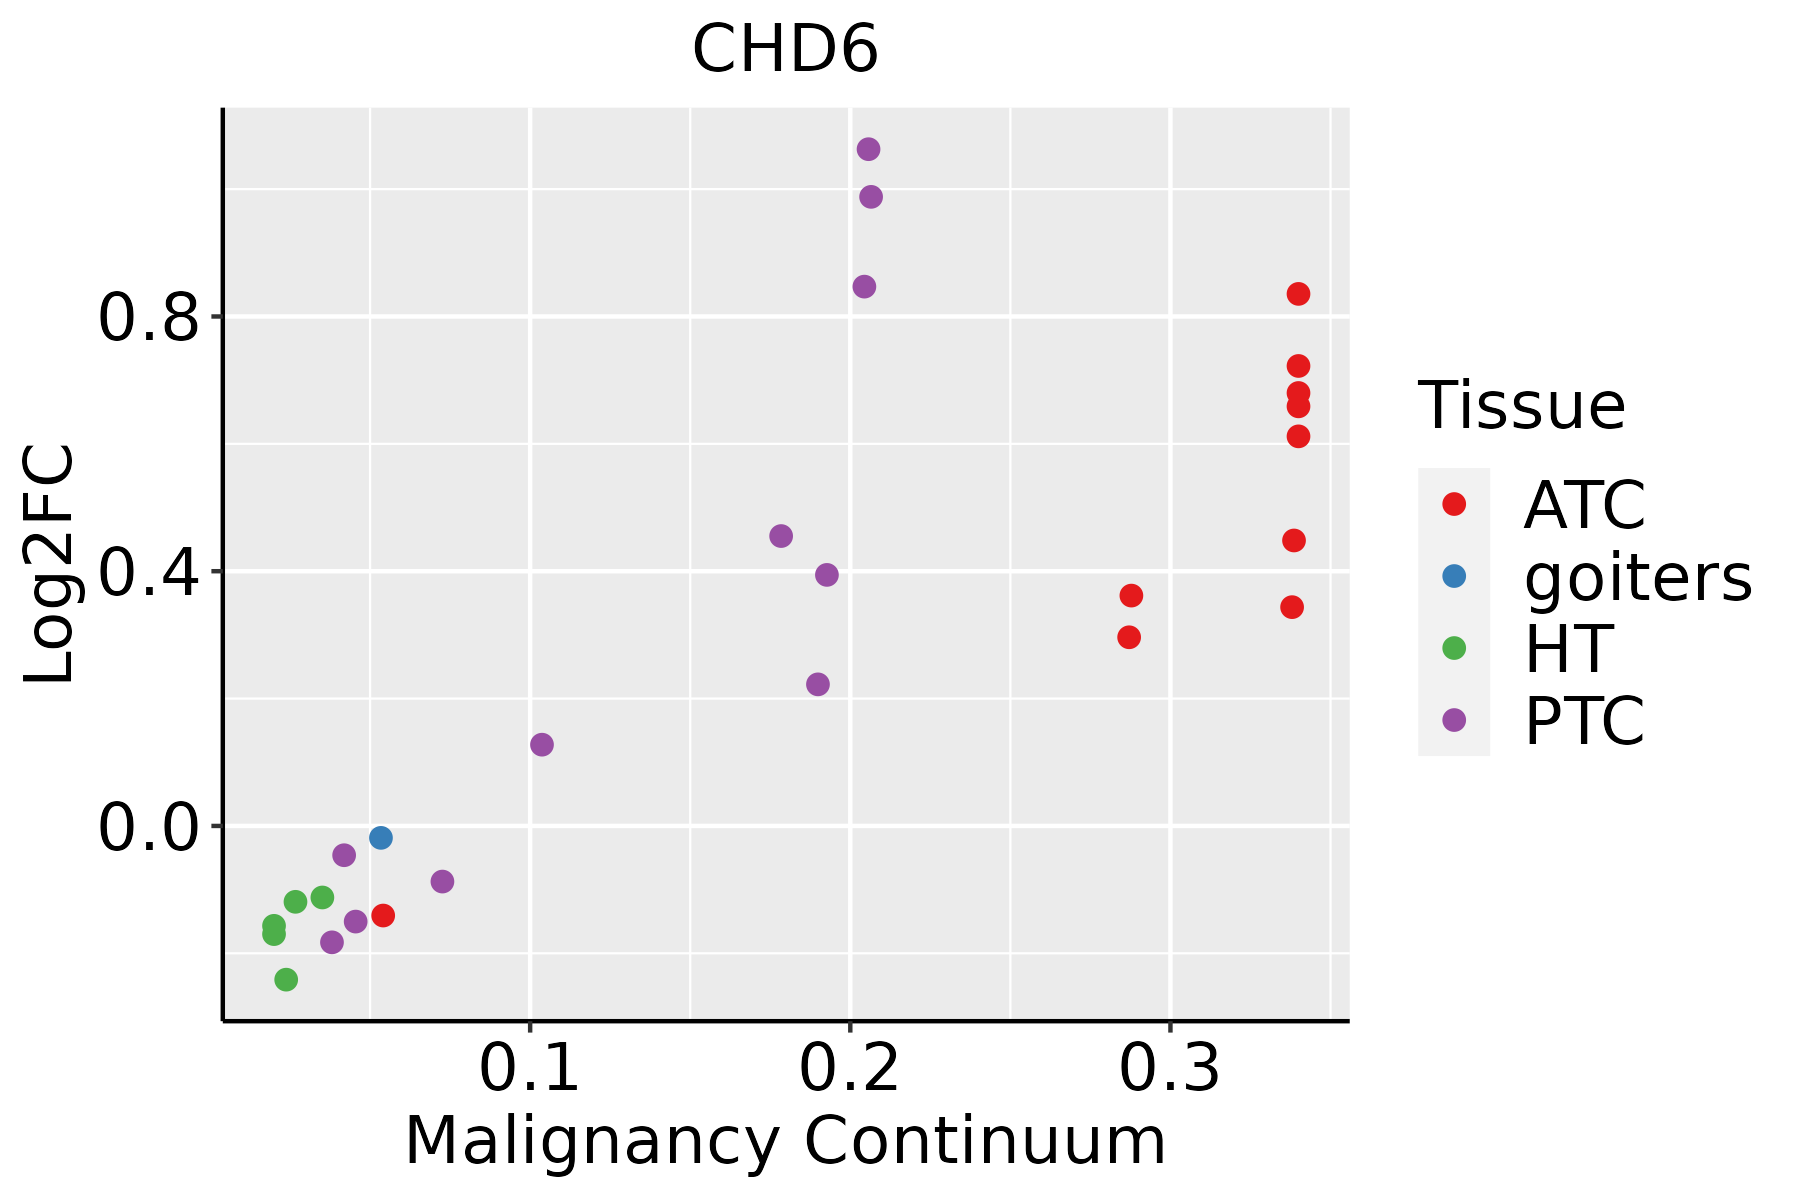
ATC: Anaplastic thyroid cancer
HT: Hashimoto's thyroiditis
PTC: Papillary thyroid cancer
∗log2FC in expression of this searched gene in stem-like cells from each diseased tissue sample relative to stem-like cells in normal samples in each tissue plotted against the malignancy continuum. Samples are colored based on if they are from different disease stage.

Top

Malignant transformation related pathway analysis

check buttonFind out the enriched GO biological processes and KEGG pathways involved in transition from healthy to precancer to cancer
check button Figure of enriched GO biological processes.
TissueDisease StageEnriched GO biological Processes
ColorectumADGO analysis - Figure of enriched GO biological processes: Top 15 enriched GO BP terms are showed in the bar plot of each disease state in each tissue. Each row represents a significant GO biological process which is colored according to the -log10(p.adjust).
ColorectumSERGO analysis - Figure of enriched GO biological processes: Top 15 enriched GO BP terms are showed in the bar plot of each disease state in each tissue. Each row represents a significant GO biological process which is colored according to the -log10(p.adjust).
ColorectumMSSGO analysis - Figure of enriched GO biological processes: Top 15 enriched GO BP terms are showed in the bar plot of each disease state in each tissue. Each row represents a significant GO biological process which is colored according to the -log10(p.adjust).
ColorectumMSI-HGO analysis - Figure of enriched GO biological processes: Top 15 enriched GO BP terms are showed in the bar plot of each disease state in each tissue. Each row represents a significant GO biological process which is colored according to the -log10(p.adjust).
ColorectumFAPGO analysis - Figure of enriched GO biological processes: Top 15 enriched GO BP terms are showed in the bar plot of each disease state in each tissue. Each row represents a significant GO biological process which is colored according to the -log10(p.adjust).
∗Top 15 enriched GO BP terms are showed in the bar plot of each disease state in each tissue. Each row represents a significant GO biological process which is colored according to the -log10(p.adjust).
Page: 1 2 3 4 5 6 7 8 9 

check button Enriched GO biological processes.
GO IDTissueDisease StageDescriptionGene RatioBg Ratiopvaluep.adjustCount
GO:000697910CervixCCresponse to oxidative stress102/2311446/187232.99e-104.36e-08102
GO:004361810CervixCCregulation of transcription from RNA polymerase II promoter in response to stress21/231147/187233.85e-082.53e-0621
GO:004362010CervixCCregulation of DNA-templated transcription in response to stress22/231153/187239.29e-085.19e-0622
GO:006219710CervixCCcellular response to chemical stress76/2311337/187231.01e-075.25e-0676
GO:003459910CervixCCcellular response to oxidative stress63/2311288/187233.58e-069.50e-0563
GO:00063257CervixCCchromatin organization78/2311409/187235.40e-058.02e-0478
GO:00360038CervixCCpositive regulation of transcription from RNA polymerase II promoter in response to stress10/231124/187233.05e-043.26e-0310
GO:00323923CervixCCDNA geometric change21/231190/187232.71e-031.85e-0221
GO:0006979ColorectumADresponse to oxidative stress145/3918446/187235.16e-093.23e-07145
GO:0062197ColorectumADcellular response to chemical stress109/3918337/187235.33e-071.95e-05109
GO:0034599ColorectumADcellular response to oxidative stress94/3918288/187232.03e-066.02e-0594
GO:0006325ColorectumADchromatin organization119/3918409/187234.85e-058.33e-04119
GO:0043620ColorectumADregulation of DNA-templated transcription in response to stress23/391853/187231.86e-042.49e-0323
GO:0036003ColorectumADpositive regulation of transcription from RNA polymerase II promoter in response to stress13/391824/187233.45e-044.03e-0313
GO:0043618ColorectumADregulation of transcription from RNA polymerase II promoter in response to stress20/391847/187236.54e-046.75e-0320
GO:0032392ColorectumADDNA geometric change31/391890/187232.02e-031.63e-0231
GO:0043619ColorectumADregulation of transcription from RNA polymerase II promoter in response to oxidative stress7/391811/187232.59e-031.96e-027
GO:00069791ColorectumSERresponse to oxidative stress114/2897446/187231.75e-081.28e-06114
GO:00621971ColorectumSERcellular response to chemical stress87/2897337/187235.33e-072.59e-0587
GO:00345991ColorectumSERcellular response to oxidative stress73/2897288/187238.52e-062.86e-0473
Page: 1 2 3 4 5 6 7 8 9 10 

check button Enriched KEGG pathways.
Pathway IDTissueDisease StageDescriptionGene RatioBg Ratiopvaluep.adjustqvalueCount
Page: 1 

Top

Cell-cell communication analysis

check buttonIdentification of potential cell-cell interactions between two cell types and their ligand-receptor pairs for different disease states
LigandReceptorLRpairPathwayTissueDisease Stage
Page: 1 

Top

Single-cell gene regulatory network inference analysis

check buttonFind out the significant the regulons (TFs) and the target genes of each regulon across cell types for different disease states
TFCell TypeTissueDisease StageTarget GeneRSSRegulon Activity
∗The dot plots of a searched regulon are shown for all cell subpopulations in each disease state of each tissue based on the regulon specific score inferred using pySCENIC and by calculating the average expression.
Page: 1 

Top

Somatic mutation of malignant transformation related genes

check buttonAnnotation of somatic variants for genes involved in malignant transformation
Hugo SymbolVariant ClassVariant ClassificationdbSNP RSHGVScHGVSpHGVSp ShortSWISSPROTBIOTYPESIFTPolyPhenTumor Sample BarcodeTissueHistologySexAgeStageTherapy TypesDrugsOutcome
CHD6SNVMissense_Mutationc.8011N>Gp.Pro2671Alap.P2671AQ8TD26protein_codingtolerated_low_confidence(0.15)benign(0.039)TCGA-A1-A0SO-01Breastbreast invasive carcinomaFemale>=65I/IIChemotherapySD
CHD6SNVMissense_Mutationnovelc.7042C>Ap.Gln2348Lysp.Q2348KQ8TD26protein_codingtolerated(0.18)benign(0.014)TCGA-A2-A04X-01Breastbreast invasive carcinomaFemale<65I/IIChemotherapyadriamycinSD
CHD6SNVMissense_Mutationc.4811N>Gp.Pro1604Argp.P1604RQ8TD26protein_codingdeleterious(0)probably_damaging(0.989)TCGA-A7-A0CD-01Breastbreast invasive carcinomaFemale>=65I/IIHormone TherapyarimidexSD
CHD6SNVMissense_Mutationc.402G>Tp.Lys134Asnp.K134NQ8TD26protein_codingtolerated(0.31)possibly_damaging(0.462)TCGA-A7-A0CJ-01Breastbreast invasive carcinomaFemale<65I/IIChemotherapycytoxanSD
CHD6SNVMissense_Mutationnovelc.7034N>Gp.Ala2345Glyp.A2345GQ8TD26protein_codingtolerated(0.17)benign(0.049)TCGA-A8-A095-01Breastbreast invasive carcinomaFemale<65I/IIChemotherapy5-fluorouracilCR
CHD6SNVMissense_Mutationc.1159A>Gp.Lys387Glup.K387EQ8TD26protein_codingtolerated(0.56)benign(0.055)TCGA-AC-A23H-01Breastbreast invasive carcinomaFemale>=65I/IIUnknownUnknownPD
CHD6SNVMissense_Mutationnovelc.6412N>Cp.Thr2138Prop.T2138PQ8TD26protein_codingtolerated(0.13)benign(0.017)TCGA-AR-A1AP-01Breastbreast invasive carcinomaFemale>=65I/IIHormone TherapyanastrozoleSD
CHD6SNVMissense_Mutationnovelc.5231A>Cp.Asn1744Thrp.N1744TQ8TD26protein_codingdeleterious_low_confidence(0.01)benign(0.01)TCGA-BH-A0BG-01Breastbreast invasive carcinomaFemale>=65I/IIUnknownUnknownSD
CHD6SNVMissense_Mutationnovelc.6412N>Cp.Thr2138Prop.T2138PQ8TD26protein_codingtolerated(0.13)benign(0.017)TCGA-BH-A0BR-01Breastbreast invasive carcinomaFemale<65I/IIUnknownUnknownSD
CHD6SNVMissense_Mutationc.11N>Cp.Lys4Thrp.K4TQ8TD26protein_codingdeleterious_low_confidence(0)benign(0.247)TCGA-BH-A0BR-01Breastbreast invasive carcinomaFemale<65I/IIUnknownUnknownSD
Page: 1 2 3 4 5 6 7 8 9 10 11 12 13 14 15 16 17 18 19 20 21 22 23 24 25 26 27 28 29 30 31 

Top

Related drugs of malignant transformation related genes

check buttonIdentification of chemicals and drugs interact with genes involved in malignant transfromation
(DGIdb 4.0)
Entrez IDSymbolCategoryInteraction TypesDrug Claim NameDrug NamePMIDs
Page: 1