
|
|||||
|
 | |
| |
| |
| |
| |
| |
|
Gene: CHD4 |
Gene summary for CHD4 |
| Gene information | Species | Human | Gene symbol | CHD4 | Gene ID | 1108 |
| Gene name | chromodomain helicase DNA binding protein 4 | |
| Gene Alias | CHD-4 | |
| Cytomap | 12p13.31 | |
| Gene Type | protein-coding | GO ID | GO:0006139 | UniProtAcc | Q14839 |
Top |
Malignant transformation analysis |
| Identification of the aberrant gene expression in precancerous and cancerous lesions by comparing the gene expression of stem-like cells in diseased tissues with normal stem cells |
| Entrez ID | Symbol | Replicates | Species | Organ | Tissue | Adj P-value | Log2FC | Malignancy |
| 1108 | CHD4 | HTA11_3410_2000001011 | Human | Colorectum | AD | 2.45e-02 | 2.09e-01 | 0.0155 |
| 1108 | CHD4 | HTA11_2487_2000001011 | Human | Colorectum | SER | 2.43e-02 | 3.55e-01 | -0.1808 |
| 1108 | CHD4 | HTA11_1938_2000001011 | Human | Colorectum | AD | 4.79e-10 | 6.41e-01 | -0.0811 |
| 1108 | CHD4 | HTA11_78_2000001011 | Human | Colorectum | AD | 2.71e-03 | 3.79e-01 | -0.1088 |
| 1108 | CHD4 | HTA11_347_2000001011 | Human | Colorectum | AD | 9.13e-15 | 5.77e-01 | -0.1954 |
| 1108 | CHD4 | HTA11_696_2000001011 | Human | Colorectum | AD | 3.94e-12 | 5.47e-01 | -0.1464 |
| 1108 | CHD4 | HTA11_866_2000001011 | Human | Colorectum | AD | 1.58e-12 | 5.26e-01 | -0.1001 |
| 1108 | CHD4 | HTA11_1391_2000001011 | Human | Colorectum | AD | 3.92e-19 | 8.85e-01 | -0.059 |
| 1108 | CHD4 | HTA11_546_2000001011 | Human | Colorectum | AD | 1.00e-08 | 6.54e-01 | -0.0842 |
| 1108 | CHD4 | HTA11_866_3004761011 | Human | Colorectum | AD | 3.01e-16 | 6.90e-01 | 0.096 |
| 1108 | CHD4 | HTA11_7663_2000001011 | Human | Colorectum | SER | 2.45e-03 | 8.41e-01 | 0.0131 |
| 1108 | CHD4 | HTA11_6801_2000001011 | Human | Colorectum | SER | 1.63e-05 | 8.31e-01 | 0.0171 |
| 1108 | CHD4 | HTA11_10711_2000001011 | Human | Colorectum | AD | 3.54e-06 | 6.46e-01 | 0.0338 |
| 1108 | CHD4 | HTA11_7696_3000711011 | Human | Colorectum | AD | 2.81e-35 | 9.93e-01 | 0.0674 |
| 1108 | CHD4 | HTA11_6818_2000001011 | Human | Colorectum | AD | 1.43e-02 | 6.23e-01 | 0.0112 |
| 1108 | CHD4 | HTA11_6818_2000001021 | Human | Colorectum | AD | 1.87e-10 | 6.56e-01 | 0.0588 |
| 1108 | CHD4 | HTA11_99999970781_79442 | Human | Colorectum | MSS | 9.51e-23 | 7.84e-01 | 0.294 |
| 1108 | CHD4 | HTA11_99999965062_69753 | Human | Colorectum | MSI-H | 2.10e-05 | 1.25e+00 | 0.3487 |
| 1108 | CHD4 | HTA11_99999965104_69814 | Human | Colorectum | MSS | 4.70e-26 | 1.16e+00 | 0.281 |
| 1108 | CHD4 | HTA11_99999971662_82457 | Human | Colorectum | MSS | 1.73e-28 | 9.40e-01 | 0.3859 |
| Page: 1 2 3 4 5 6 7 8 9 10 |
| Tissue | Expression Dynamics | Abbreviation |
| Colorectum (GSE201348) |  | FAP: Familial adenomatous polyposis |
| CRC: Colorectal cancer | ||
| Colorectum (HTA11) |  | AD: Adenomas |
| SER: Sessile serrated lesions | ||
| MSI-H: Microsatellite-high colorectal cancer | ||
| MSS: Microsatellite stable colorectal cancer | ||
| Esophagus | 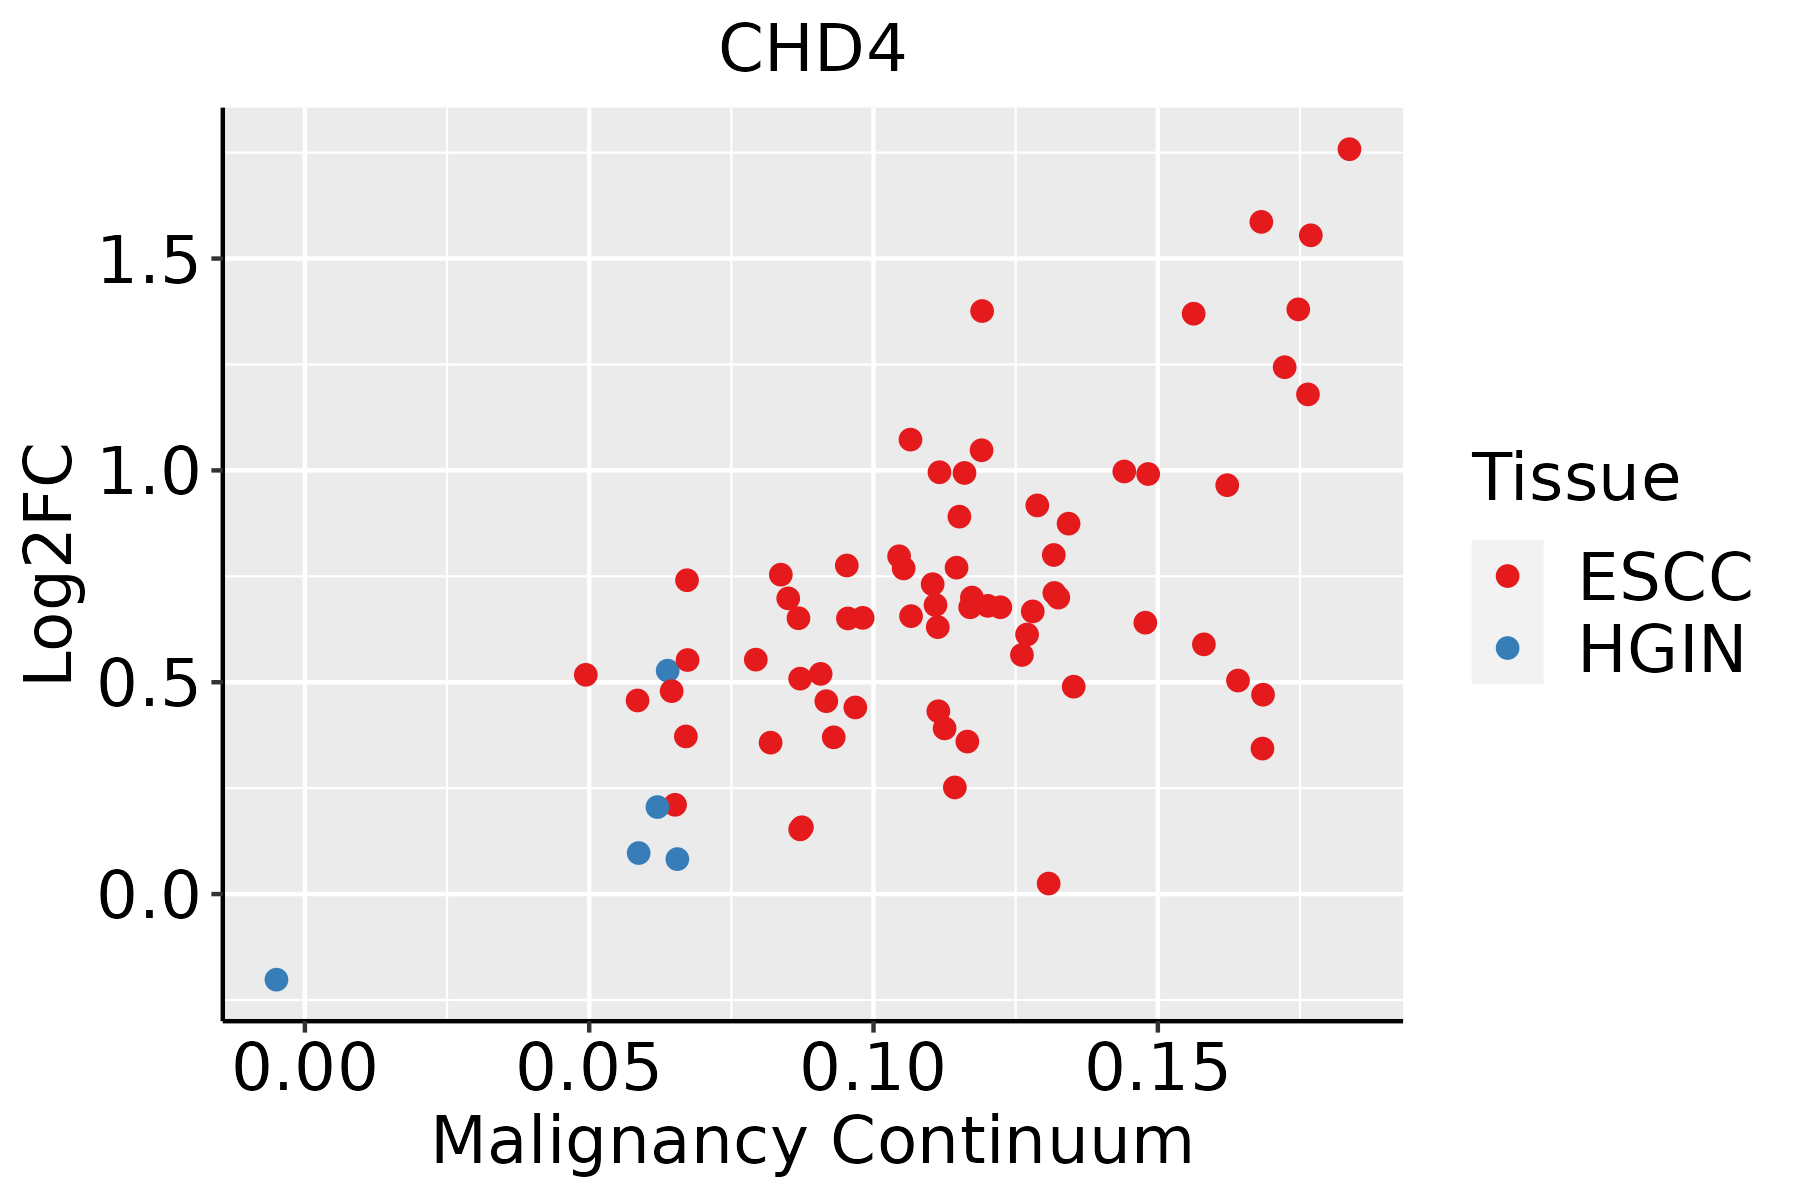 | ESCC: Esophageal squamous cell carcinoma |
| HGIN: High-grade intraepithelial neoplasias | ||
| LGIN: Low-grade intraepithelial neoplasias | ||
| Liver | 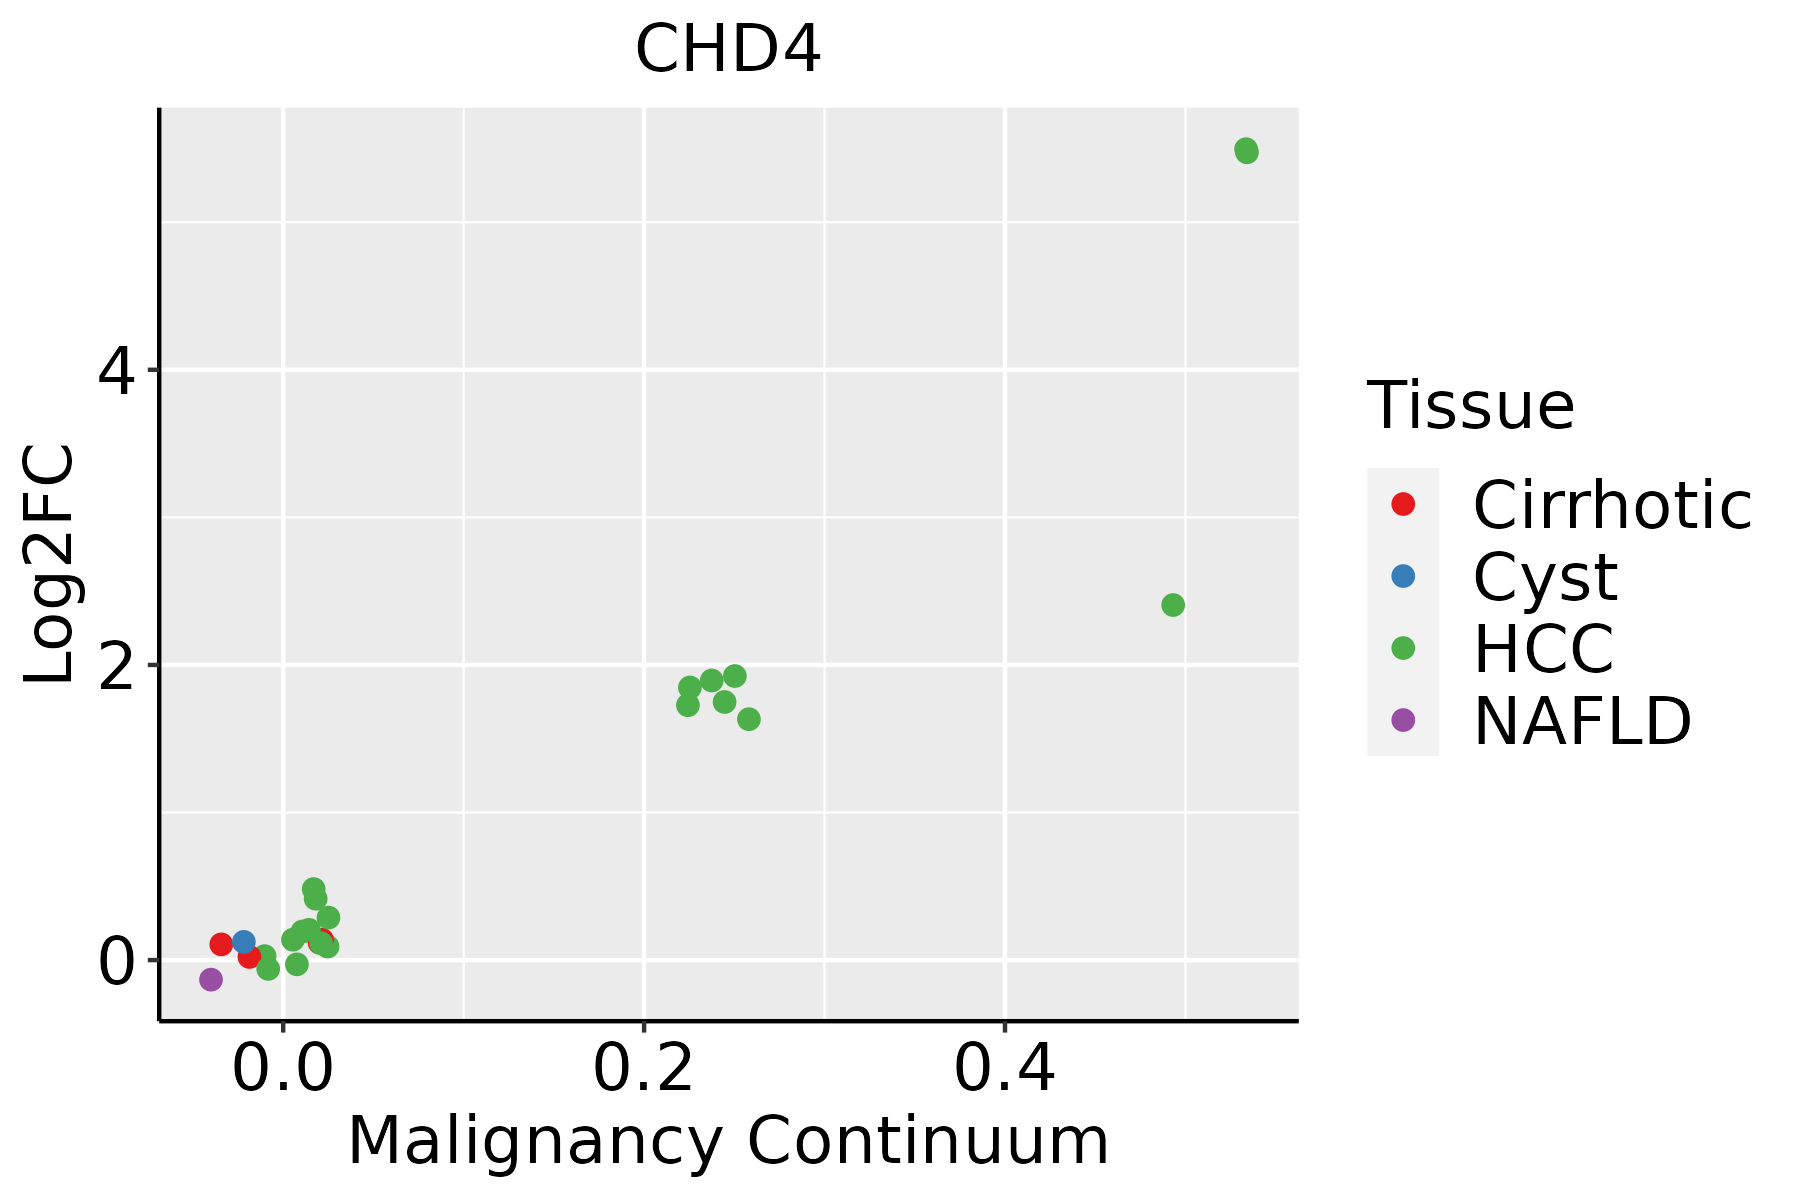 | HCC: Hepatocellular carcinoma |
| NAFLD: Non-alcoholic fatty liver disease | ||
| Lung | 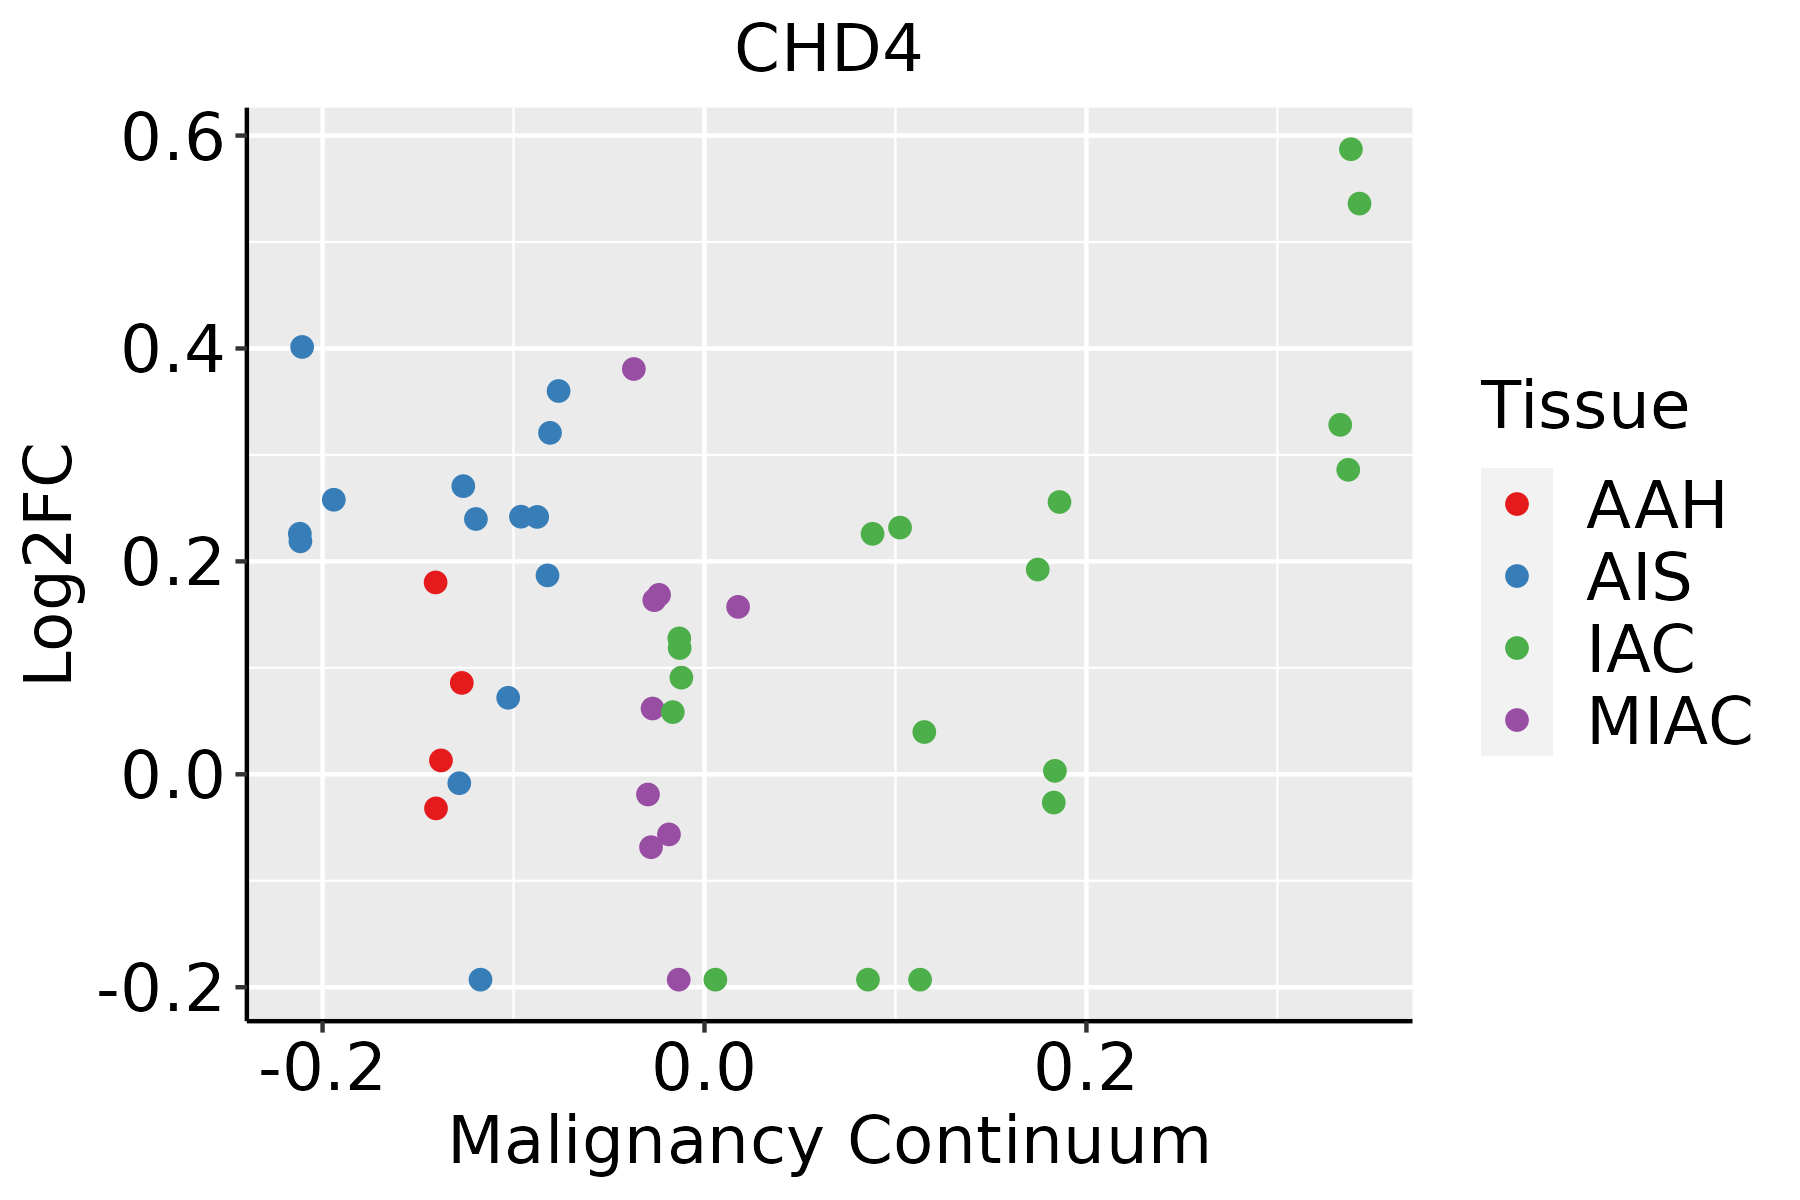 | AAH: Atypical adenomatous hyperplasia |
| AIS: Adenocarcinoma in situ | ||
| IAC: Invasive lung adenocarcinoma | ||
| MIA: Minimally invasive adenocarcinoma | ||
| Oral Cavity | 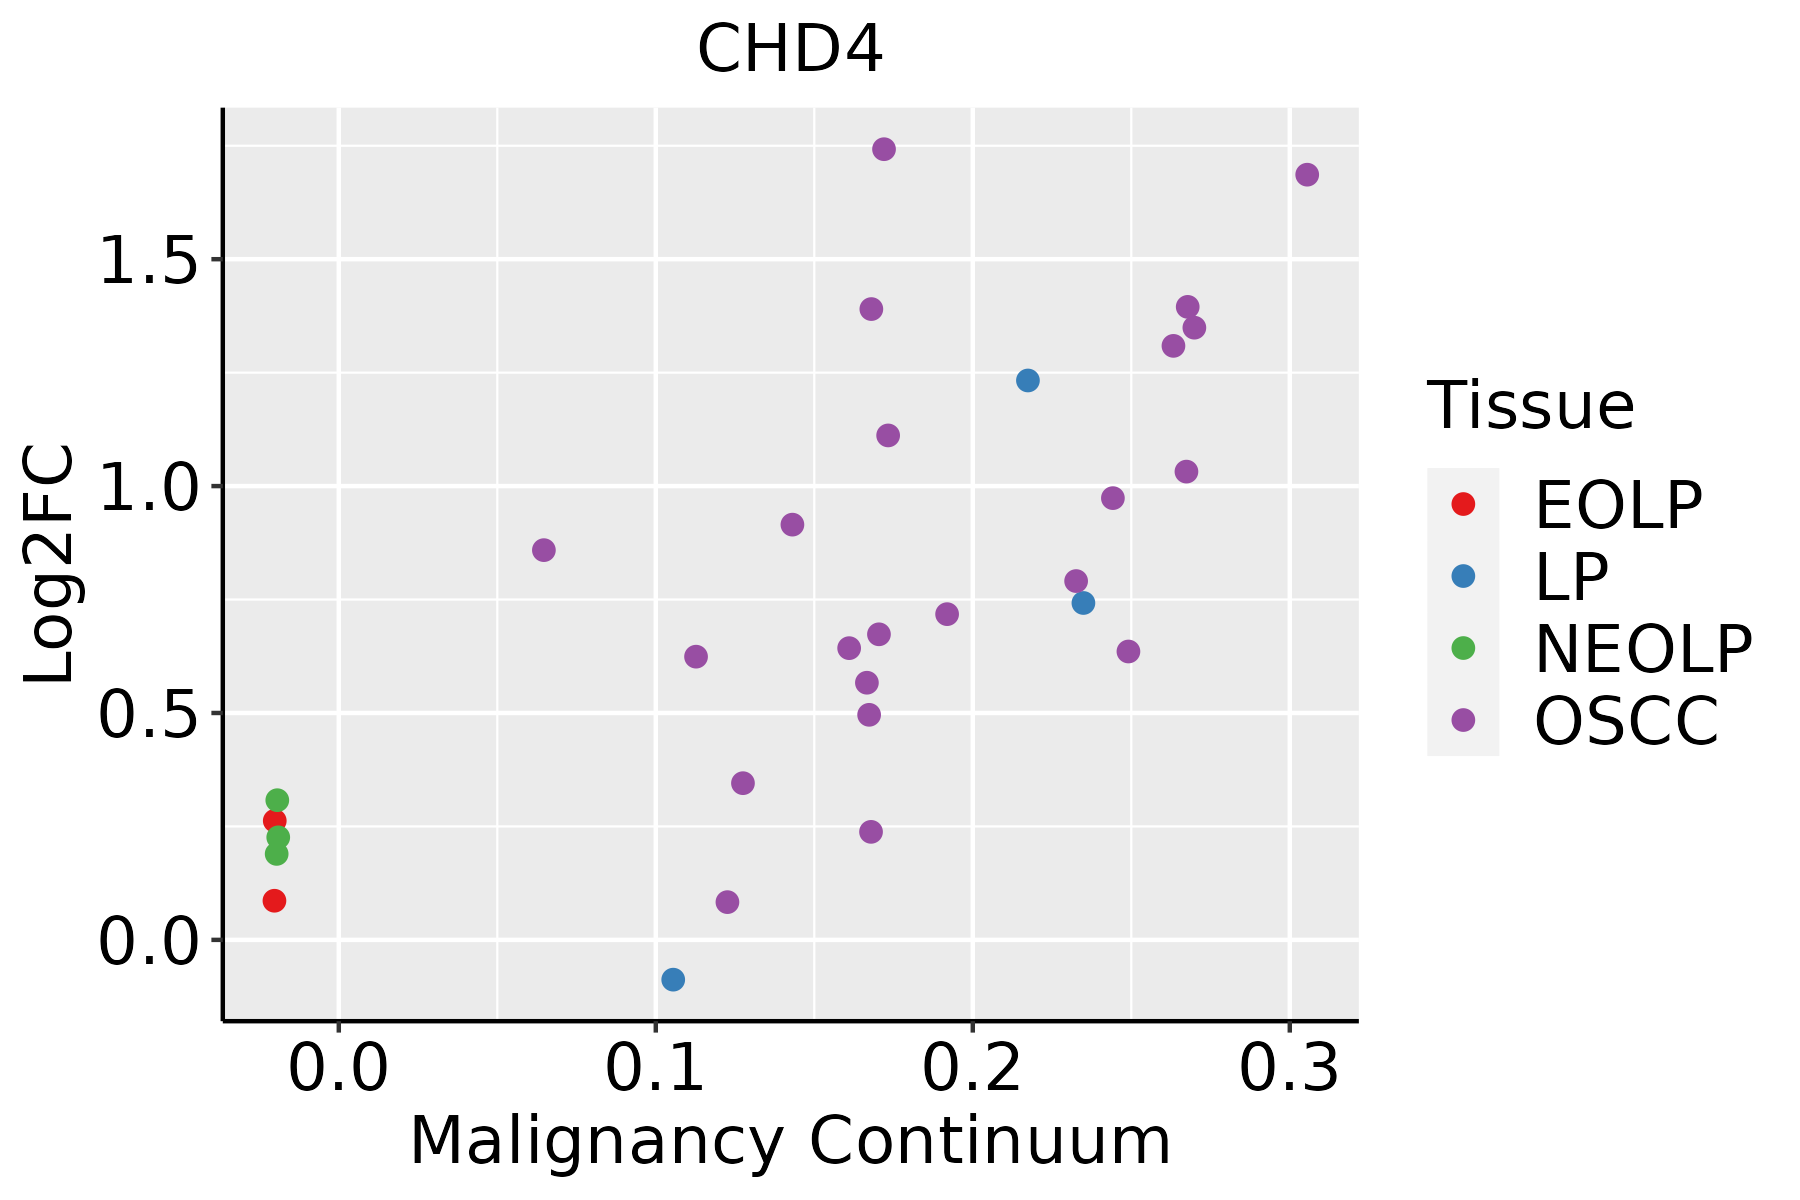 | EOLP: Erosive Oral lichen planus |
| LP: leukoplakia | ||
| NEOLP: Non-erosive oral lichen planus | ||
| OSCC: Oral squamous cell carcinoma | ||
| Prostate | 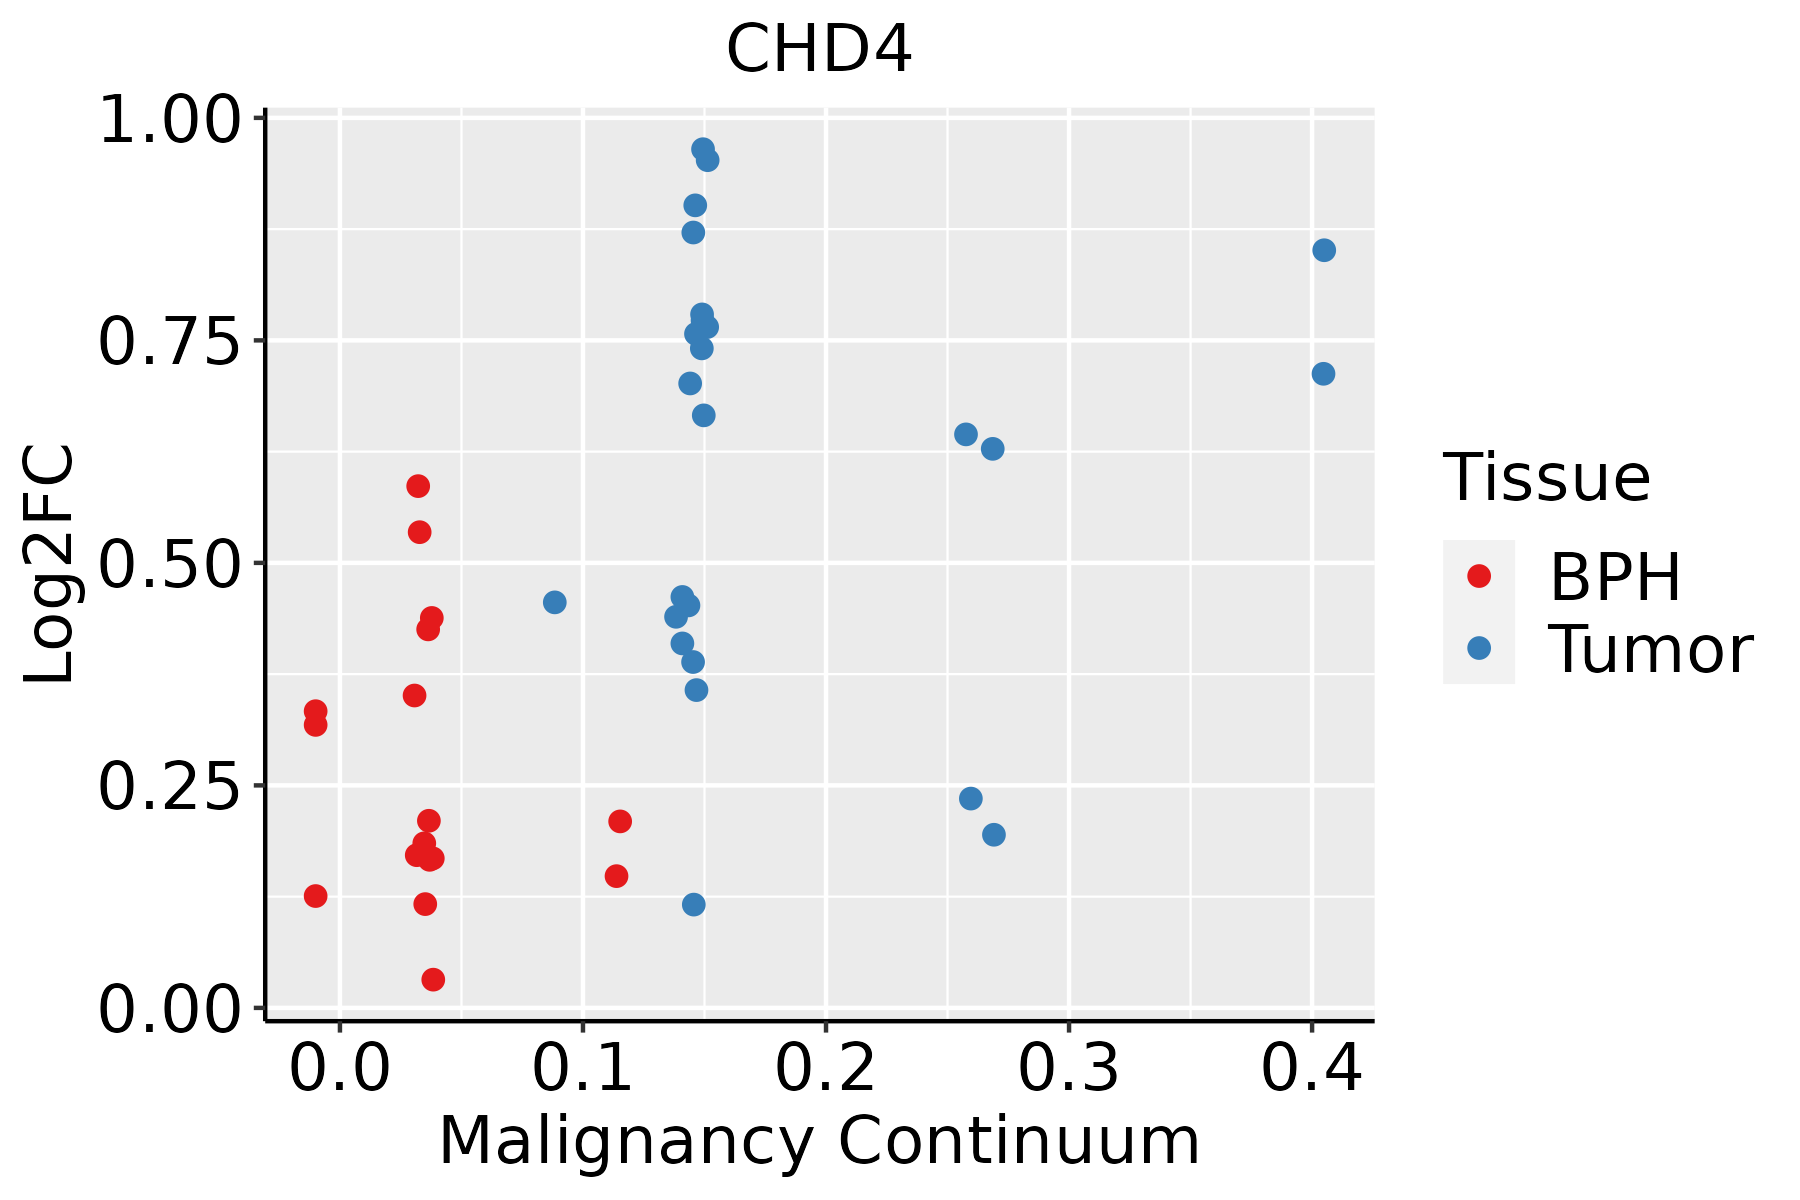 | BPH: Benign Prostatic Hyperplasia |
| Skin |  | AK: Actinic keratosis |
| cSCC: Cutaneous squamous cell carcinoma | ||
| SCCIS:squamous cell carcinoma in situ | ||
| Thyroid | 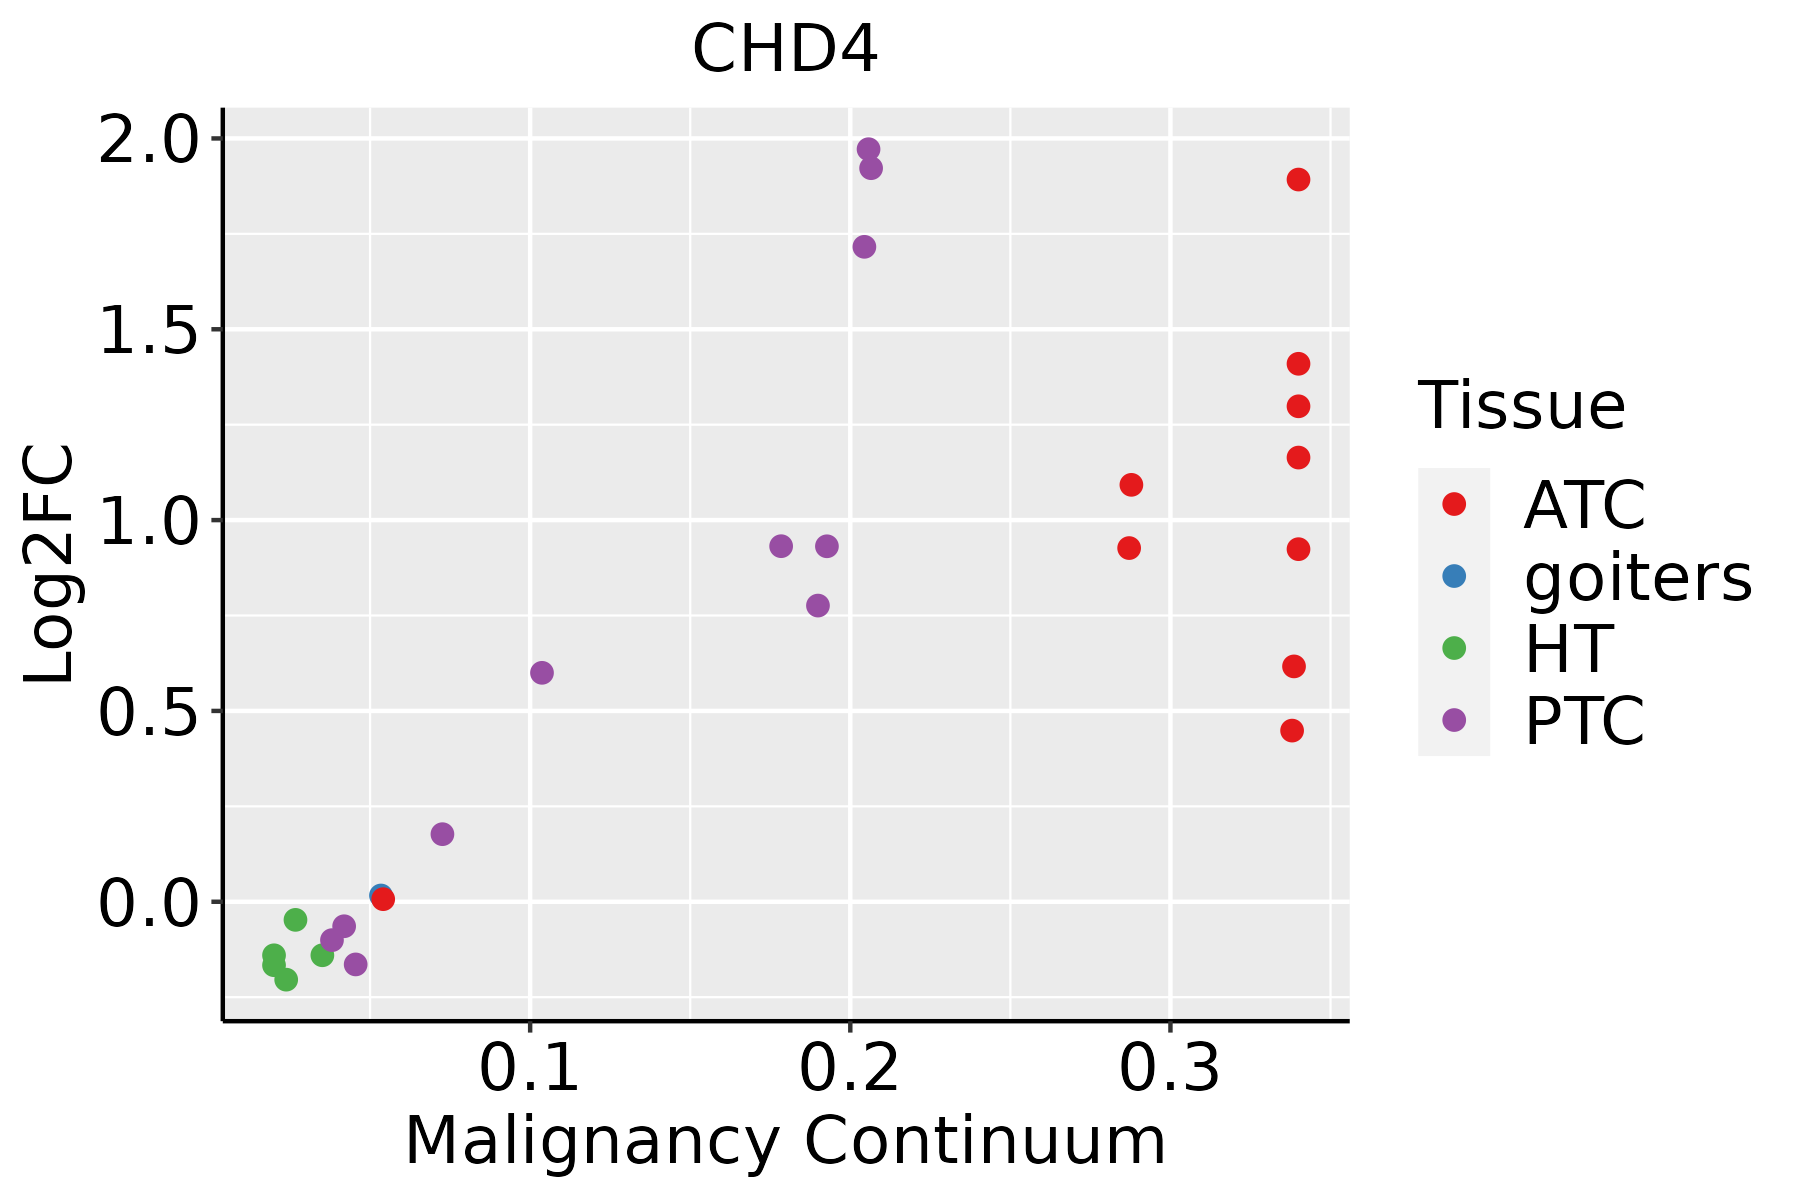 | ATC: Anaplastic thyroid cancer |
| HT: Hashimoto's thyroiditis | ||
| PTC: Papillary thyroid cancer |
| ∗log2FC in expression of this searched gene in stem-like cells from each diseased tissue sample relative to stem-like cells in normal samples in each tissue plotted against the malignancy continuum. Samples are colored based on if they are from different disease stage. |
Top |
Malignant transformation related pathway analysis |
| Find out the enriched GO biological processes and KEGG pathways involved in transition from healthy to precancer to cancer |
| Tissue | Disease Stage | Enriched GO biological Processes |
| Colorectum | AD |  |
| Colorectum | SER |  |
| Colorectum | MSS |  |
| Colorectum | MSI-H |  |
| Colorectum | FAP |  |
| ∗Top 15 enriched GO BP terms are showed in the bar plot of each disease state in each tissue. Each row represents a significant GO biological process which is colored according to the -log10(p.adjust). |
| Page: 1 2 3 4 5 6 7 8 9 |
| GO ID | Tissue | Disease Stage | Description | Gene Ratio | Bg Ratio | pvalue | p.adjust | Count |
| GO:0006325 | Colorectum | AD | chromatin organization | 119/3918 | 409/18723 | 4.85e-05 | 8.33e-04 | 119 |
| GO:0032392 | Colorectum | AD | DNA geometric change | 31/3918 | 90/18723 | 2.02e-03 | 1.63e-02 | 31 |
| GO:0006338 | Colorectum | AD | chromatin remodeling | 70/3918 | 255/18723 | 7.44e-03 | 4.53e-02 | 70 |
| GO:00063251 | Colorectum | SER | chromatin organization | 89/2897 | 409/18723 | 4.15e-04 | 6.17e-03 | 89 |
| GO:00063252 | Colorectum | MSS | chromatin organization | 107/3467 | 409/18723 | 7.22e-05 | 1.21e-03 | 107 |
| GO:00323921 | Colorectum | MSS | DNA geometric change | 29/3467 | 90/18723 | 1.26e-03 | 1.20e-02 | 29 |
| GO:0032508 | Colorectum | MSS | DNA duplex unwinding | 25/3467 | 84/18723 | 8.27e-03 | 4.99e-02 | 25 |
| GO:00063253 | Colorectum | FAP | chromatin organization | 84/2622 | 409/18723 | 1.62e-04 | 2.47e-03 | 84 |
| GO:000632516 | Esophagus | HGIN | chromatin organization | 92/2587 | 409/18723 | 1.05e-06 | 4.16e-05 | 92 |
| GO:00323926 | Esophagus | HGIN | DNA geometric change | 25/2587 | 90/18723 | 3.77e-04 | 5.85e-03 | 25 |
| GO:00325084 | Esophagus | HGIN | DNA duplex unwinding | 22/2587 | 84/18723 | 1.91e-03 | 2.03e-02 | 22 |
| GO:0072594110 | Esophagus | ESCC | establishment of protein localization to organelle | 311/8552 | 422/18723 | 3.02e-32 | 2.13e-29 | 311 |
| GO:0006605111 | Esophagus | ESCC | protein targeting | 229/8552 | 314/18723 | 4.93e-23 | 1.01e-20 | 229 |
| GO:0006457110 | Esophagus | ESCC | protein folding | 163/8552 | 212/18723 | 1.13e-20 | 1.74e-18 | 163 |
| GO:0006839110 | Esophagus | ESCC | mitochondrial transport | 187/8552 | 254/18723 | 8.35e-20 | 9.81e-18 | 187 |
| GO:0033108110 | Esophagus | ESCC | mitochondrial respiratory chain complex assembly | 83/8552 | 93/18723 | 9.56e-19 | 1.05e-16 | 83 |
| GO:0072655110 | Esophagus | ESCC | establishment of protein localization to mitochondrion | 97/8552 | 120/18723 | 2.17e-15 | 1.33e-13 | 97 |
| GO:0070585110 | Esophagus | ESCC | protein localization to mitochondrion | 100/8552 | 125/18723 | 2.96e-15 | 1.77e-13 | 100 |
| GO:001703818 | Esophagus | ESCC | protein import | 149/8552 | 206/18723 | 5.90e-15 | 3.31e-13 | 149 |
| GO:0006626110 | Esophagus | ESCC | protein targeting to mitochondrion | 81/8552 | 100/18723 | 3.60e-13 | 1.67e-11 | 81 |
| Page: 1 2 3 4 5 6 |
| Pathway ID | Tissue | Disease Stage | Description | Gene Ratio | Bg Ratio | pvalue | p.adjust | qvalue | Count |
| hsa052039 | Esophagus | HGIN | Viral carcinogenesis | 53/1383 | 204/8465 | 2.58e-04 | 2.71e-03 | 2.15e-03 | 53 |
| hsa0520315 | Esophagus | HGIN | Viral carcinogenesis | 53/1383 | 204/8465 | 2.58e-04 | 2.71e-03 | 2.15e-03 | 53 |
| hsa0516510 | Esophagus | ESCC | Human papillomavirus infection | 215/4205 | 331/8465 | 7.86e-09 | 7.12e-08 | 3.65e-08 | 215 |
| hsa0520325 | Esophagus | ESCC | Viral carcinogenesis | 137/4205 | 204/8465 | 2.47e-07 | 1.88e-06 | 9.62e-07 | 137 |
| hsa0516515 | Esophagus | ESCC | Human papillomavirus infection | 215/4205 | 331/8465 | 7.86e-09 | 7.12e-08 | 3.65e-08 | 215 |
| hsa0520335 | Esophagus | ESCC | Viral carcinogenesis | 137/4205 | 204/8465 | 2.47e-07 | 1.88e-06 | 9.62e-07 | 137 |
| hsa05165 | Liver | Cirrhotic | Human papillomavirus infection | 124/2530 | 331/8465 | 1.55e-03 | 7.83e-03 | 4.83e-03 | 124 |
| hsa05203 | Liver | Cirrhotic | Viral carcinogenesis | 76/2530 | 204/8465 | 1.34e-02 | 4.20e-02 | 2.59e-02 | 76 |
| hsa051651 | Liver | Cirrhotic | Human papillomavirus infection | 124/2530 | 331/8465 | 1.55e-03 | 7.83e-03 | 4.83e-03 | 124 |
| hsa052031 | Liver | Cirrhotic | Viral carcinogenesis | 76/2530 | 204/8465 | 1.34e-02 | 4.20e-02 | 2.59e-02 | 76 |
| hsa051652 | Liver | HCC | Human papillomavirus infection | 188/4020 | 331/8465 | 3.34e-04 | 1.49e-03 | 8.29e-04 | 188 |
| hsa052032 | Liver | HCC | Viral carcinogenesis | 117/4020 | 204/8465 | 2.68e-03 | 8.98e-03 | 5.00e-03 | 117 |
| hsa051653 | Liver | HCC | Human papillomavirus infection | 188/4020 | 331/8465 | 3.34e-04 | 1.49e-03 | 8.29e-04 | 188 |
| hsa052033 | Liver | HCC | Viral carcinogenesis | 117/4020 | 204/8465 | 2.68e-03 | 8.98e-03 | 5.00e-03 | 117 |
| hsa051656 | Lung | IAC | Human papillomavirus infection | 71/1053 | 331/8465 | 1.88e-06 | 7.63e-05 | 5.06e-05 | 71 |
| hsa052034 | Lung | IAC | Viral carcinogenesis | 43/1053 | 204/8465 | 3.02e-04 | 3.07e-03 | 2.04e-03 | 43 |
| hsa0516511 | Lung | IAC | Human papillomavirus infection | 71/1053 | 331/8465 | 1.88e-06 | 7.63e-05 | 5.06e-05 | 71 |
| hsa0520311 | Lung | IAC | Viral carcinogenesis | 43/1053 | 204/8465 | 3.02e-04 | 3.07e-03 | 2.04e-03 | 43 |
| hsa0516521 | Lung | AIS | Human papillomavirus infection | 64/961 | 331/8465 | 1.03e-05 | 3.04e-04 | 1.95e-04 | 64 |
| hsa0520321 | Lung | AIS | Viral carcinogenesis | 37/961 | 204/8465 | 2.49e-03 | 1.49e-02 | 9.55e-03 | 37 |
| Page: 1 2 3 |
Top |
Cell-cell communication analysis |
| Identification of potential cell-cell interactions between two cell types and their ligand-receptor pairs for different disease states |
| Ligand | Receptor | LRpair | Pathway | Tissue | Disease Stage |
| Page: 1 |
Top |
Single-cell gene regulatory network inference analysis |
| Find out the significant the regulons (TFs) and the target genes of each regulon across cell types for different disease states |
| TF | Cell Type | Tissue | Disease Stage | Target Gene | RSS | Regulon Activity |
| ∗The dot plots of a searched regulon are shown for all cell subpopulations in each disease state of each tissue based on the regulon specific score inferred using pySCENIC and by calculating the average expression. |
| Page: 1 |
Top |
Somatic mutation of malignant transformation related genes |
| Annotation of somatic variants for genes involved in malignant transformation |
| Hugo Symbol | Variant Class | Variant Classification | dbSNP RS | HGVSc | HGVSp | HGVSp Short | SWISSPROT | BIOTYPE | SIFT | PolyPhen | Tumor Sample Barcode | Tissue | Histology | Sex | Age | Stage | Therapy Types | Drugs | Outcome |
| CHD4 | SNV | Missense_Mutation | novel | c.1156G>A | p.Asp386Asn | p.D386N | Q14839 | protein_coding | deleterious(0) | probably_damaging(1) | TCGA-5L-AAT1-01 | Breast | breast invasive carcinoma | Female | <65 | III/IV | Hormone Therapy | letrozol | SD |
| CHD4 | SNV | Missense_Mutation | c.266N>T | p.Gly89Val | p.G89V | Q14839 | protein_coding | tolerated_low_confidence(0.05) | benign(0.115) | TCGA-A1-A0SK-01 | Breast | breast invasive carcinoma | Female | <65 | I/II | Unknown | Unknown | PD | |
| CHD4 | SNV | Missense_Mutation | c.3184C>G | p.Leu1062Val | p.L1062V | Q14839 | protein_coding | deleterious(0) | probably_damaging(0.997) | TCGA-A2-A0CL-01 | Breast | breast invasive carcinoma | Female | <65 | III/IV | Chemotherapy | cytoxan | SD | |
| CHD4 | SNV | Missense_Mutation | novel | c.3048N>C | p.Lys1016Asn | p.K1016N | Q14839 | protein_coding | deleterious(0) | probably_damaging(0.999) | TCGA-A2-A0CR-01 | Breast | breast invasive carcinoma | Female | <65 | I/II | Chemotherapy | adriamycin | CR |
| CHD4 | SNV | Missense_Mutation | c.2458N>A | p.Glu820Lys | p.E820K | Q14839 | protein_coding | deleterious(0) | probably_damaging(0.999) | TCGA-A2-A0YK-01 | Breast | breast invasive carcinoma | Female | <65 | I/II | Chemotherapy | cytoxan | SD | |
| CHD4 | SNV | Missense_Mutation | novel | c.800N>T | p.Gly267Val | p.G267V | Q14839 | protein_coding | deleterious(0.02) | probably_damaging(1) | TCGA-A2-A4S2-01 | Breast | breast invasive carcinoma | Female | <65 | III/IV | Chemotherapy | adriamycin | CR |
| CHD4 | SNV | Missense_Mutation | c.2629N>T | p.Arg877Trp | p.R877W | Q14839 | protein_coding | deleterious(0) | probably_damaging(0.999) | TCGA-A7-A5ZX-01 | Breast | breast invasive carcinoma | Female | <65 | III/IV | Chemotherapy | doxorubicin | CR | |
| CHD4 | SNV | Missense_Mutation | c.4007N>A | p.Gly1336Glu | p.G1336E | Q14839 | protein_coding | deleterious(0) | probably_damaging(1) | TCGA-A8-A0A1-01 | Breast | breast invasive carcinoma | Female | >=65 | I/II | Hormone Therapy | tamoxiphen | SD | |
| CHD4 | SNV | Missense_Mutation | c.3967N>C | p.Glu1323Gln | p.E1323Q | Q14839 | protein_coding | deleterious(0.03) | probably_damaging(0.999) | TCGA-AC-A23H-01 | Breast | breast invasive carcinoma | Female | >=65 | I/II | Unknown | Unknown | PD | |
| CHD4 | SNV | Missense_Mutation | c.2630N>A | p.Arg877Gln | p.R877Q | Q14839 | protein_coding | deleterious(0) | probably_damaging(0.999) | TCGA-AQ-A1H3-01 | Breast | breast invasive carcinoma | Female | <65 | III/IV | Chemotherapy | adriamycin | SD |
| Page: 1 2 3 4 5 6 7 8 9 10 11 12 13 14 15 16 17 18 19 20 21 22 23 24 25 26 27 28 29 30 31 32 33 |
Top |
Related drugs of malignant transformation related genes |
| Identification of chemicals and drugs interact with genes involved in malignant transfromation |
| (DGIdb 4.0) |
| Entrez ID | Symbol | Category | Interaction Types | Drug Claim Name | Drug Name | PMIDs |
| 1108 | CHD4 | ENZYME, CLINICALLY ACTIONABLE | vorinostat | VORINOSTAT | 26296641 |
| Page: 1 |

Copyright 2023-Present -The University of Texas Health Science Center at Houston |