Schematic overview of the cellular and molecular mechanisms involved in the cancer progression, including the proposed cellular and molecular mechanisms in cancer cells trajectory. AT1: alveolar type 1 cells; AT2: alveolar type 2 cells; AAH: atypical adenomatous hyperplasia; AIS: adenocarcinoma in situ; MIA: minimally invasive adenocarcinoma; IA: invasive adenocarcinoma; EMT: epithelial-mesenchymal transition

Home

Download

Statistics

Help

Contact

Center for Computational Systems Medicine
leaf

Gene summary

leaf

Malignant transformation analysis

leaf

Malignant transformation related pathway analysis

leaf

Cell-cell communication analysis

leaf

Single-cell gene regulatory network inference analysis

leaf

Somatic mutation of malignant transformation related genes

leaf

Related drugs of malignant transformation related genes

Gene: CHD2

Gene summary for CHD2

check button Gene summary.

Gene informationSpeciesHuman
Gene symbol

CHD2

Gene ID

1106

Gene namechromodomain helicase DNA binding protein 2
Gene AliasDEE94
Cytomap15q26.1
Gene Typeprotein-coding
GO ID

GO:0002244

UniProtAcc

O14647


Top

Malignant transformation analysis

check button Identification of the aberrant gene expression in precancerous and cancerous lesions by comparing the gene expression of stem-like cells in diseased tissues with normal stem cells
check button Malignant transformation involving gene list.
Entrez IDSymbolReplicatesSpeciesOrganTissueAdj P-valueLog2FCMalignancy
1106CHD2CA_HPV_1HumanCervixCC2.61e-057.68e-020.0264
1106CHD2CCI_2HumanCervixCC1.15e-037.06e-010.5249
1106CHD2CCI_3HumanCervixCC4.45e-087.91e-010.516
1106CHD2T1HumanCervixCC1.66e-022.75e-010.0918
1106CHD2AEH-subject1HumanEndometriumAEH2.61e-296.75e-01-0.3059
1106CHD2AEH-subject2HumanEndometriumAEH8.27e-053.44e-01-0.2525
1106CHD2AEH-subject3HumanEndometriumAEH1.43e-093.08e-01-0.2576
1106CHD2AEH-subject4HumanEndometriumAEH1.97e-207.31e-01-0.2657
1106CHD2AEH-subject5HumanEndometriumAEH7.30e-368.60e-01-0.2953
1106CHD2EEC-subject1HumanEndometriumEEC1.09e-377.29e-01-0.2682
1106CHD2EEC-subject2HumanEndometriumEEC4.34e-134.62e-01-0.2607
1106CHD2EEC-subject3HumanEndometriumEEC1.86e-183.56e-01-0.2525
1106CHD2EEC-subject4HumanEndometriumEEC5.38e-205.63e-01-0.2571
1106CHD2EEC-subject5HumanEndometriumEEC8.58e-226.40e-01-0.249
1106CHD2GSM6177620_NYU_UCEC1_lib1_lib1HumanEndometriumEEC3.12e-127.81e-02-0.1869
1106CHD2GSM6177620_NYU_UCEC1_lib2_lib2HumanEndometriumEEC6.40e-12-5.28e-02-0.1875
1106CHD2GSM6177620_NYU_UCEC1_lib3_lib3HumanEndometriumEEC6.89e-155.05e-02-0.1883
1106CHD2GSM6177621_NYU_UCEC2_lib1_lib1HumanEndometriumEEC1.38e-094.45e-02-0.1934
1106CHD2GSM6177622_NYU_UCEC3_lib1_lib1HumanEndometriumEEC1.67e-259.18e-02-0.1917
1106CHD2GSM6177622_NYU_UCEC3_lib2_lib2HumanEndometriumEEC1.01e-198.51e-02-0.1916
Page: 1 2 3 4 5 6 7 8 9 10 11 

check button Transcriptomic changes along malignancy continuum.
TissueExpression DynamicsAbbreviation
CervixThe image shows the transcriptomic changes along malignancy continuum.log2FC in expression of this searched gene in stem-like cells from each diseased tissue sample relative to stem-like cells in normal samples in each tissue plotted against the malignancy continuum. Samples are colored based on if they are from different disease stage.CC: Cervix cancer
HSIL_HPV: HPV-infected high-grade squamous intraepithelial lesions
N_HPV: HPV-infected normal cervix
EndometriumThe image shows the transcriptomic changes along malignancy continuum.log2FC in expression of this searched gene in stem-like cells from each diseased tissue sample relative to stem-like cells in normal samples in each tissue plotted against the malignancy continuum. Samples are colored based on if they are from different disease stage.AEH: Atypical endometrial hyperplasia
EEC: Endometrioid Cancer
EsophagusThe image shows the transcriptomic changes along malignancy continuum.log2FC in expression of this searched gene in stem-like cells from each diseased tissue sample relative to stem-like cells in normal samples in each tissue plotted against the malignancy continuum. Samples are colored based on if they are from different disease stage.
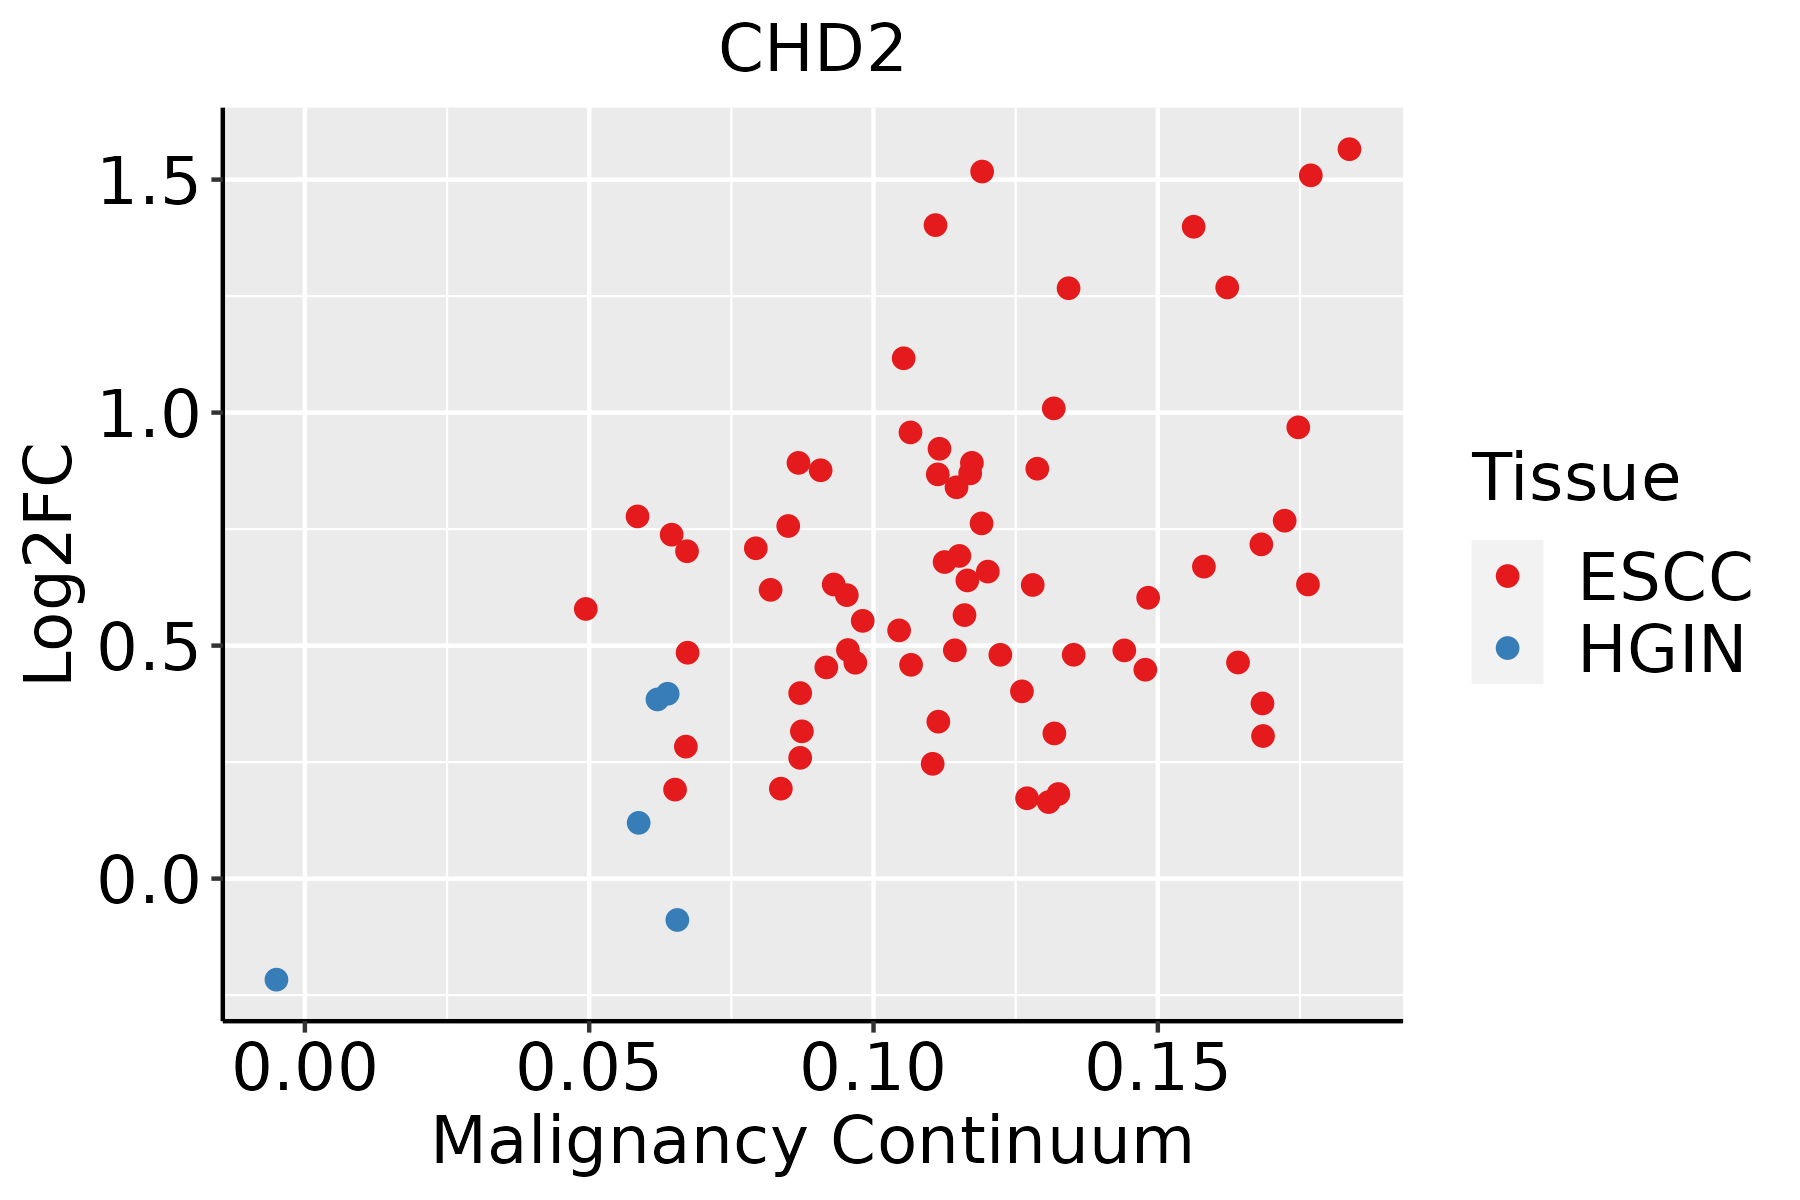
ESCC: Esophageal squamous cell carcinoma
HGIN: High-grade intraepithelial neoplasias
LGIN: Low-grade intraepithelial neoplasias
LiverThe image shows the transcriptomic changes along malignancy continuum.log2FC in expression of this searched gene in stem-like cells from each diseased tissue sample relative to stem-like cells in normal samples in each tissue plotted against the malignancy continuum. Samples are colored based on if they are from different disease stage.
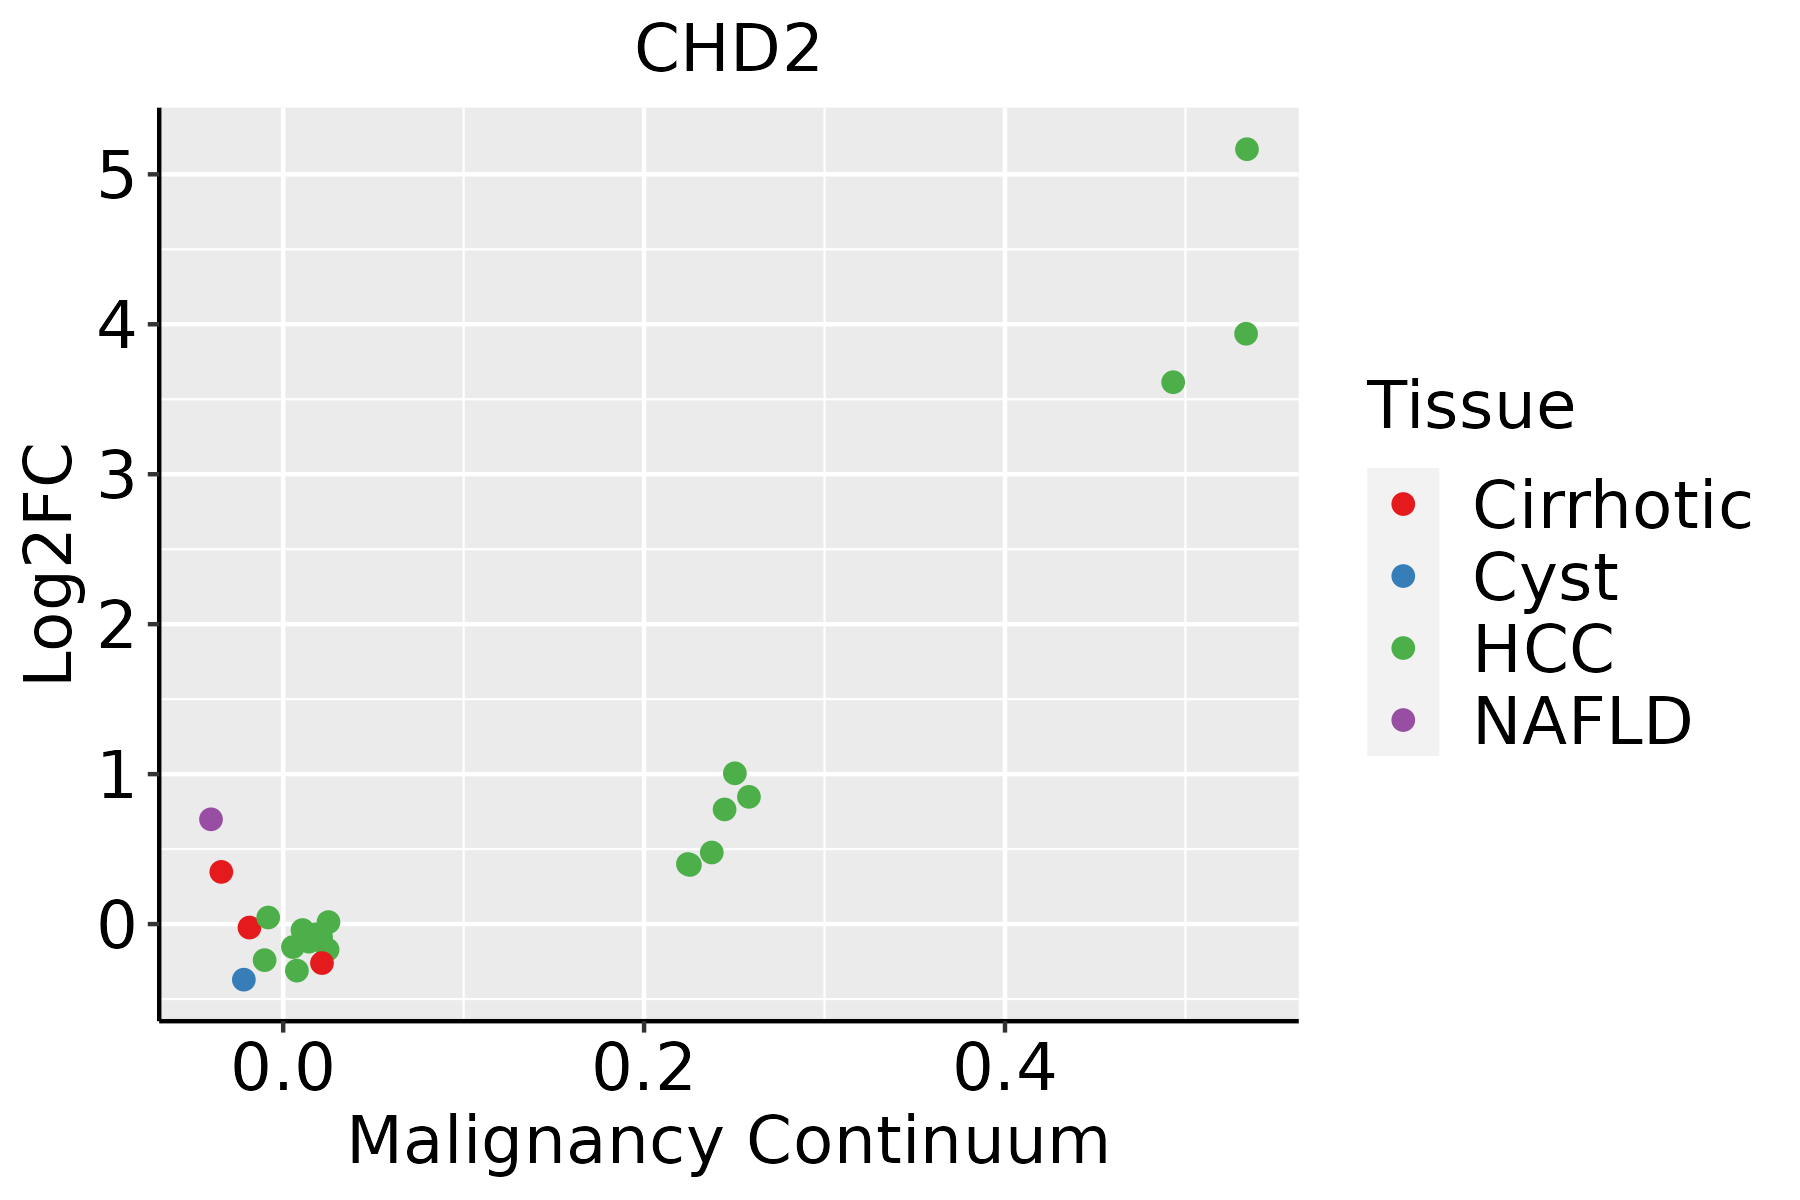
HCC: Hepatocellular carcinoma
NAFLD: Non-alcoholic fatty liver disease
LungThe image shows the transcriptomic changes along malignancy continuum.log2FC in expression of this searched gene in stem-like cells from each diseased tissue sample relative to stem-like cells in normal samples in each tissue plotted against the malignancy continuum. Samples are colored based on if they are from different disease stage.
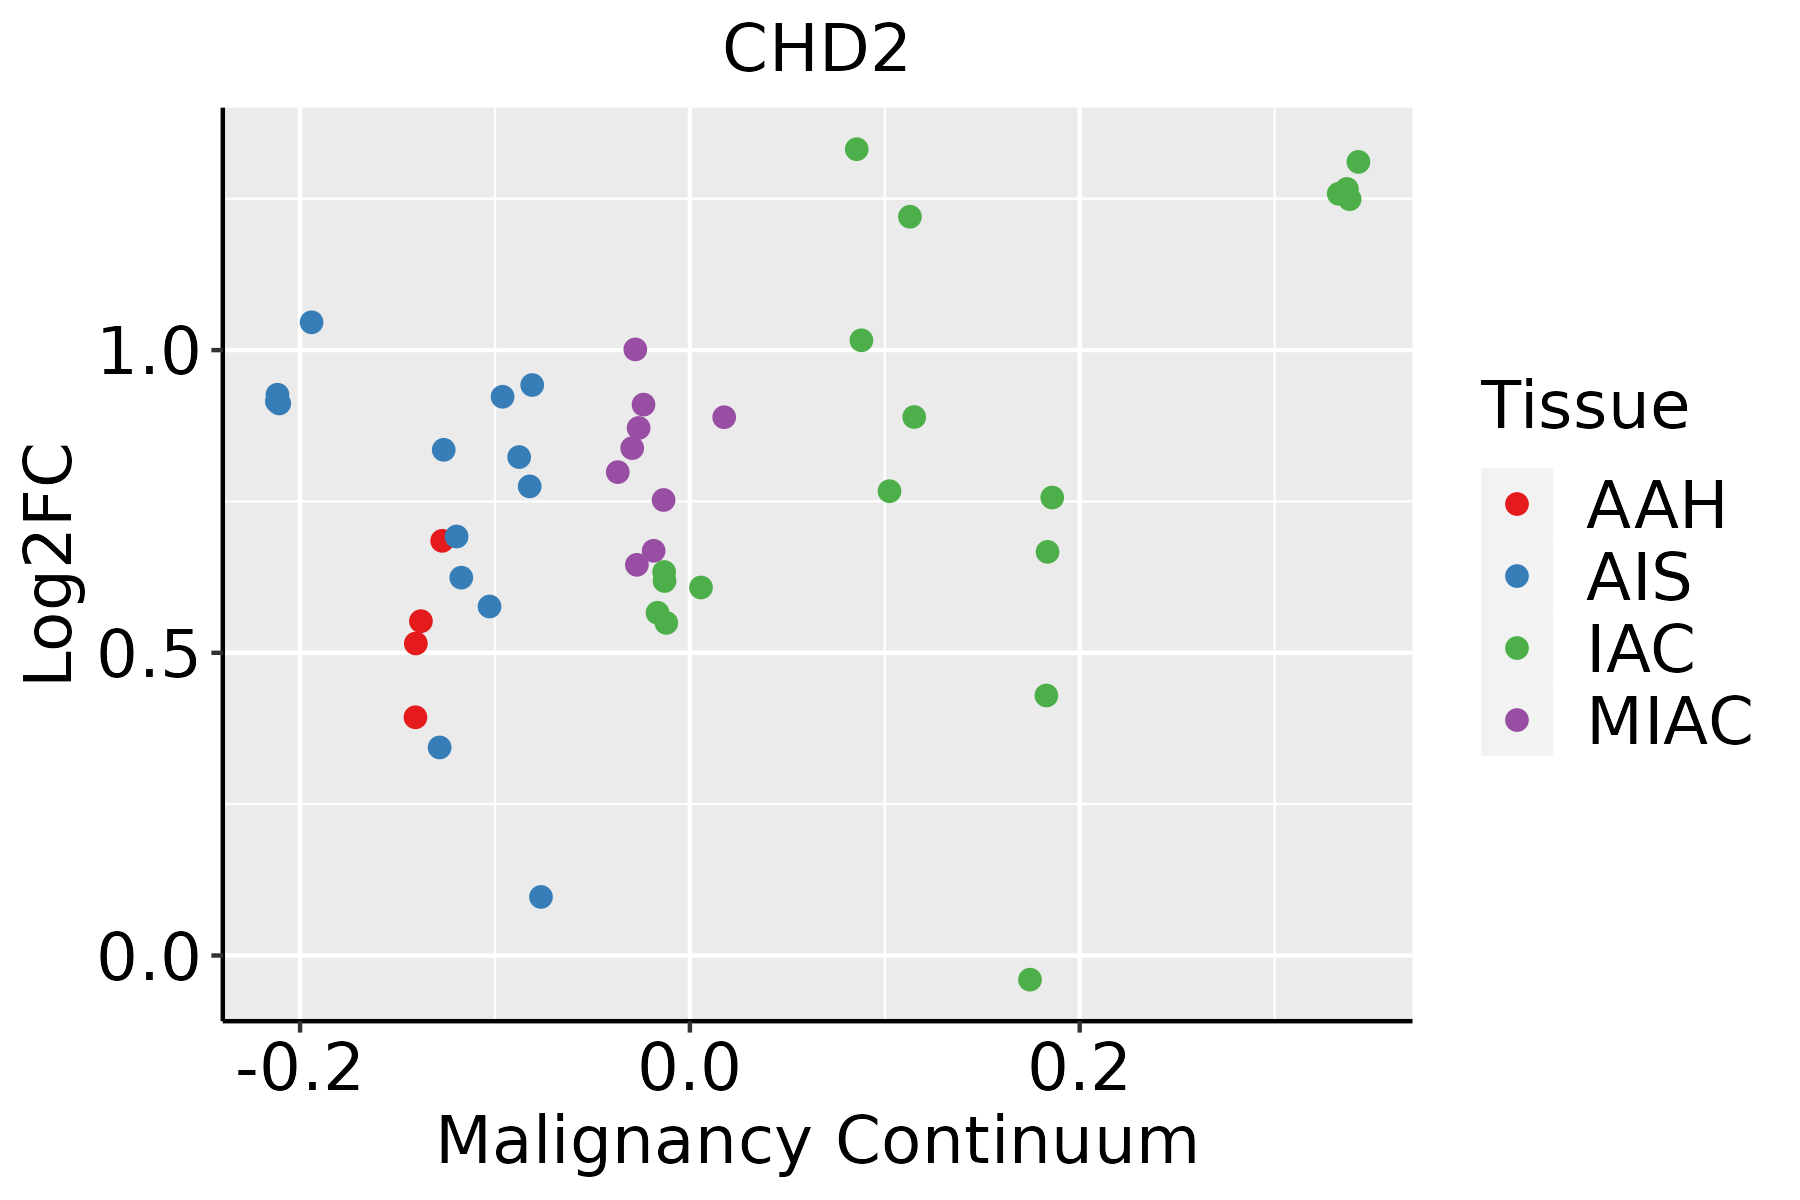
AAH: Atypical adenomatous hyperplasia
AIS: Adenocarcinoma in situ
IAC: Invasive lung adenocarcinoma
MIA: Minimally invasive adenocarcinoma
Oral CavityThe image shows the transcriptomic changes along malignancy continuum.log2FC in expression of this searched gene in stem-like cells from each diseased tissue sample relative to stem-like cells in normal samples in each tissue plotted against the malignancy continuum. Samples are colored based on if they are from different disease stage.EOLP: Erosive Oral lichen planus
LP: leukoplakia
NEOLP: Non-erosive oral lichen planus
OSCC: Oral squamous cell carcinoma
ProstateThe image shows the transcriptomic changes along malignancy continuum.log2FC in expression of this searched gene in stem-like cells from each diseased tissue sample relative to stem-like cells in normal samples in each tissue plotted against the malignancy continuum. Samples are colored based on if they are from different disease stage.
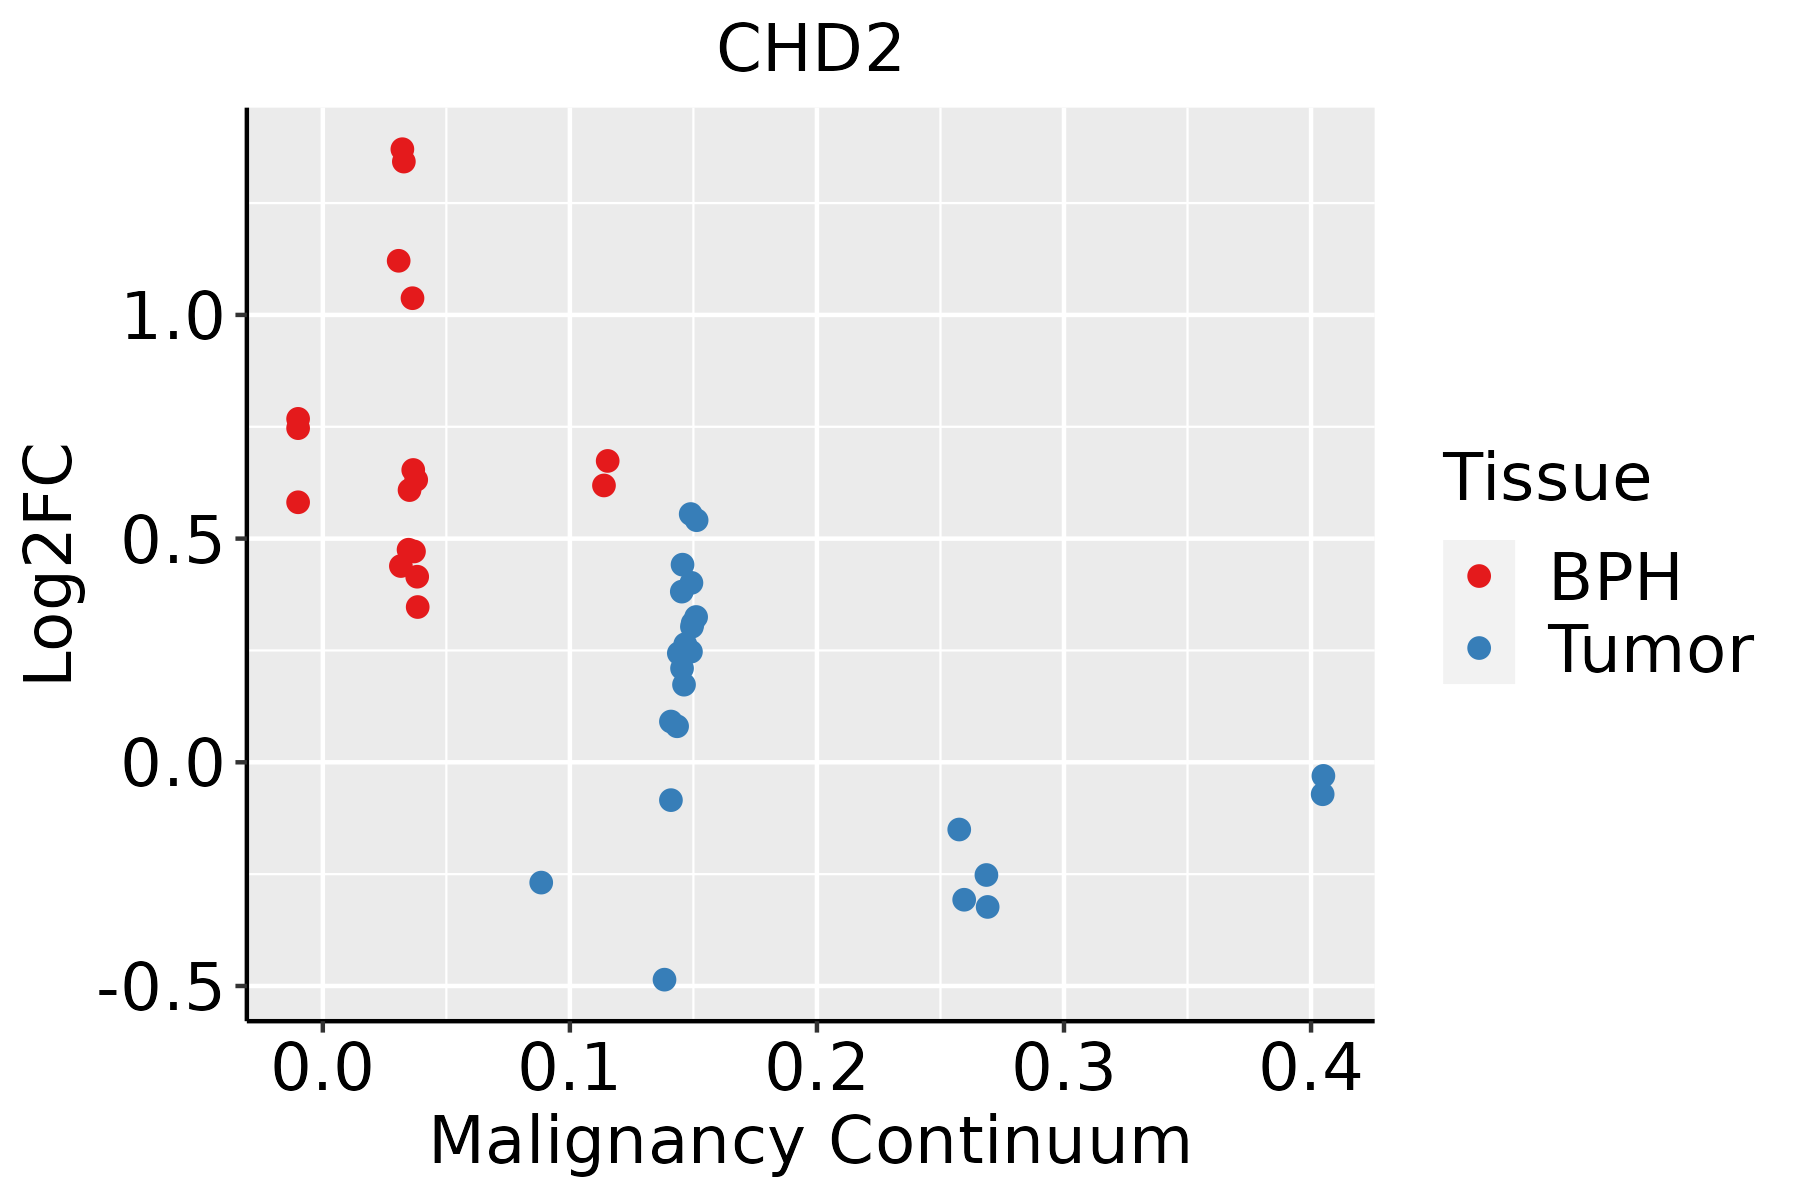
BPH: Benign Prostatic Hyperplasia
SkinThe image shows the transcriptomic changes along malignancy continuum.log2FC in expression of this searched gene in stem-like cells from each diseased tissue sample relative to stem-like cells in normal samples in each tissue plotted against the malignancy continuum. Samples are colored based on if they are from different disease stage.
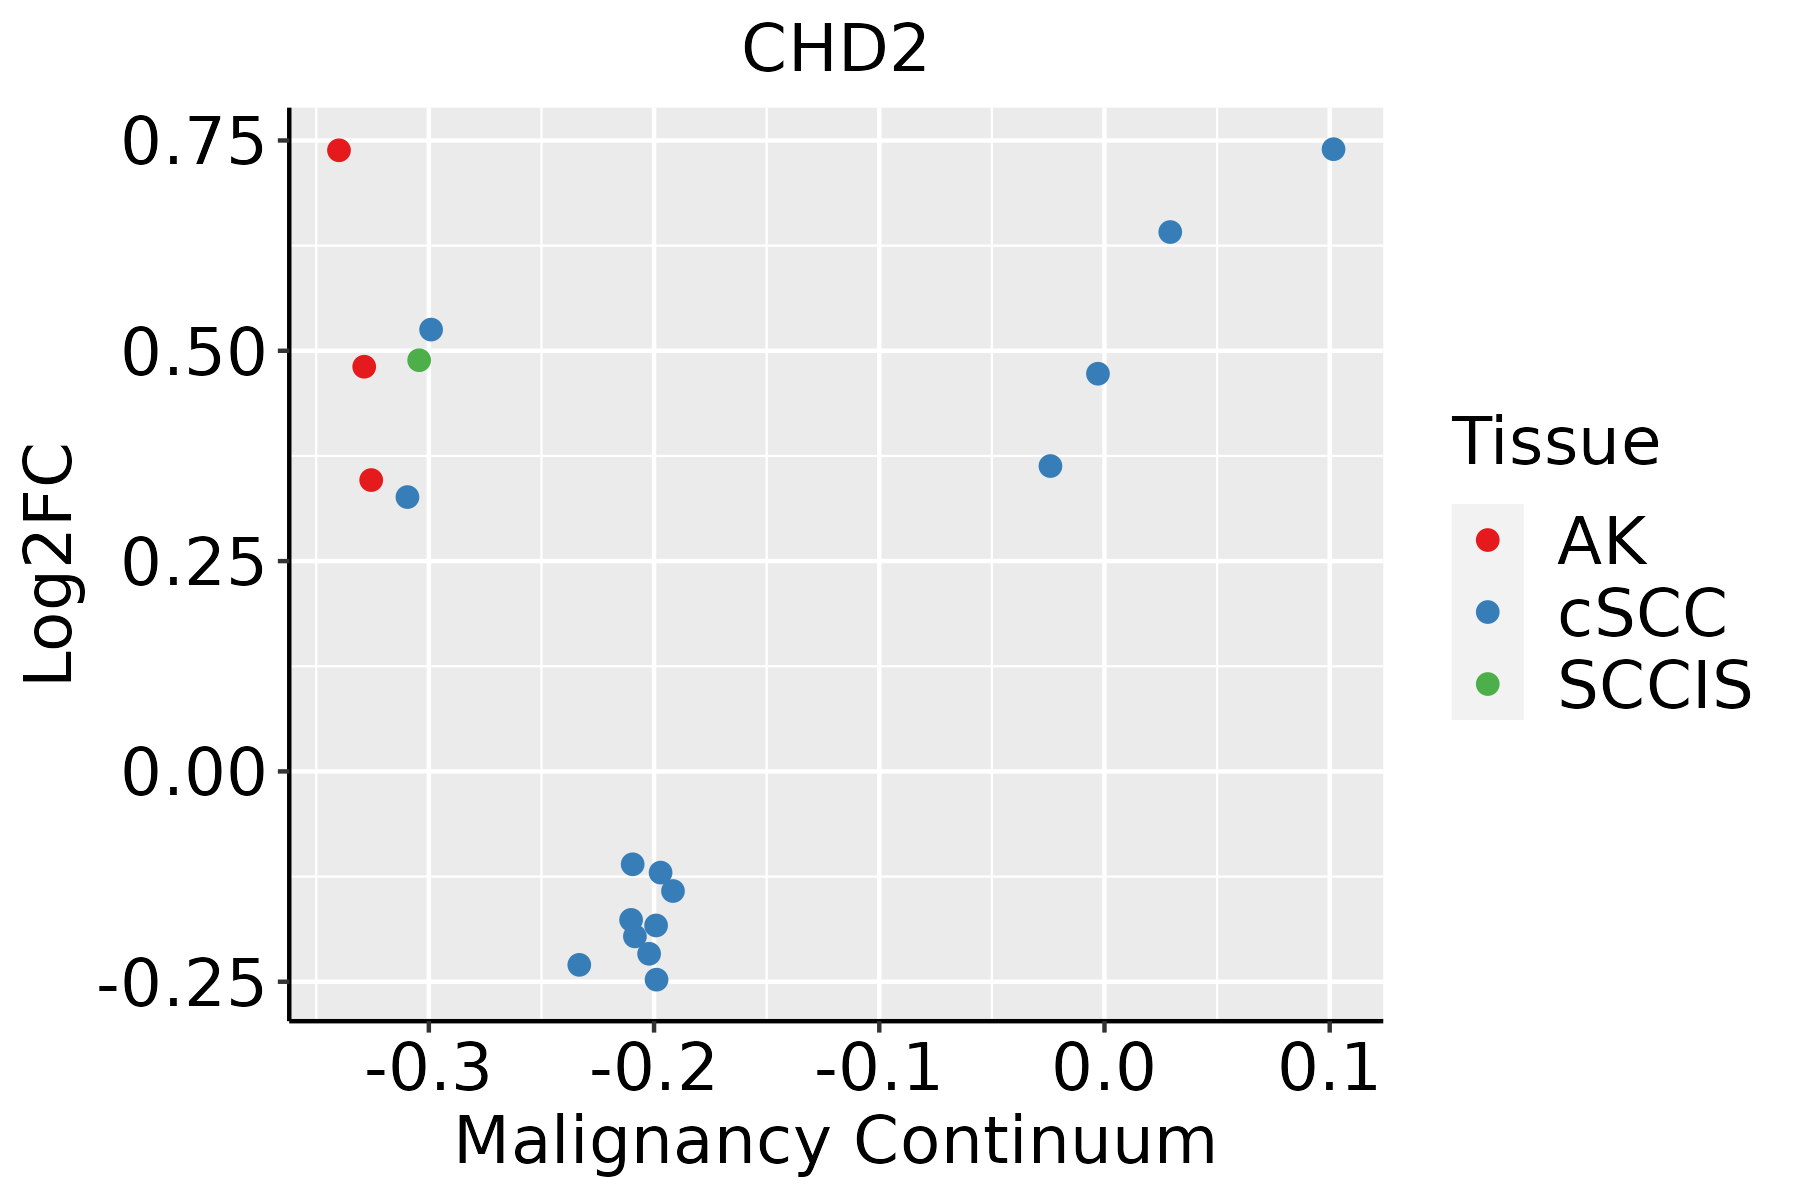
AK: Actinic keratosis
cSCC: Cutaneous squamous cell carcinoma
SCCIS:squamous cell carcinoma in situ
ThyroidThe image shows the transcriptomic changes along malignancy continuum.log2FC in expression of this searched gene in stem-like cells from each diseased tissue sample relative to stem-like cells in normal samples in each tissue plotted against the malignancy continuum. Samples are colored based on if they are from different disease stage.
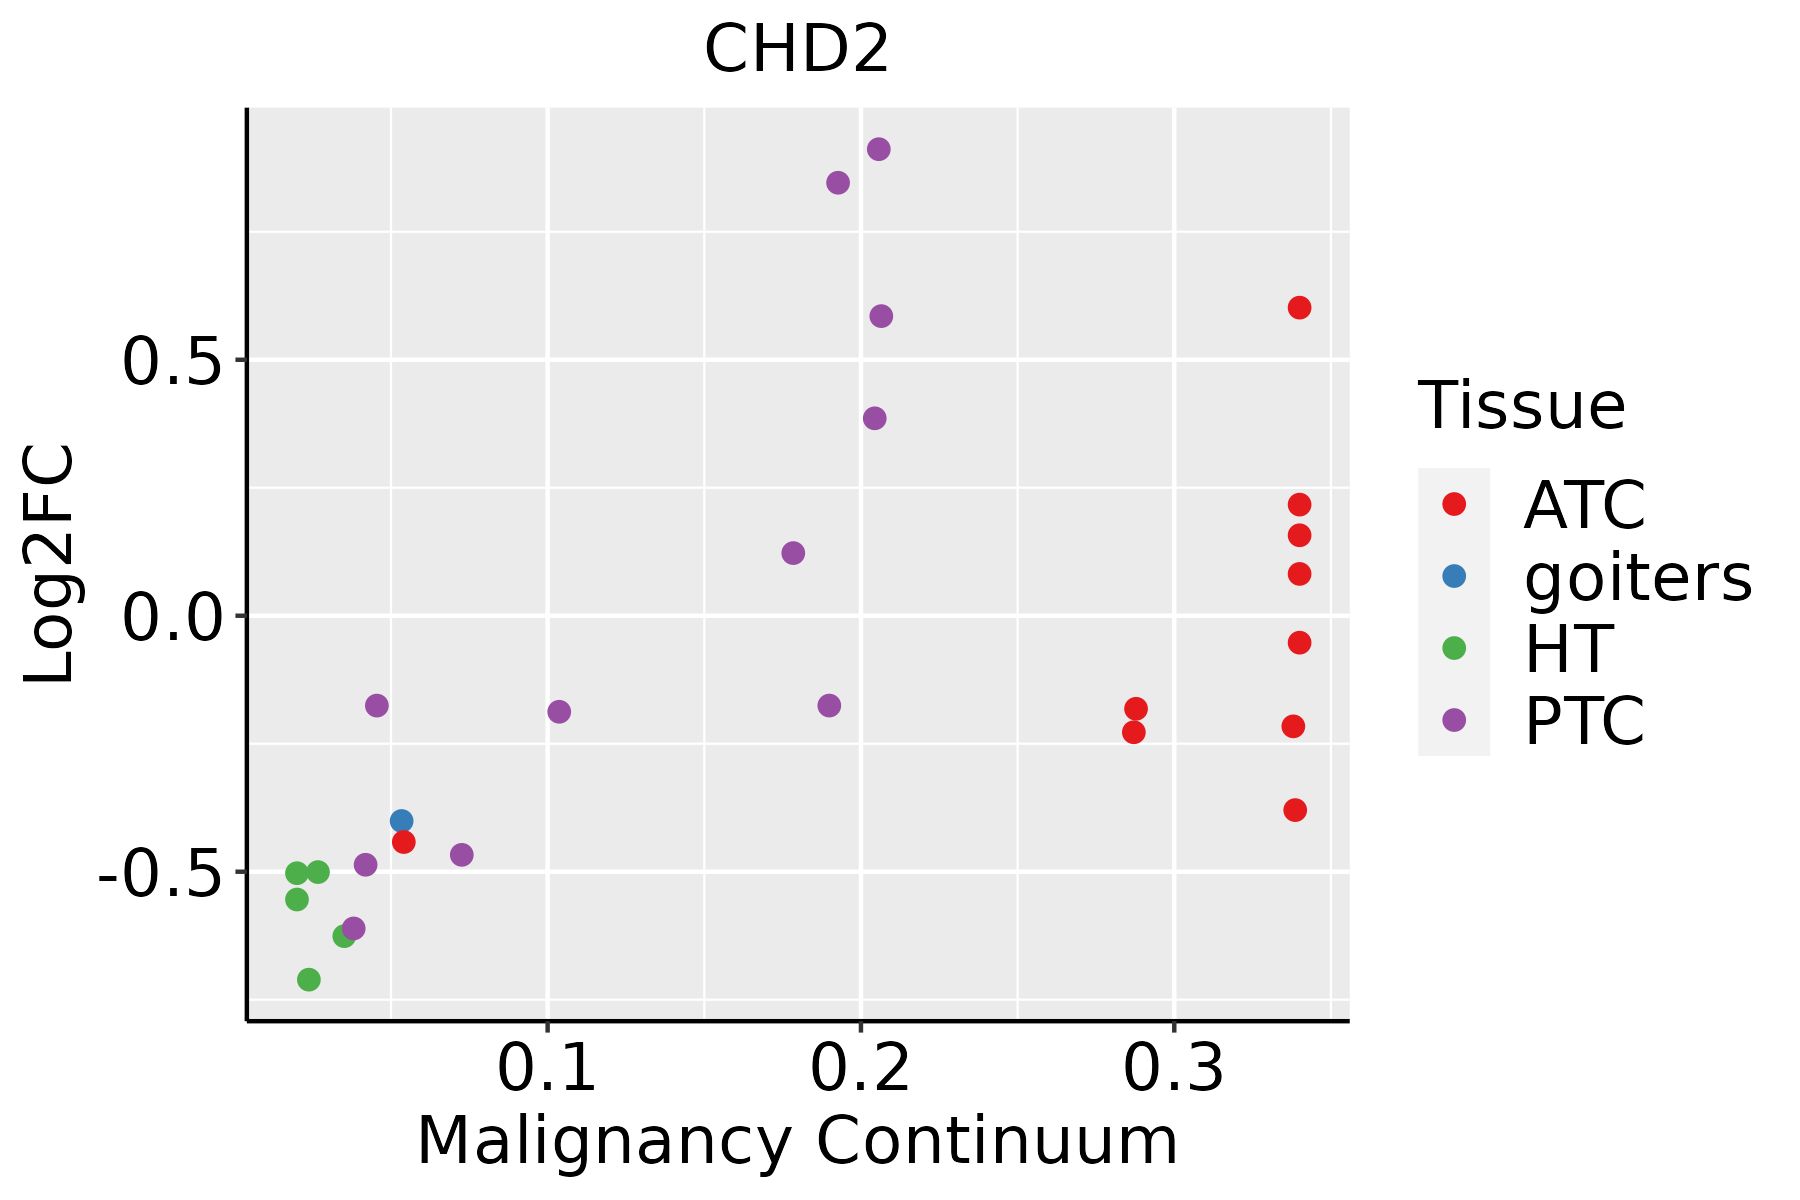
ATC: Anaplastic thyroid cancer
HT: Hashimoto's thyroiditis
PTC: Papillary thyroid cancer
∗log2FC in expression of this searched gene in stem-like cells from each diseased tissue sample relative to stem-like cells in normal samples in each tissue plotted against the malignancy continuum. Samples are colored based on if they are from different disease stage.

Top

Malignant transformation related pathway analysis

check buttonFind out the enriched GO biological processes and KEGG pathways involved in transition from healthy to precancer to cancer
check button Figure of enriched GO biological processes.
TissueDisease StageEnriched GO biological Processes
ColorectumADGO analysis - Figure of enriched GO biological processes: Top 15 enriched GO BP terms are showed in the bar plot of each disease state in each tissue. Each row represents a significant GO biological process which is colored according to the -log10(p.adjust).
ColorectumSERGO analysis - Figure of enriched GO biological processes: Top 15 enriched GO BP terms are showed in the bar plot of each disease state in each tissue. Each row represents a significant GO biological process which is colored according to the -log10(p.adjust).
ColorectumMSSGO analysis - Figure of enriched GO biological processes: Top 15 enriched GO BP terms are showed in the bar plot of each disease state in each tissue. Each row represents a significant GO biological process which is colored according to the -log10(p.adjust).
ColorectumMSI-HGO analysis - Figure of enriched GO biological processes: Top 15 enriched GO BP terms are showed in the bar plot of each disease state in each tissue. Each row represents a significant GO biological process which is colored according to the -log10(p.adjust).
ColorectumFAPGO analysis - Figure of enriched GO biological processes: Top 15 enriched GO BP terms are showed in the bar plot of each disease state in each tissue. Each row represents a significant GO biological process which is colored according to the -log10(p.adjust).
∗Top 15 enriched GO BP terms are showed in the bar plot of each disease state in each tissue. Each row represents a significant GO biological process which is colored according to the -log10(p.adjust).
Page: 1 2 3 4 5 6 7 8 9 

check button Enriched GO biological processes.
GO IDTissueDisease StageDescriptionGene RatioBg Ratiopvaluep.adjustCount
GO:00460349BreastPrecancerATP metabolic process82/1080277/187231.94e-365.19e-3382
GO:00061199BreastPrecanceroxidative phosphorylation53/1080141/187231.15e-292.04e-2653
GO:00090608BreastPrecanceraerobic respiration58/1080189/187235.69e-277.62e-2458
GO:00060918BreastPrecancergeneration of precursor metabolites and energy94/1080490/187231.54e-251.64e-2294
GO:00453338BreastPrecancercellular respiration59/1080230/187235.97e-235.32e-2059
GO:00159808BreastPrecancerenergy derivation by oxidation of organic compounds70/1080318/187238.33e-236.37e-2070
GO:00427738BreastPrecancerATP synthesis coupled electron transport35/108095/187231.08e-195.76e-1735
GO:00427758BreastPrecancermitochondrial ATP synthesis coupled electron transport35/108095/187231.08e-195.76e-1735
GO:00229048BreastPrecancerrespiratory electron transport chain35/1080114/187238.51e-173.26e-1435
GO:00229008BreastPrecancerelectron transport chain42/1080175/187231.37e-154.59e-1342
GO:00069799BreastPrecancerresponse to oxidative stress70/1080446/187231.59e-144.26e-1270
GO:00362939BreastPrecancerresponse to decreased oxygen levels53/1080322/187234.09e-126.84e-1053
GO:00016669BreastPrecancerresponse to hypoxia51/1080307/187237.33e-121.11e-0951
GO:00704829BreastPrecancerresponse to oxygen levels55/1080347/187237.47e-121.11e-0955
GO:00621979BreastPrecancercellular response to chemical stress51/1080337/187232.40e-102.34e-0851
GO:00362948BreastPrecancercellular response to decreased oxygen levels31/1080161/187232.61e-092.11e-0731
GO:00714538BreastPrecancercellular response to oxygen levels32/1080177/187237.32e-095.52e-0732
GO:00714565BreastPrecancercellular response to hypoxia29/1080151/187238.98e-096.50e-0729
GO:00345999BreastPrecancercellular response to oxidative stress42/1080288/187232.78e-081.79e-0642
GO:00434677BreastPrecancerregulation of generation of precursor metabolites and energy22/1080130/187234.95e-061.51e-0422
Page: 1 2 3 4 5 6 7 8 9 10 11 12 13 14 15 16 17 18 19 20 21 22 23 24 25 26 27 28 29 30 31 

check button Enriched KEGG pathways.
Pathway IDTissueDisease StageDescriptionGene RatioBg Ratiopvaluep.adjustqvalueCount
Page: 1 

Top

Cell-cell communication analysis

check buttonIdentification of potential cell-cell interactions between two cell types and their ligand-receptor pairs for different disease states
LigandReceptorLRpairPathwayTissueDisease Stage
Page: 1 

Top

Single-cell gene regulatory network inference analysis

check buttonFind out the significant the regulons (TFs) and the target genes of each regulon across cell types for different disease states
TFCell TypeTissueDisease StageTarget GeneRSSRegulon Activity
CHD2CD8TCMOral cavityADJPTPRC,RACK1,ELF1, etc.3.91e-01The dot plots of a searched regulon are shown for all cell subpopulations in each disease state of each tissue based on the regulon specific score inferred using pySCENIC and by calculating the average expression.
CHD2DUCT1PancreasHealthyRRBP1,RBM25,LUC7L3, etc.4.22e-01The dot plots of a searched regulon are shown for all cell subpopulations in each disease state of each tissue based on the regulon specific score inferred using pySCENIC and by calculating the average expression.
CHD2CD8TRMPancreasPDACLINC01578,HNRNPC,SIK3, etc.1.74e-01The dot plots of a searched regulon are shown for all cell subpopulations in each disease state of each tissue based on the regulon specific score inferred using pySCENIC and by calculating the average expression.
∗The dot plots of a searched regulon are shown for all cell subpopulations in each disease state of each tissue based on the regulon specific score inferred using pySCENIC and by calculating the average expression.
Page: 1 

Top

Somatic mutation of malignant transformation related genes

check buttonAnnotation of somatic variants for genes involved in malignant transformation
Hugo SymbolVariant ClassVariant ClassificationdbSNP RSHGVScHGVSpHGVSp ShortSWISSPROTBIOTYPESIFTPolyPhenTumor Sample BarcodeTissueHistologySexAgeStageTherapy TypesDrugsOutcome
CHD2SNVMissense_Mutationnovelc.4091N>Tp.Ser1364Leup.S1364LO14647protein_codingtolerated(0.06)benign(0.04)TCGA-5L-AAT1-01Breastbreast invasive carcinomaFemale<65III/IVHormone TherapyletrozolSD
CHD2SNVMissense_Mutationnovelc.2893N>Gp.Lys965Glup.K965EO14647protein_codingdeleterious(0)probably_damaging(0.952)TCGA-A2-A3Y0-01Breastbreast invasive carcinomaFemale<65I/IIChemotherapyadriamycinCR
CHD2SNVMissense_Mutationrs769085842c.5329C>Gp.Leu1777Valp.L1777VO14647protein_codingtolerated_low_confidence(0.11)benign(0.001)TCGA-AC-A23H-01Breastbreast invasive carcinomaFemale>=65I/IIUnknownUnknownPD
CHD2SNVMissense_Mutationnovelc.362G>Ap.Arg121Glnp.R121QO14647protein_codingdeleterious(0.03)probably_damaging(0.978)TCGA-AN-A046-01Breastbreast invasive carcinomaFemale>=65I/IIUnknownUnknownSD
CHD2SNVMissense_Mutationnovelc.1696G>Ap.Gly566Serp.G566SO14647protein_codingdeleterious(0.03)probably_damaging(1)TCGA-AN-A046-01Breastbreast invasive carcinomaFemale>=65I/IIUnknownUnknownSD
CHD2SNVMissense_Mutationc.2855A>Gp.Glu952Glyp.E952GO14647protein_codingtolerated(0.07)benign(0.01)TCGA-AN-A0AS-01Breastbreast invasive carcinomaFemale>=65III/IVUnknownUnknownSD
CHD2SNVMissense_Mutationnovelc.569N>Ap.Arg190Hisp.R190HO14647protein_codingtolerated(0.06)benign(0.026)TCGA-AO-A128-01Breastbreast invasive carcinomaFemale<65I/IIChemotherapydoxorubicinSD
CHD2SNVMissense_Mutationnovelc.2125N>Tp.Leu709Phep.L709FO14647protein_codingdeleterious(0)probably_damaging(0.99)TCGA-BH-A2L8-01Breastbreast invasive carcinomaFemale<65I/IIChemotherapycytoxanCR
CHD2SNVMissense_Mutationrs748103788c.3752G>Ap.Arg1251Hisp.R1251HO14647protein_codingtolerated(0.74)benign(0.007)TCGA-D8-A1JL-01Breastbreast invasive carcinomaFemale>=65I/IIUnknownUnknownSD
CHD2SNVMissense_Mutationnovelc.5372N>Tp.Pro1791Leup.P1791LO14647protein_codingtolerated_low_confidence(0.23)benign(0.003)TCGA-LL-A441-01Breastbreast invasive carcinomaFemale<65I/IIChemotherapytaxotereCR
Page: 1 2 3 4 5 6 7 8 9 10 11 12 13 14 15 16 17 18 19 20 

Top

Related drugs of malignant transformation related genes

check buttonIdentification of chemicals and drugs interact with genes involved in malignant transfromation
(DGIdb 4.0)
Entrez IDSymbolCategoryInteraction TypesDrug Claim NameDrug NamePMIDs
Page: 1