
|
|||||
|
 | |
| |
| |
| |
| |
| |
|
Gene: CHCHD6 |
Gene summary for CHCHD6 |
| Gene information | Species | Human | Gene symbol | CHCHD6 | Gene ID | 84303 |
| Gene name | coiled-coil-helix-coiled-coil-helix domain containing 6 | |
| Gene Alias | CHCM1 | |
| Cytomap | 3q21.3 | |
| Gene Type | protein-coding | GO ID | GO:0006950 | UniProtAcc | Q9BRQ6 |
Top |
Malignant transformation analysis |
| Identification of the aberrant gene expression in precancerous and cancerous lesions by comparing the gene expression of stem-like cells in diseased tissues with normal stem cells |
| Entrez ID | Symbol | Replicates | Species | Organ | Tissue | Adj P-value | Log2FC | Malignancy |
| 84303 | CHCHD6 | LZE2T | Human | Esophagus | ESCC | 2.47e-02 | 3.71e-01 | 0.082 |
| 84303 | CHCHD6 | LZE4T | Human | Esophagus | ESCC | 3.37e-11 | 2.83e-01 | 0.0811 |
| 84303 | CHCHD6 | LZE7T | Human | Esophagus | ESCC | 3.13e-14 | 6.55e-01 | 0.0667 |
| 84303 | CHCHD6 | LZE8T | Human | Esophagus | ESCC | 6.82e-04 | 1.68e-01 | 0.067 |
| 84303 | CHCHD6 | LZE24T | Human | Esophagus | ESCC | 8.22e-17 | 3.53e-01 | 0.0596 |
| 84303 | CHCHD6 | LZE6T | Human | Esophagus | ESCC | 6.64e-14 | 5.10e-01 | 0.0845 |
| 84303 | CHCHD6 | P1T-E | Human | Esophagus | ESCC | 4.79e-12 | 3.21e-01 | 0.0875 |
| 84303 | CHCHD6 | P2T-E | Human | Esophagus | ESCC | 2.23e-27 | 4.35e-01 | 0.1177 |
| 84303 | CHCHD6 | P4T-E | Human | Esophagus | ESCC | 1.20e-21 | 3.25e-01 | 0.1323 |
| 84303 | CHCHD6 | P5T-E | Human | Esophagus | ESCC | 1.30e-23 | 4.02e-01 | 0.1327 |
| 84303 | CHCHD6 | P8T-E | Human | Esophagus | ESCC | 5.31e-22 | 4.57e-01 | 0.0889 |
| 84303 | CHCHD6 | P9T-E | Human | Esophagus | ESCC | 4.54e-09 | 2.40e-01 | 0.1131 |
| 84303 | CHCHD6 | P10T-E | Human | Esophagus | ESCC | 4.20e-66 | 1.45e+00 | 0.116 |
| 84303 | CHCHD6 | P11T-E | Human | Esophagus | ESCC | 8.86e-16 | 4.83e-01 | 0.1426 |
| 84303 | CHCHD6 | P12T-E | Human | Esophagus | ESCC | 1.09e-20 | 3.81e-01 | 0.1122 |
| 84303 | CHCHD6 | P15T-E | Human | Esophagus | ESCC | 2.02e-24 | 4.87e-01 | 0.1149 |
| 84303 | CHCHD6 | P16T-E | Human | Esophagus | ESCC | 1.52e-30 | 5.61e-01 | 0.1153 |
| 84303 | CHCHD6 | P17T-E | Human | Esophagus | ESCC | 3.92e-07 | 3.57e-01 | 0.1278 |
| 84303 | CHCHD6 | P20T-E | Human | Esophagus | ESCC | 1.15e-26 | 4.30e-01 | 0.1124 |
| 84303 | CHCHD6 | P21T-E | Human | Esophagus | ESCC | 1.59e-16 | 3.94e-01 | 0.1617 |
| Page: 1 2 3 4 5 |
| Tissue | Expression Dynamics | Abbreviation |
| Esophagus | 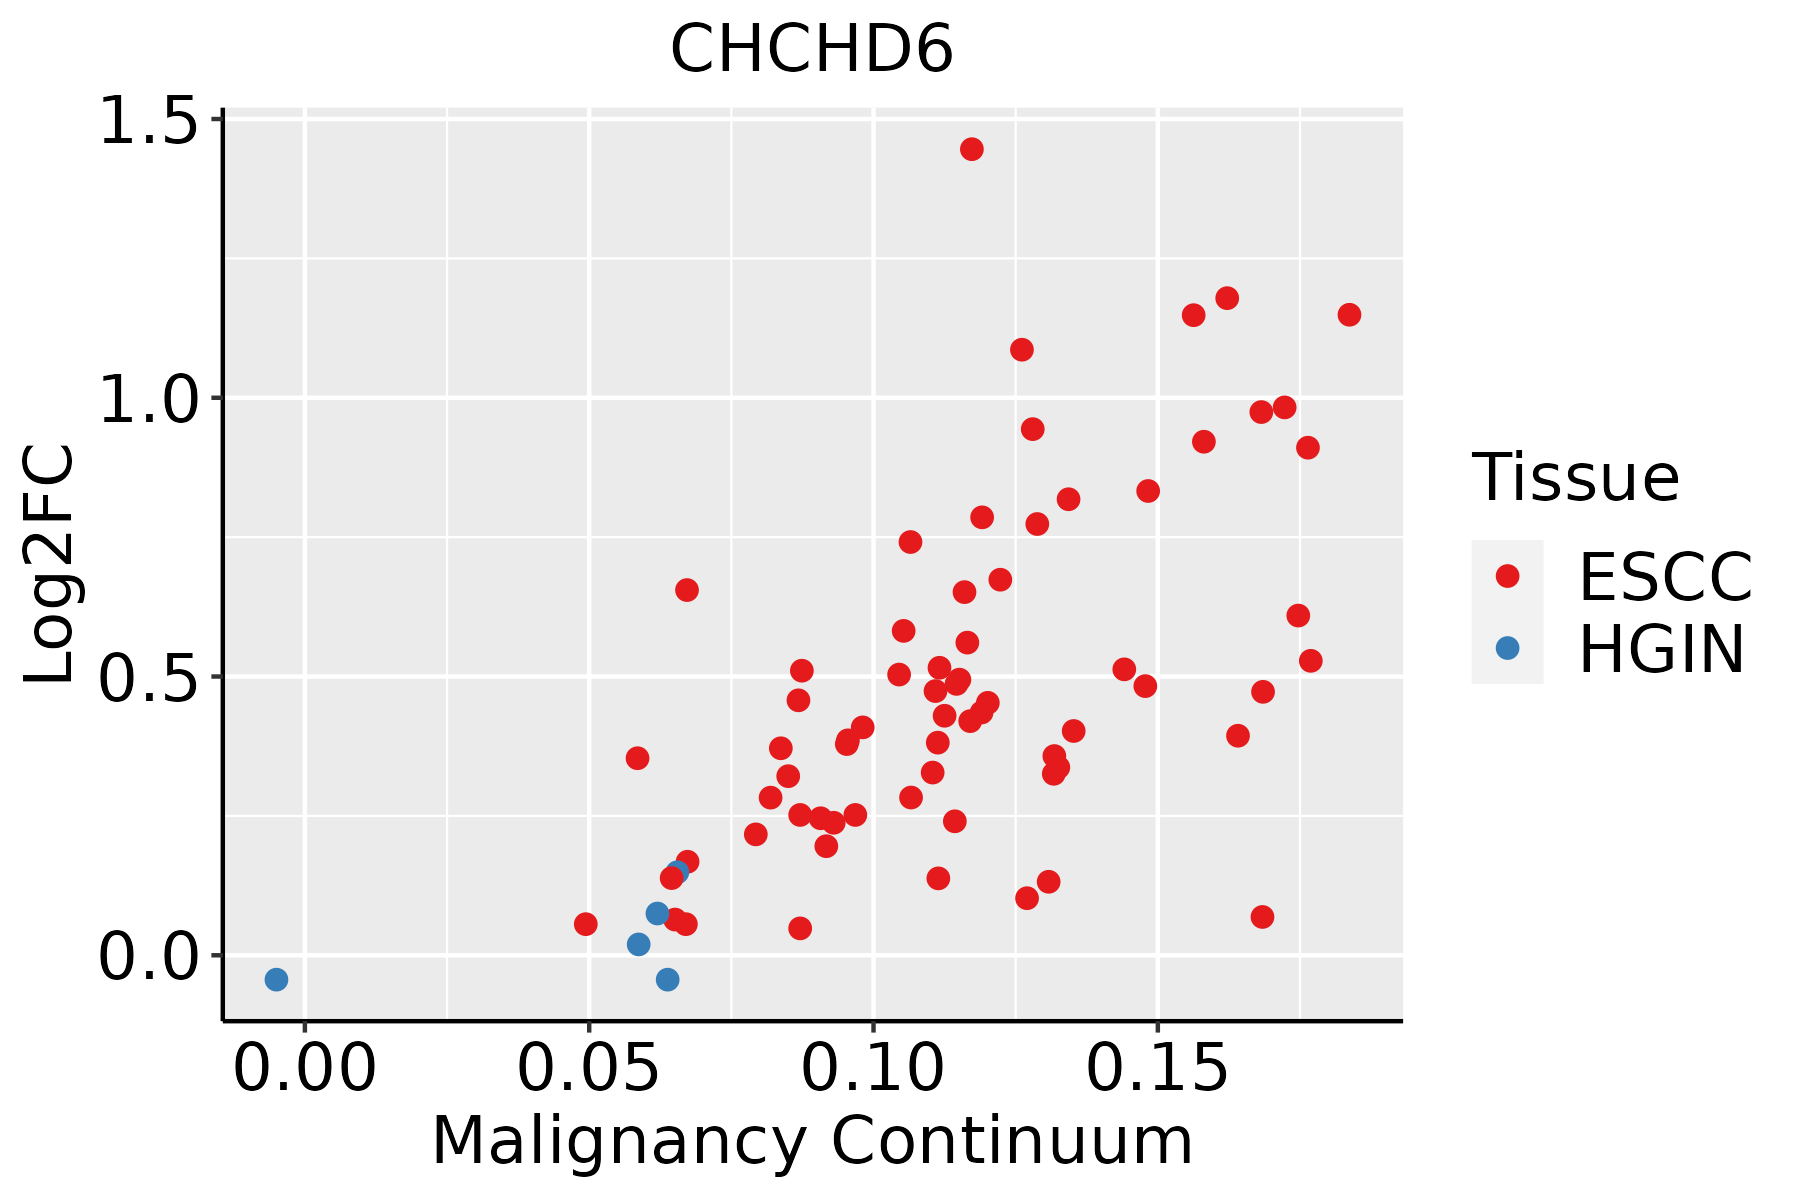 | ESCC: Esophageal squamous cell carcinoma |
| HGIN: High-grade intraepithelial neoplasias | ||
| LGIN: Low-grade intraepithelial neoplasias | ||
| Liver | 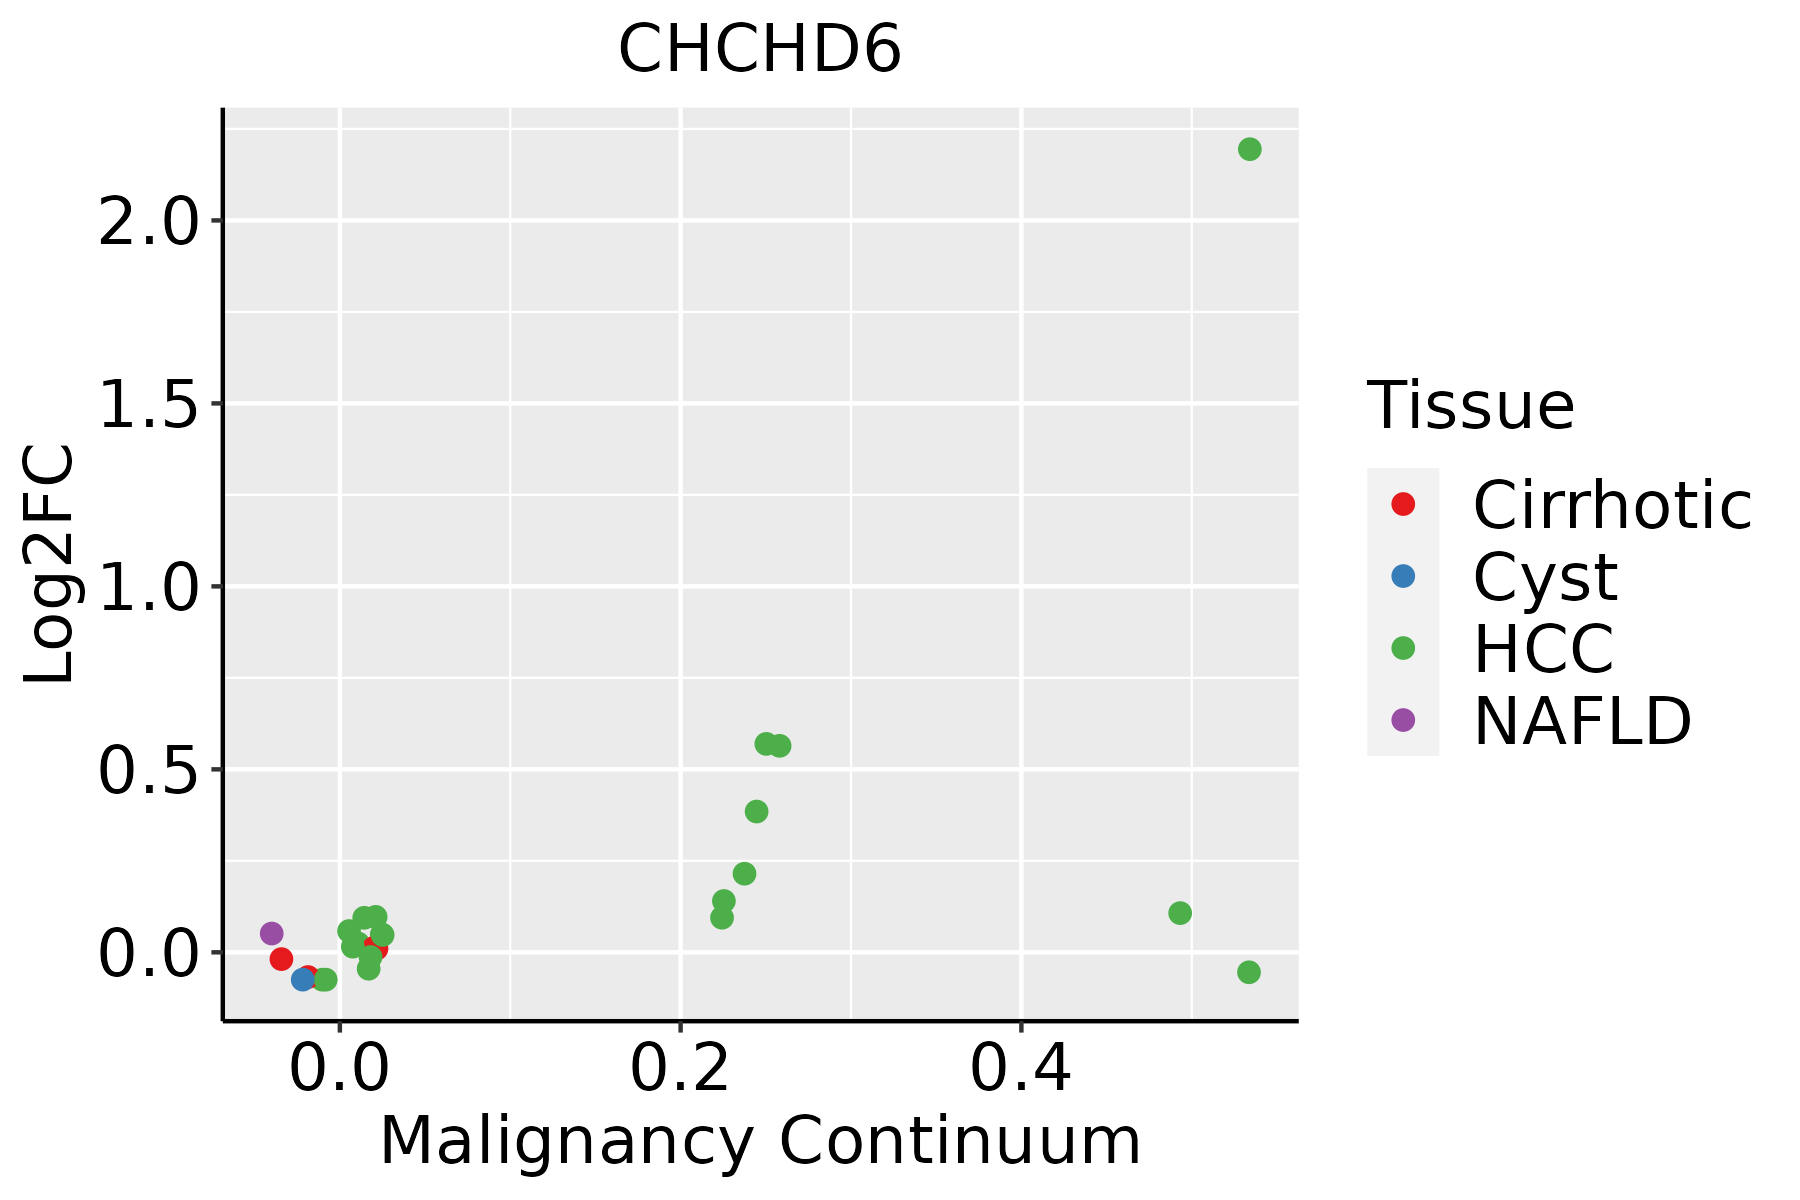 | HCC: Hepatocellular carcinoma |
| NAFLD: Non-alcoholic fatty liver disease | ||
| Oral Cavity | 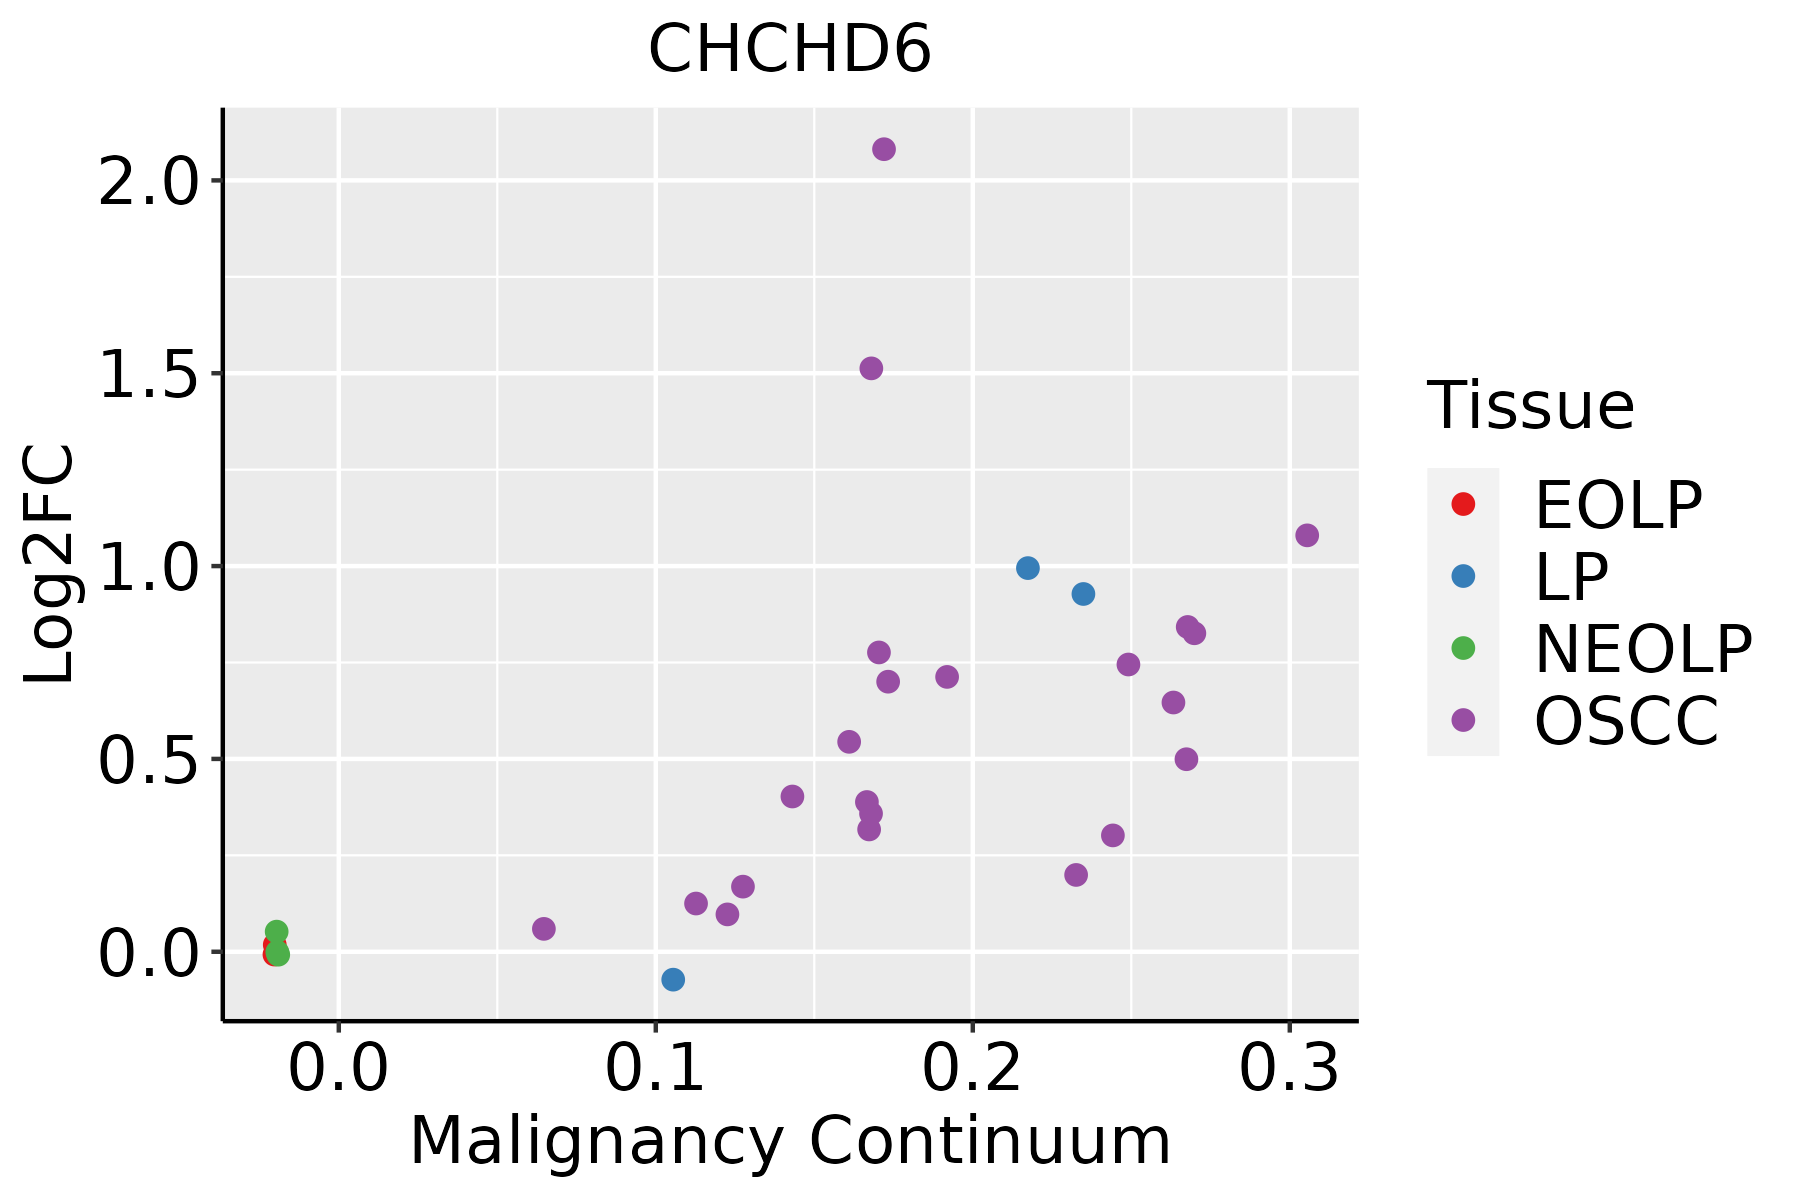 | EOLP: Erosive Oral lichen planus |
| LP: leukoplakia | ||
| NEOLP: Non-erosive oral lichen planus | ||
| OSCC: Oral squamous cell carcinoma |
| ∗log2FC in expression of this searched gene in stem-like cells from each diseased tissue sample relative to stem-like cells in normal samples in each tissue plotted against the malignancy continuum. Samples are colored based on if they are from different disease stage. |
Top |
Malignant transformation related pathway analysis |
| Find out the enriched GO biological processes and KEGG pathways involved in transition from healthy to precancer to cancer |
| Tissue | Disease Stage | Enriched GO biological Processes |
| Colorectum | AD |  |
| Colorectum | SER |  |
| Colorectum | MSS |  |
| Colorectum | MSI-H |  |
| Colorectum | FAP |  |
| ∗Top 15 enriched GO BP terms are showed in the bar plot of each disease state in each tissue. Each row represents a significant GO biological process which is colored according to the -log10(p.adjust). |
| Page: 1 2 3 4 5 6 7 8 9 |
| GO ID | Tissue | Disease Stage | Description | Gene Ratio | Bg Ratio | pvalue | p.adjust | Count |
| GO:000700619 | Esophagus | ESCC | mitochondrial membrane organization | 93/8552 | 116/18723 | 2.16e-14 | 1.11e-12 | 93 |
| GO:000700713 | Esophagus | ESCC | inner mitochondrial membrane organization | 31/8552 | 38/18723 | 5.93e-06 | 6.10e-05 | 31 |
| GO:00424072 | Esophagus | ESCC | cristae formation | 13/8552 | 16/18723 | 4.05e-03 | 1.62e-02 | 13 |
| GO:000700612 | Liver | HCC | mitochondrial membrane organization | 80/7958 | 116/18723 | 7.09e-09 | 1.81e-07 | 80 |
| GO:000700711 | Liver | HCC | inner mitochondrial membrane organization | 28/7958 | 38/18723 | 9.60e-05 | 8.34e-04 | 28 |
| GO:0042407 | Liver | HCC | cristae formation | 12/7958 | 16/18723 | 8.74e-03 | 3.40e-02 | 12 |
| GO:000700610 | Oral cavity | OSCC | mitochondrial membrane organization | 85/7305 | 116/18723 | 6.29e-14 | 3.40e-12 | 85 |
| GO:00070075 | Oral cavity | OSCC | inner mitochondrial membrane organization | 27/7305 | 38/18723 | 6.23e-05 | 5.08e-04 | 27 |
| GO:00424071 | Oral cavity | OSCC | cristae formation | 12/7305 | 16/18723 | 3.83e-03 | 1.57e-02 | 12 |
| GO:000700617 | Oral cavity | LP | mitochondrial membrane organization | 61/4623 | 116/18723 | 9.44e-11 | 5.63e-09 | 61 |
| GO:000700712 | Oral cavity | LP | inner mitochondrial membrane organization | 19/4623 | 38/18723 | 6.54e-04 | 5.92e-03 | 19 |
| Page: 1 |
| Pathway ID | Tissue | Disease Stage | Description | Gene Ratio | Bg Ratio | pvalue | p.adjust | qvalue | Count |
| Page: 1 |
Top |
Cell-cell communication analysis |
| Identification of potential cell-cell interactions between two cell types and their ligand-receptor pairs for different disease states |
| Ligand | Receptor | LRpair | Pathway | Tissue | Disease Stage |
| Page: 1 |
Top |
Single-cell gene regulatory network inference analysis |
| Find out the significant the regulons (TFs) and the target genes of each regulon across cell types for different disease states |
| TF | Cell Type | Tissue | Disease Stage | Target Gene | RSS | Regulon Activity |
| ∗The dot plots of a searched regulon are shown for all cell subpopulations in each disease state of each tissue based on the regulon specific score inferred using pySCENIC and by calculating the average expression. |
| Page: 1 |
Top |
Somatic mutation of malignant transformation related genes |
| Annotation of somatic variants for genes involved in malignant transformation |
| Hugo Symbol | Variant Class | Variant Classification | dbSNP RS | HGVSc | HGVSp | HGVSp Short | SWISSPROT | BIOTYPE | SIFT | PolyPhen | Tumor Sample Barcode | Tissue | Histology | Sex | Age | Stage | Therapy Types | Drugs | Outcome |
| CHCHD6 | SNV | Missense_Mutation | rs769197281 | c.94N>A | p.Glu32Lys | p.E32K | Q9BRQ6 | protein_coding | deleterious(0) | probably_damaging(0.909) | TCGA-BH-A0W4-01 | Breast | breast invasive carcinoma | Female | <65 | I/II | Unknown | Unknown | SD |
| CHCHD6 | SNV | Missense_Mutation | novel | c.498N>G | p.Asn166Lys | p.N166K | Q9BRQ6 | protein_coding | deleterious(0.02) | possibly_damaging(0.511) | TCGA-OL-A5RZ-01 | Breast | breast invasive carcinoma | Female | <65 | I/II | Chemotherapy | doxorubicin | CR |
| CHCHD6 | SNV | Missense_Mutation | novel | c.590N>A | p.Cys197Tyr | p.C197Y | Q9BRQ6 | protein_coding | deleterious(0) | probably_damaging(0.994) | TCGA-S3-AA11-01 | Breast | breast invasive carcinoma | Female | >=65 | I/II | Hormone Therapy | letrozole | CR |
| CHCHD6 | SNV | Missense_Mutation | c.110G>A | p.Arg37His | p.R37H | Q9BRQ6 | protein_coding | deleterious(0) | probably_damaging(1) | TCGA-2W-A8YY-01 | Cervix | cervical & endocervical cancer | Female | <65 | I/II | Chemotherapy | cisplatin | CR | |
| CHCHD6 | SNV | Missense_Mutation | novel | c.61N>T | p.Arg21Trp | p.R21W | Q9BRQ6 | protein_coding | deleterious(0) | probably_damaging(0.999) | TCGA-AA-3947-01 | Colorectum | colon adenocarcinoma | Female | <65 | I/II | Unknown | Unknown | SD |
| CHCHD6 | SNV | Missense_Mutation | novel | c.295N>A | p.Asp99Asn | p.D99N | Q9BRQ6 | protein_coding | deleterious(0.01) | possibly_damaging(0.659) | TCGA-AA-3977-01 | Colorectum | colon adenocarcinoma | Male | >=65 | I/II | Unknown | Unknown | SD |
| CHCHD6 | SNV | Missense_Mutation | rs779753384 | c.631N>T | p.Arg211Cys | p.R211C | Q9BRQ6 | protein_coding | deleterious(0) | possibly_damaging(0.613) | TCGA-AA-A00N-01 | Colorectum | colon adenocarcinoma | Male | >=65 | I/II | Unknown | Unknown | PD |
| CHCHD6 | SNV | Missense_Mutation | c.538N>T | p.Ala180Ser | p.A180S | Q9BRQ6 | protein_coding | deleterious(0.01) | probably_damaging(0.996) | TCGA-AG-A036-01 | Colorectum | rectum adenocarcinoma | Male | >=65 | III/IV | Chemotherapy | 5-fluorouracil | CR | |
| CHCHD6 | SNV | Missense_Mutation | novel | c.302N>G | p.Leu101Arg | p.L101R | Q9BRQ6 | protein_coding | deleterious(0) | probably_damaging(0.993) | TCGA-A5-A0G1-01 | Endometrium | uterine corpus endometrioid carcinoma | Female | >=65 | I/II | Unknown | Unknown | SD |
| CHCHD6 | SNV | Missense_Mutation | novel | c.499N>A | p.Ala167Thr | p.A167T | Q9BRQ6 | protein_coding | deleterious(0.02) | benign(0.091) | TCGA-AJ-A3BH-01 | Endometrium | uterine corpus endometrioid carcinoma | Female | Unknown | I/II | Unknown | Unknown | SD |
| Page: 1 2 3 |
Top |
Related drugs of malignant transformation related genes |
| Identification of chemicals and drugs interact with genes involved in malignant transfromation |
| (DGIdb 4.0) |
| Entrez ID | Symbol | Category | Interaction Types | Drug Claim Name | Drug Name | PMIDs |
| Page: 1 |

Copyright 2023-Present -The University of Texas Health Science Center at Houston |