
|
|||||
|
 | |
| |
| |
| |
| |
| |
|
Gene: CHCHD5 |
Gene summary for CHCHD5 |
| Gene information | Species | Human | Gene symbol | CHCHD5 | Gene ID | 84269 |
| Gene name | coiled-coil-helix-coiled-coil-helix domain containing 5 | |
| Gene Alias | C2orf9 | |
| Cytomap | 2q14.1 | |
| Gene Type | protein-coding | GO ID | GO:0008150 | UniProtAcc | Q9BSY4 |
Top |
Malignant transformation analysis |
| Identification of the aberrant gene expression in precancerous and cancerous lesions by comparing the gene expression of stem-like cells in diseased tissues with normal stem cells |
| Entrez ID | Symbol | Replicates | Species | Organ | Tissue | Adj P-value | Log2FC | Malignancy |
| 84269 | CHCHD5 | GSM4909293 | Human | Breast | IDC | 2.62e-03 | 1.68e-01 | 0.1581 |
| 84269 | CHCHD5 | GSM4909296 | Human | Breast | IDC | 1.48e-05 | 1.65e-01 | 0.1524 |
| 84269 | CHCHD5 | GSM4909297 | Human | Breast | IDC | 5.92e-03 | 5.68e-02 | 0.1517 |
| 84269 | CHCHD5 | GSM4909301 | Human | Breast | IDC | 3.41e-11 | 5.28e-01 | 0.1577 |
| 84269 | CHCHD5 | GSM4909304 | Human | Breast | IDC | 4.95e-11 | 4.36e-01 | 0.1636 |
| 84269 | CHCHD5 | GSM4909306 | Human | Breast | IDC | 3.68e-12 | 4.61e-01 | 0.1564 |
| 84269 | CHCHD5 | GSM4909311 | Human | Breast | IDC | 1.40e-16 | 7.34e-02 | 0.1534 |
| 84269 | CHCHD5 | GSM4909312 | Human | Breast | IDC | 8.38e-04 | 1.34e-01 | 0.1552 |
| 84269 | CHCHD5 | GSM4909313 | Human | Breast | IDC | 4.60e-02 | 2.61e-01 | 0.0391 |
| 84269 | CHCHD5 | GSM4909319 | Human | Breast | IDC | 5.48e-20 | 2.05e-02 | 0.1563 |
| 84269 | CHCHD5 | GSM4909321 | Human | Breast | IDC | 1.93e-05 | 1.82e-01 | 0.1559 |
| 84269 | CHCHD5 | NCCBC14 | Human | Breast | DCIS | 5.81e-04 | 1.87e-01 | 0.2021 |
| 84269 | CHCHD5 | P1 | Human | Breast | IDC | 3.05e-06 | -1.24e-01 | 0.1527 |
| 84269 | CHCHD5 | DCIS2 | Human | Breast | DCIS | 6.47e-54 | 7.21e-02 | 0.0085 |
| 84269 | CHCHD5 | LZE2T | Human | Esophagus | ESCC | 1.10e-03 | 5.71e-01 | 0.082 |
| 84269 | CHCHD5 | LZE3D | Human | Esophagus | HGIN | 4.89e-02 | 5.54e-01 | 0.0668 |
| 84269 | CHCHD5 | LZE4T | Human | Esophagus | ESCC | 3.25e-17 | 5.21e-01 | 0.0811 |
| 84269 | CHCHD5 | LZE5T | Human | Esophagus | ESCC | 2.05e-07 | 5.71e-01 | 0.0514 |
| 84269 | CHCHD5 | LZE7T | Human | Esophagus | ESCC | 1.34e-10 | 6.74e-01 | 0.0667 |
| 84269 | CHCHD5 | LZE8T | Human | Esophagus | ESCC | 1.24e-08 | 3.56e-01 | 0.067 |
| Page: 1 2 3 4 5 6 7 8 9 |
| Tissue | Expression Dynamics | Abbreviation |
| Breast | 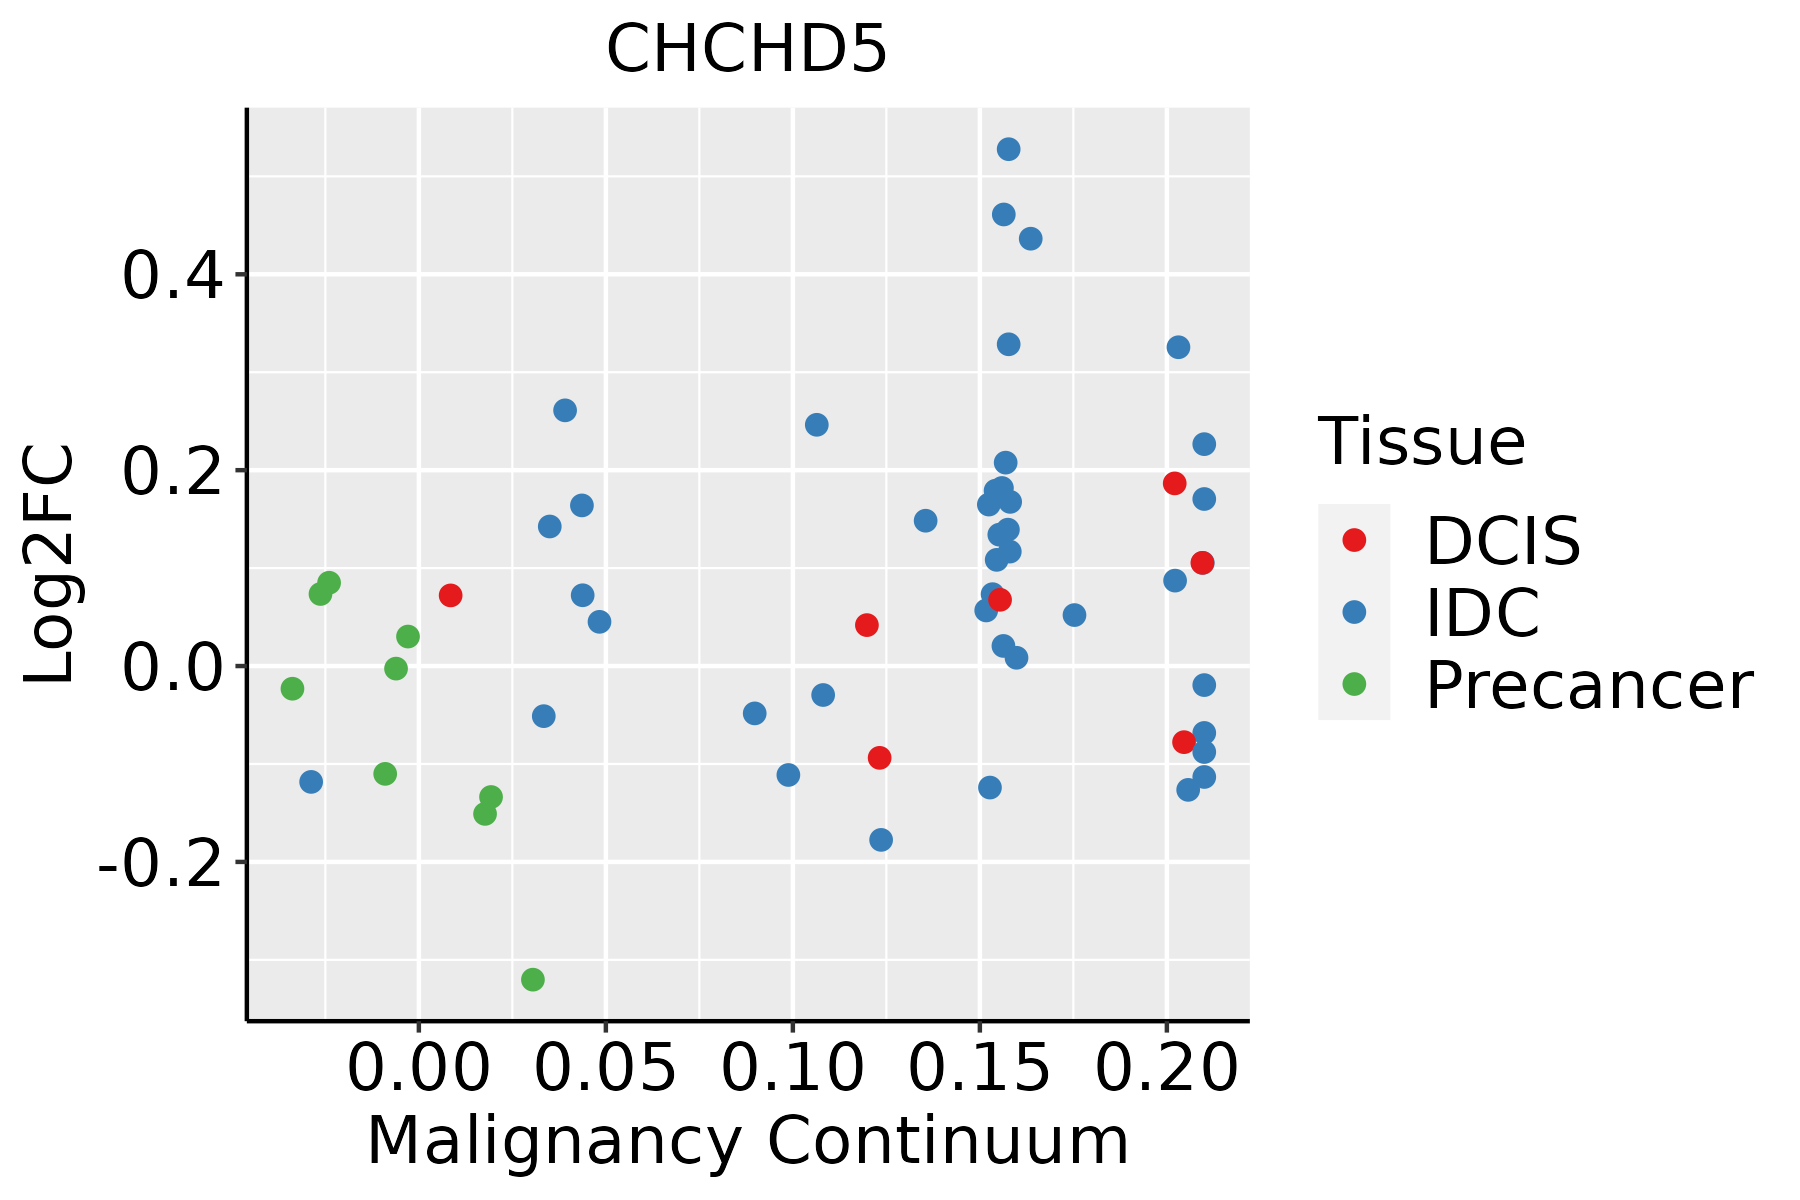 | IDC: Invasive ductal carcinoma |
| DCIS: Ductal carcinoma in situ | ||
| Precancer(BRCA1-mut): Precancerous lesion from BRCA1 mutation carriers | ||
| Esophagus | 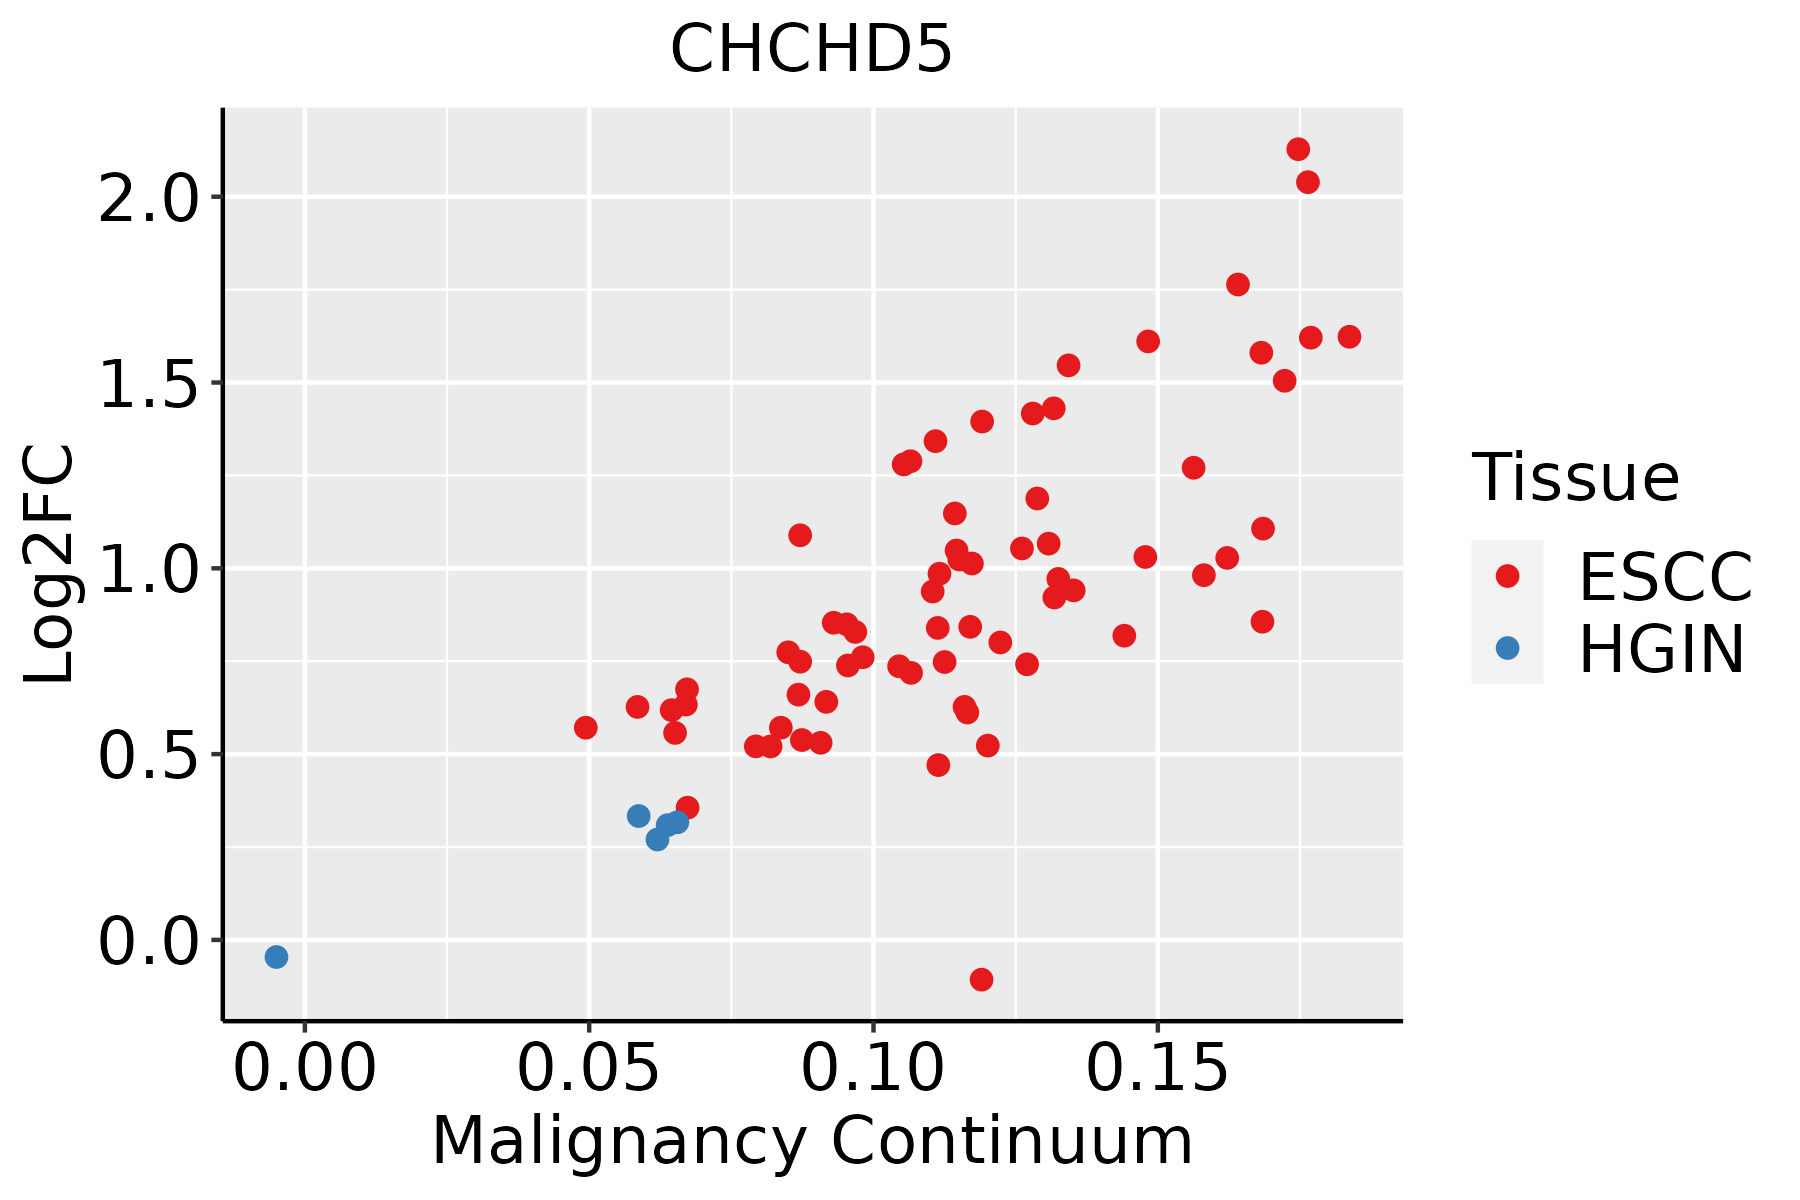 | ESCC: Esophageal squamous cell carcinoma |
| HGIN: High-grade intraepithelial neoplasias | ||
| LGIN: Low-grade intraepithelial neoplasias | ||
| GC | 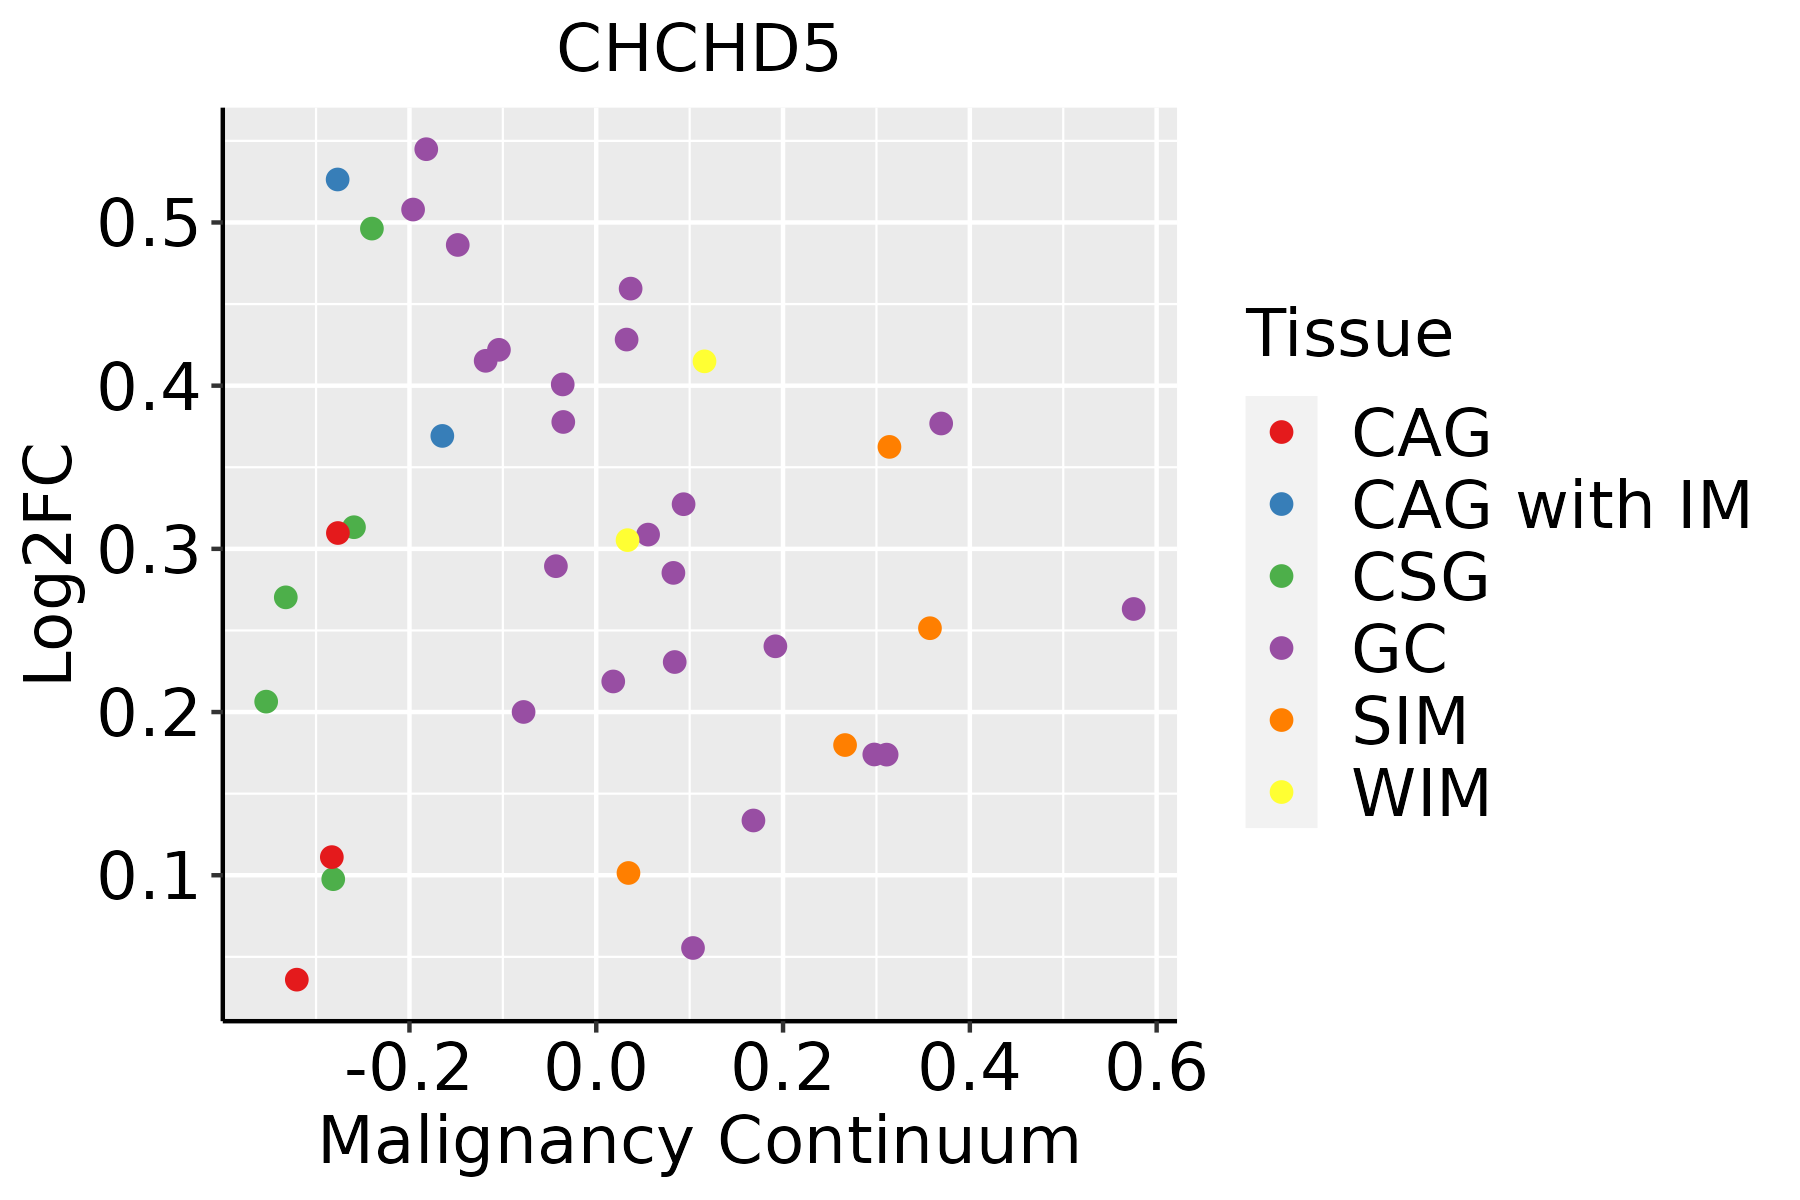 | CAG: Chronic atrophic gastritis |
| CAG with IM: Chronic atrophic gastritis with intestinal metaplasia | ||
| CSG: Chronic superficial gastritis | ||
| GC: Gastric cancer | ||
| SIM: Severe intestinal metaplasia | ||
| WIM: Wild intestinal metaplasia | ||
| Liver |  | HCC: Hepatocellular carcinoma |
| NAFLD: Non-alcoholic fatty liver disease | ||
| Oral Cavity | 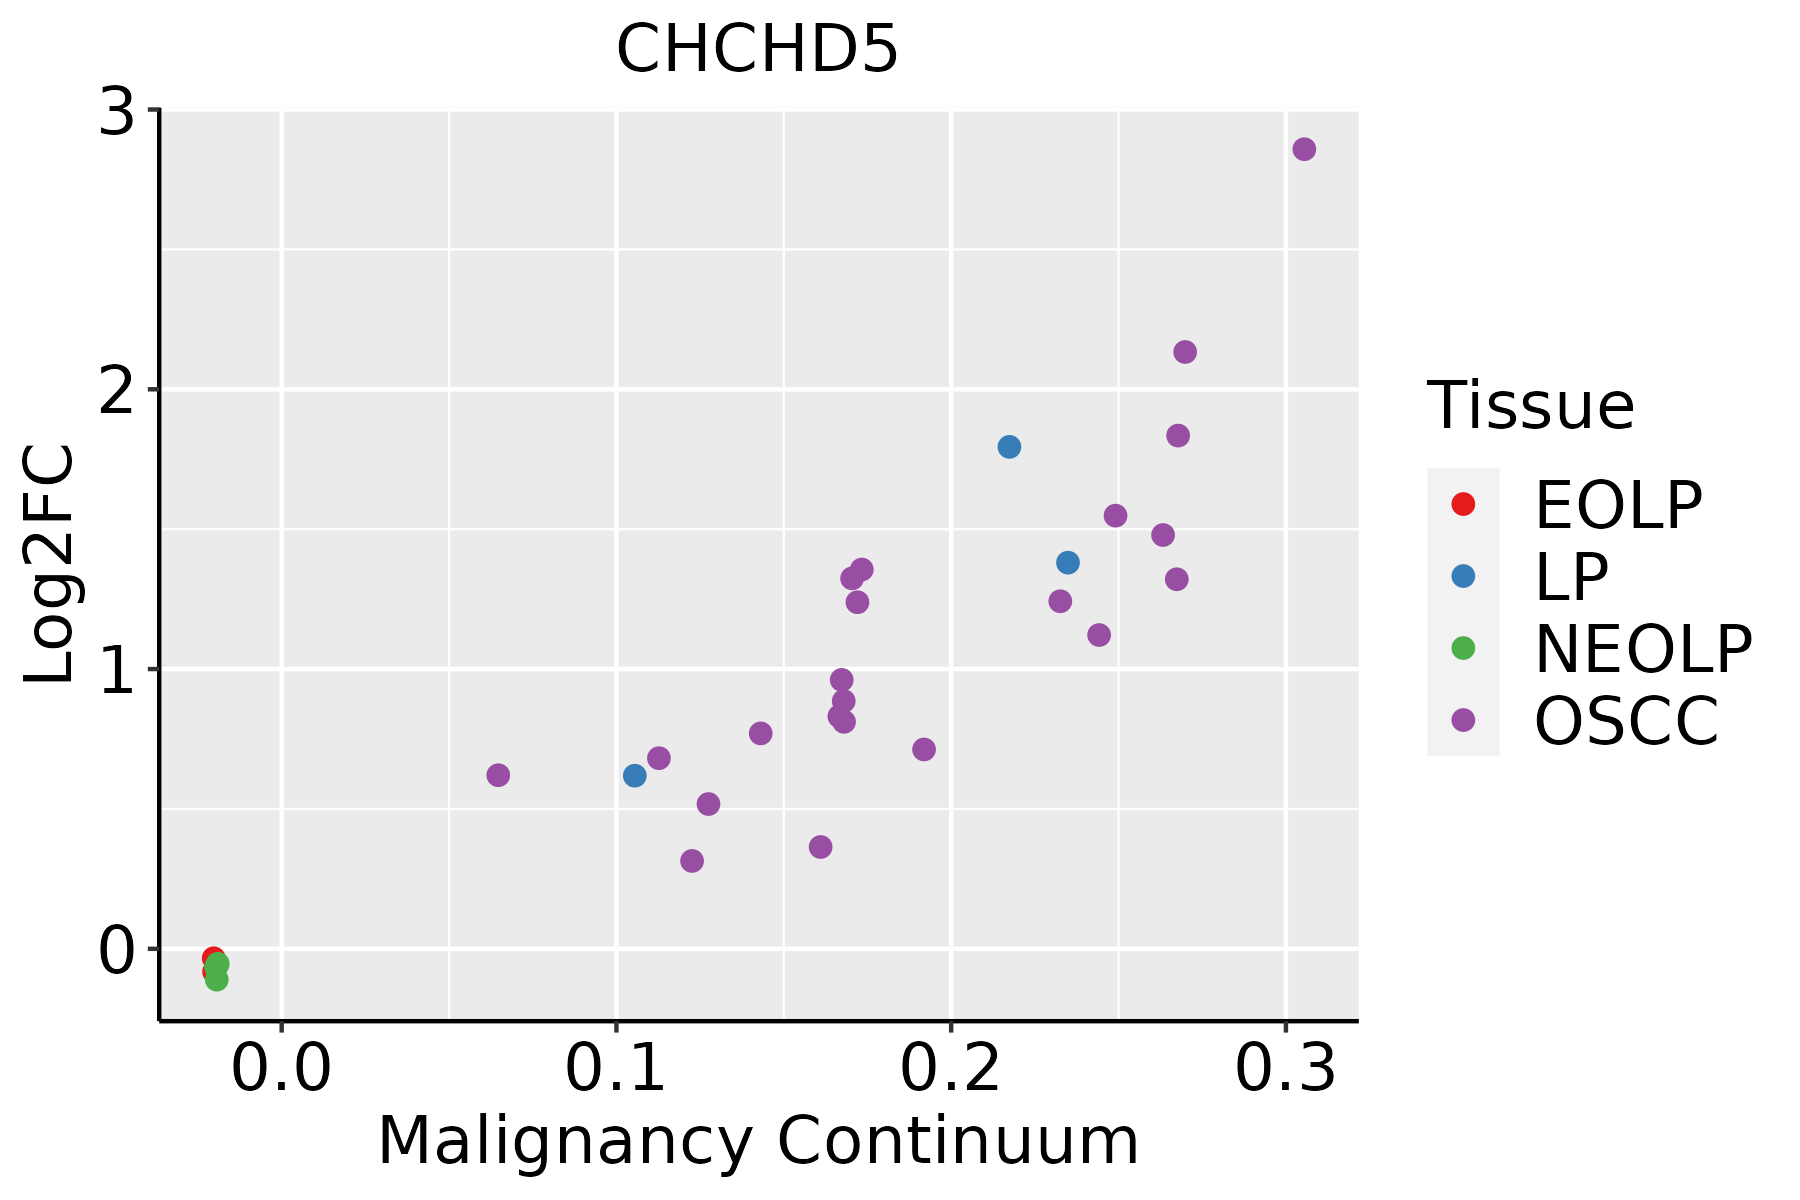 | EOLP: Erosive Oral lichen planus |
| LP: leukoplakia | ||
| NEOLP: Non-erosive oral lichen planus | ||
| OSCC: Oral squamous cell carcinoma | ||
| Prostate | 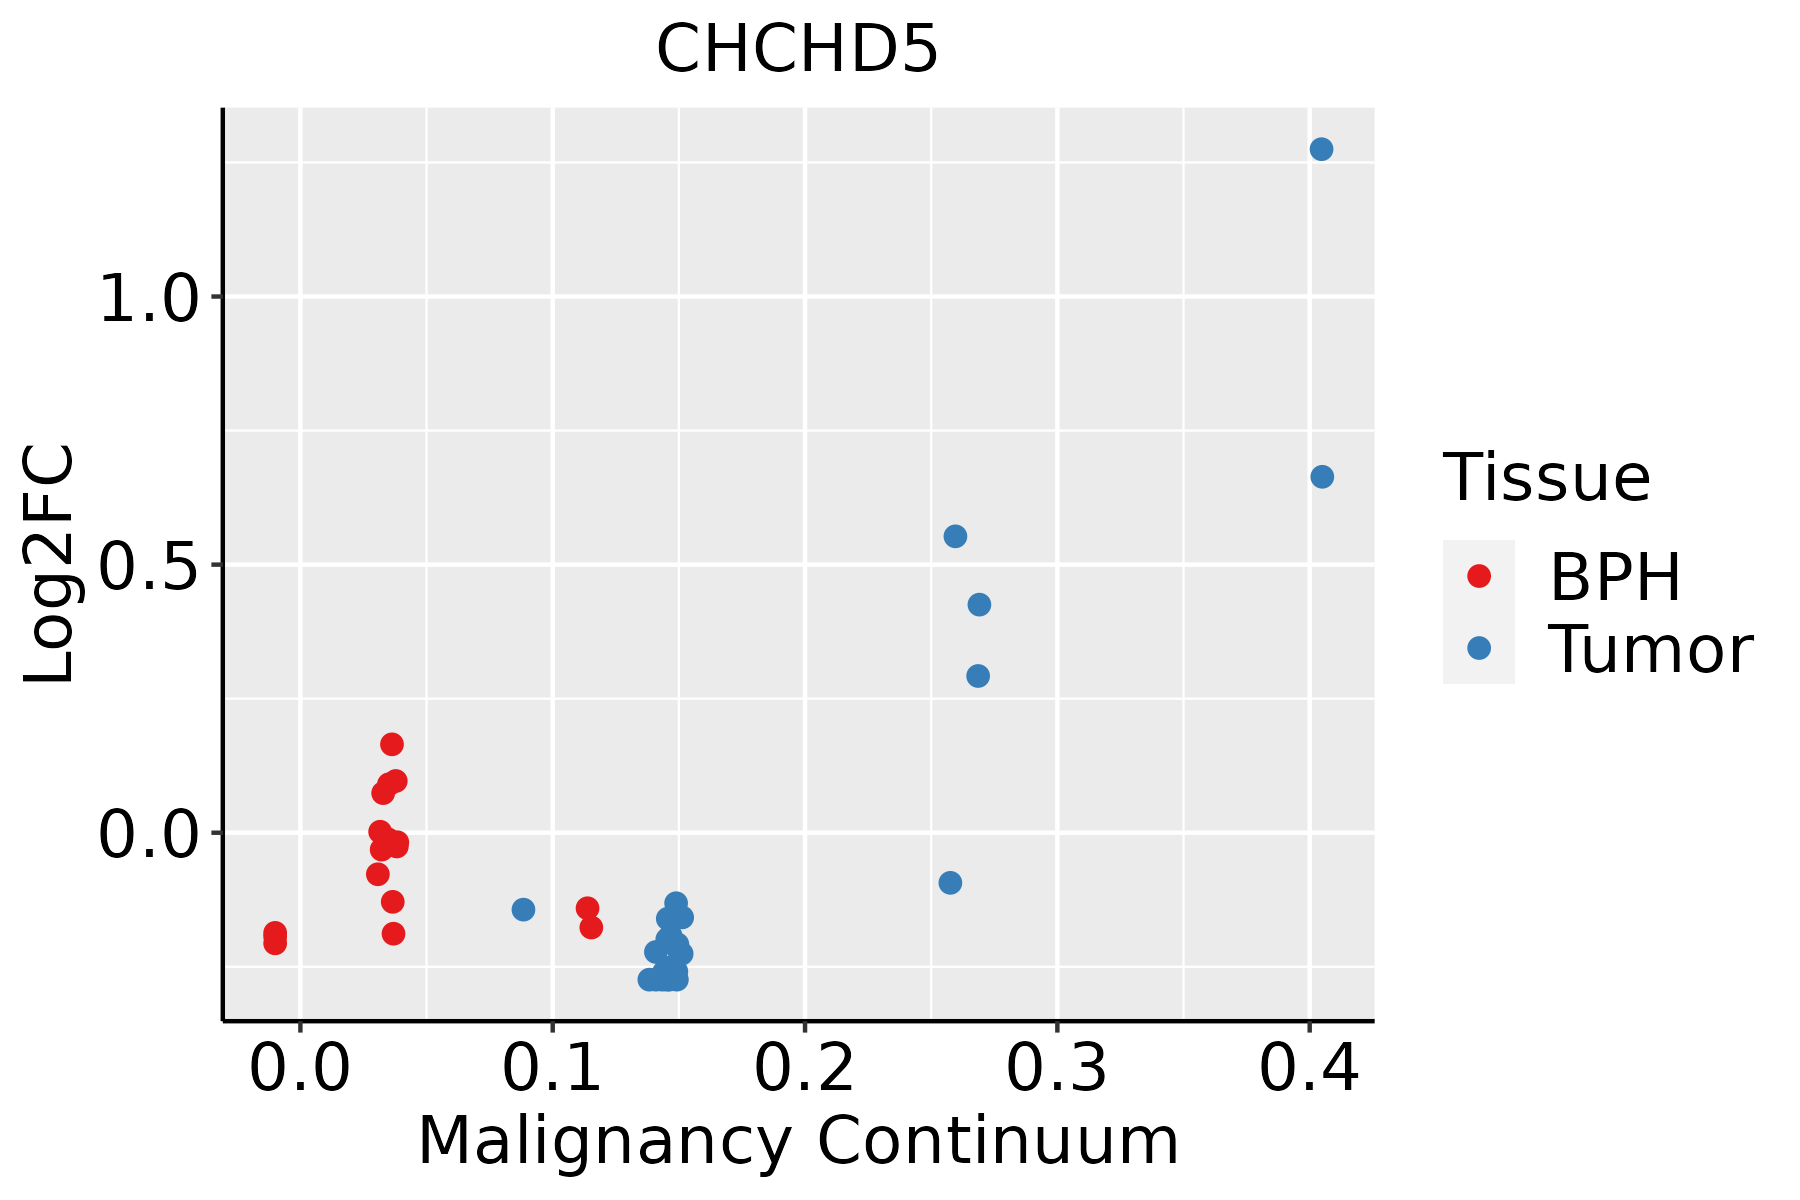 | BPH: Benign Prostatic Hyperplasia |
| Skin | 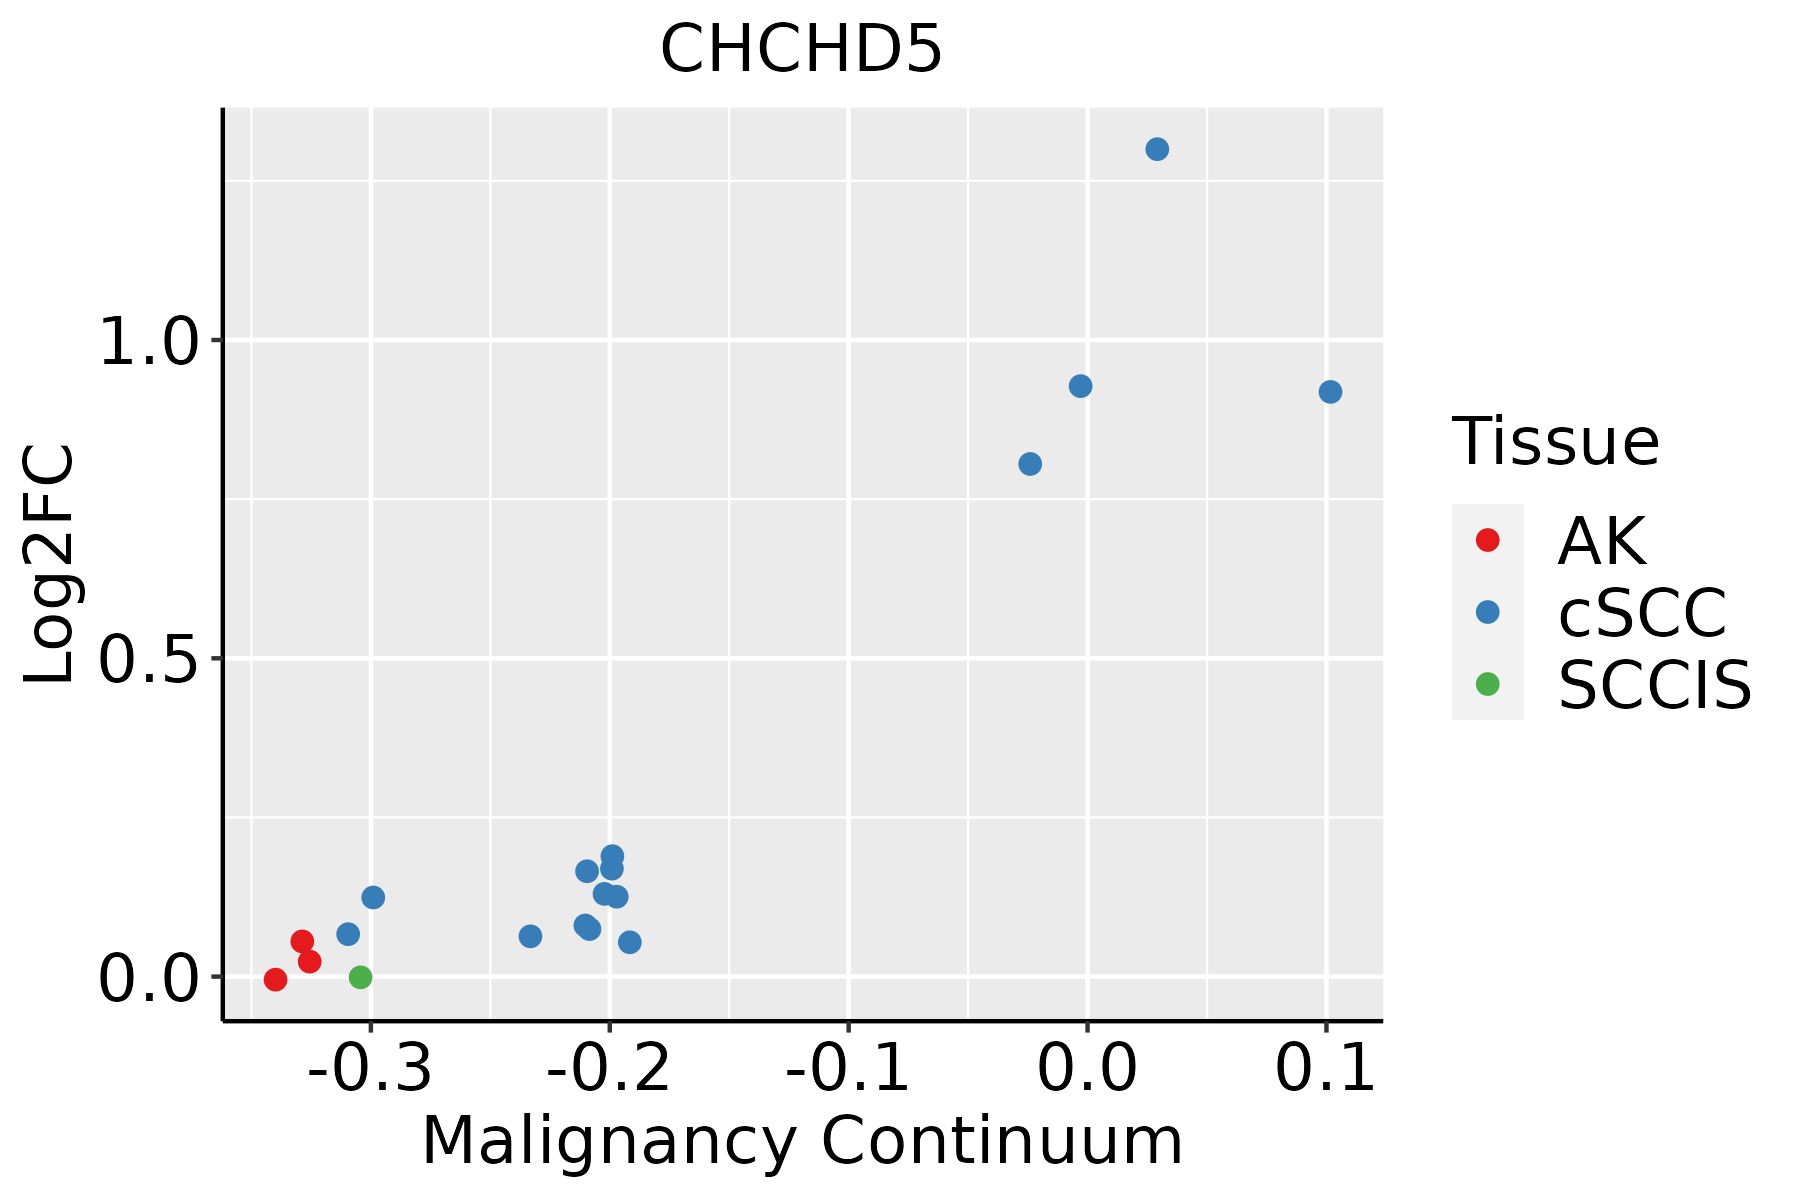 | AK: Actinic keratosis |
| cSCC: Cutaneous squamous cell carcinoma | ||
| SCCIS:squamous cell carcinoma in situ | ||
| Thyroid | 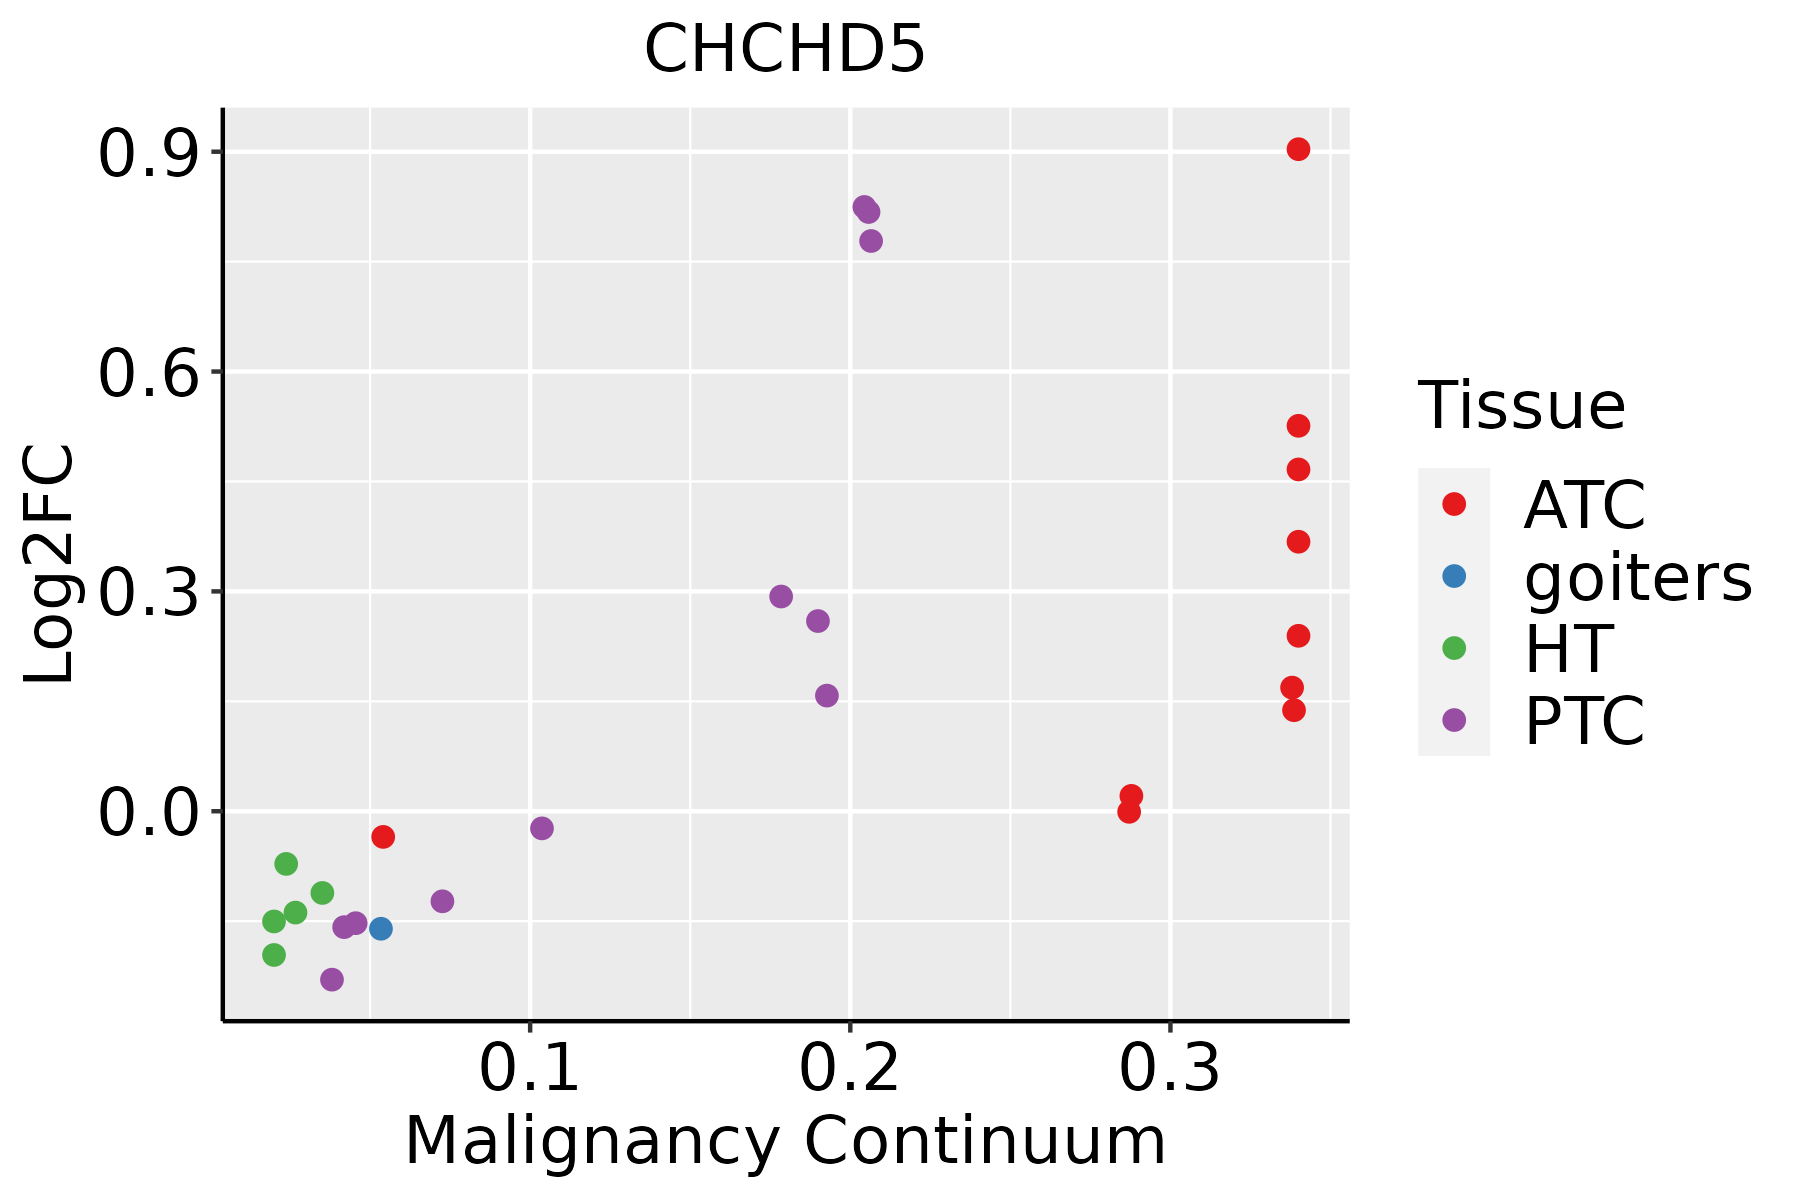 | ATC: Anaplastic thyroid cancer |
| HT: Hashimoto's thyroiditis | ||
| PTC: Papillary thyroid cancer |
| ∗log2FC in expression of this searched gene in stem-like cells from each diseased tissue sample relative to stem-like cells in normal samples in each tissue plotted against the malignancy continuum. Samples are colored based on if they are from different disease stage. |
Top |
Malignant transformation related pathway analysis |
| Find out the enriched GO biological processes and KEGG pathways involved in transition from healthy to precancer to cancer |
| Tissue | Disease Stage | Enriched GO biological Processes |
| Colorectum | AD |  |
| Colorectum | SER |  |
| Colorectum | MSS |  |
| Colorectum | MSI-H |  |
| Colorectum | FAP |  |
| ∗Top 15 enriched GO BP terms are showed in the bar plot of each disease state in each tissue. Each row represents a significant GO biological process which is colored according to the -log10(p.adjust). |
| Page: 1 2 3 4 5 6 7 8 9 |
| GO ID | Tissue | Disease Stage | Description | Gene Ratio | Bg Ratio | pvalue | p.adjust | Count |
| Page: 1 |
| Pathway ID | Tissue | Disease Stage | Description | Gene Ratio | Bg Ratio | pvalue | p.adjust | qvalue | Count |
| Page: 1 |
Top |
Cell-cell communication analysis |
| Identification of potential cell-cell interactions between two cell types and their ligand-receptor pairs for different disease states |
| Ligand | Receptor | LRpair | Pathway | Tissue | Disease Stage |
| Page: 1 |
Top |
Single-cell gene regulatory network inference analysis |
| Find out the significant the regulons (TFs) and the target genes of each regulon across cell types for different disease states |
| TF | Cell Type | Tissue | Disease Stage | Target Gene | RSS | Regulon Activity |
| ∗The dot plots of a searched regulon are shown for all cell subpopulations in each disease state of each tissue based on the regulon specific score inferred using pySCENIC and by calculating the average expression. |
| Page: 1 |
Top |
Somatic mutation of malignant transformation related genes |
| Annotation of somatic variants for genes involved in malignant transformation |
| Hugo Symbol | Variant Class | Variant Classification | dbSNP RS | HGVSc | HGVSp | HGVSp Short | SWISSPROT | BIOTYPE | SIFT | PolyPhen | Tumor Sample Barcode | Tissue | Histology | Sex | Age | Stage | Therapy Types | Drugs | Outcome |
| CHCHD5 | SNV | Missense_Mutation | rs779454543 | c.38N>A | p.Gly13Asp | p.G13D | Q9BSY4 | protein_coding | tolerated(0.3) | benign(0.006) | TCGA-AR-A2LR-01 | Breast | breast invasive carcinoma | Female | <65 | I/II | Chemotherapy | adriamycin | SD |
| CHCHD5 | SNV | Missense_Mutation | rs201729327 | c.71C>T | p.Ala24Val | p.A24V | Q9BSY4 | protein_coding | tolerated(0.1) | benign(0.001) | TCGA-2W-A8YY-01 | Cervix | cervical & endocervical cancer | Female | <65 | I/II | Chemotherapy | cisplatin | CR |
| CHCHD5 | SNV | Missense_Mutation | c.316C>T | p.Pro106Ser | p.P106S | Q9BSY4 | protein_coding | tolerated(0.16) | benign(0.009) | TCGA-AA-3864-01 | Colorectum | colon adenocarcinoma | Male | >=65 | I/II | Unknown | Unknown | SD | |
| CHCHD5 | SNV | Missense_Mutation | novel | c.59G>A | p.Gly20Asp | p.G20D | Q9BSY4 | protein_coding | deleterious(0) | possibly_damaging(0.746) | TCGA-AA-3949-01 | Colorectum | colon adenocarcinoma | Female | >=65 | III/IV | Unknown | Unknown | SD |
| CHCHD5 | SNV | Missense_Mutation | c.34N>G | p.Cys12Gly | p.C12G | Q9BSY4 | protein_coding | deleterious(0) | probably_damaging(0.915) | TCGA-AZ-6598-01 | Colorectum | colon adenocarcinoma | Female | >=65 | I/II | Unknown | Unknown | SD | |
| CHCHD5 | SNV | Missense_Mutation | c.290G>A | p.Arg97His | p.R97H | Q9BSY4 | protein_coding | tolerated(0.37) | benign(0) | TCGA-G4-6304-01 | Colorectum | colon adenocarcinoma | Female | >=65 | I/II | Chemotherapy | fluorouracil | PD | |
| CHCHD5 | SNV | Missense_Mutation | novel | c.263N>G | p.Gln88Arg | p.Q88R | Q9BSY4 | protein_coding | tolerated(0.6) | benign(0.039) | TCGA-AP-A1DK-01 | Endometrium | uterine corpus endometrioid carcinoma | Female | <65 | I/II | Unknown | Unknown | SD |
| CHCHD5 | SNV | Missense_Mutation | c.250C>T | p.Arg84Cys | p.R84C | Q9BSY4 | protein_coding | deleterious(0.01) | probably_damaging(0.94) | TCGA-B5-A0JZ-01 | Endometrium | uterine corpus endometrioid carcinoma | Female | <65 | III/IV | Chemotherapy | carboplatin | PD | |
| CHCHD5 | SNV | Missense_Mutation | novel | c.40C>T | p.Arg14Trp | p.R14W | Q9BSY4 | protein_coding | deleterious(0) | benign(0.333) | TCGA-BG-A18A-01 | Endometrium | uterine corpus endometrioid carcinoma | Female | >=65 | I/II | Unknown | Unknown | SD |
| CHCHD5 | SNV | Missense_Mutation | c.46N>A | p.Leu16Met | p.L16M | Q9BSY4 | protein_coding | tolerated(0.56) | benign(0.177) | TCGA-D1-A103-01 | Endometrium | uterine corpus endometrioid carcinoma | Female | >=65 | I/II | Unknown | Unknown | SD |
| Page: 1 2 |
Top |
Related drugs of malignant transformation related genes |
| Identification of chemicals and drugs interact with genes involved in malignant transfromation |
| (DGIdb 4.0) |
| Entrez ID | Symbol | Category | Interaction Types | Drug Claim Name | Drug Name | PMIDs |
| Page: 1 |

Copyright 2023-Present -The University of Texas Health Science Center at Houston |