Schematic overview of the cellular and molecular mechanisms involved in the cancer progression, including the proposed cellular and molecular mechanisms in cancer cells trajectory. AT1: alveolar type 1 cells; AT2: alveolar type 2 cells; AAH: atypical adenomatous hyperplasia; AIS: adenocarcinoma in situ; MIA: minimally invasive adenocarcinoma; IA: invasive adenocarcinoma; EMT: epithelial-mesenchymal transition

Home

Download

Statistics

Help

Contact

Center for Computational Systems Medicine
leaf

Gene summary

leaf

Malignant transformation analysis

leaf

Malignant transformation related pathway analysis

leaf

Cell-cell communication analysis

leaf

Single-cell gene regulatory network inference analysis

leaf

Somatic mutation of malignant transformation related genes

leaf

Related drugs of malignant transformation related genes

Gene: CHCHD4

Gene summary for CHCHD4

check button Gene summary.

Gene informationSpeciesHuman
Gene symbol

CHCHD4

Gene ID

131474

Gene namecoiled-coil-helix-coiled-coil-helix domain containing 4
Gene AliasMIA40
Cytomap3p25.1
Gene Typeprotein-coding
GO ID

GO:0006457

UniProtAcc

A0A024R2I5


Top

Malignant transformation analysis

check button Identification of the aberrant gene expression in precancerous and cancerous lesions by comparing the gene expression of stem-like cells in diseased tissues with normal stem cells
check button Malignant transformation involving gene list.
Entrez IDSymbolReplicatesSpeciesOrganTissueAdj P-valueLog2FCMalignancy
131474CHCHD4LZE4THumanEsophagusESCC2.18e-061.03e-010.0811
131474CHCHD4LZE8THumanEsophagusESCC4.92e-025.97e-020.067
131474CHCHD4LZE24THumanEsophagusESCC6.48e-035.35e-020.0596
131474CHCHD4P1T-EHumanEsophagusESCC1.33e-021.46e-010.0875
131474CHCHD4P2T-EHumanEsophagusESCC3.53e-071.66e-010.1177
131474CHCHD4P4T-EHumanEsophagusESCC4.76e-133.54e-010.1323
131474CHCHD4P5T-EHumanEsophagusESCC1.23e-266.06e-010.1327
131474CHCHD4P8T-EHumanEsophagusESCC4.14e-101.13e-010.0889
131474CHCHD4P9T-EHumanEsophagusESCC7.54e-132.21e-010.1131
131474CHCHD4P10T-EHumanEsophagusESCC1.26e-151.20e-010.116
131474CHCHD4P11T-EHumanEsophagusESCC3.36e-092.97e-010.1426
131474CHCHD4P12T-EHumanEsophagusESCC8.59e-122.72e-010.1122
131474CHCHD4P15T-EHumanEsophagusESCC2.35e-101.02e-010.1149
131474CHCHD4P16T-EHumanEsophagusESCC1.56e-071.69e-010.1153
131474CHCHD4P17T-EHumanEsophagusESCC4.59e-072.61e-010.1278
131474CHCHD4P20T-EHumanEsophagusESCC3.05e-112.64e-010.1124
131474CHCHD4P21T-EHumanEsophagusESCC1.19e-204.20e-010.1617
131474CHCHD4P22T-EHumanEsophagusESCC4.93e-131.60e-010.1236
131474CHCHD4P23T-EHumanEsophagusESCC4.15e-133.12e-010.108
131474CHCHD4P24T-EHumanEsophagusESCC6.69e-153.11e-010.1287
Page: 1 2 3 4 5 

check button Transcriptomic changes along malignancy continuum.
TissueExpression DynamicsAbbreviation
EsophagusThe image shows the transcriptomic changes along malignancy continuum.log2FC in expression of this searched gene in stem-like cells from each diseased tissue sample relative to stem-like cells in normal samples in each tissue plotted against the malignancy continuum. Samples are colored based on if they are from different disease stage.
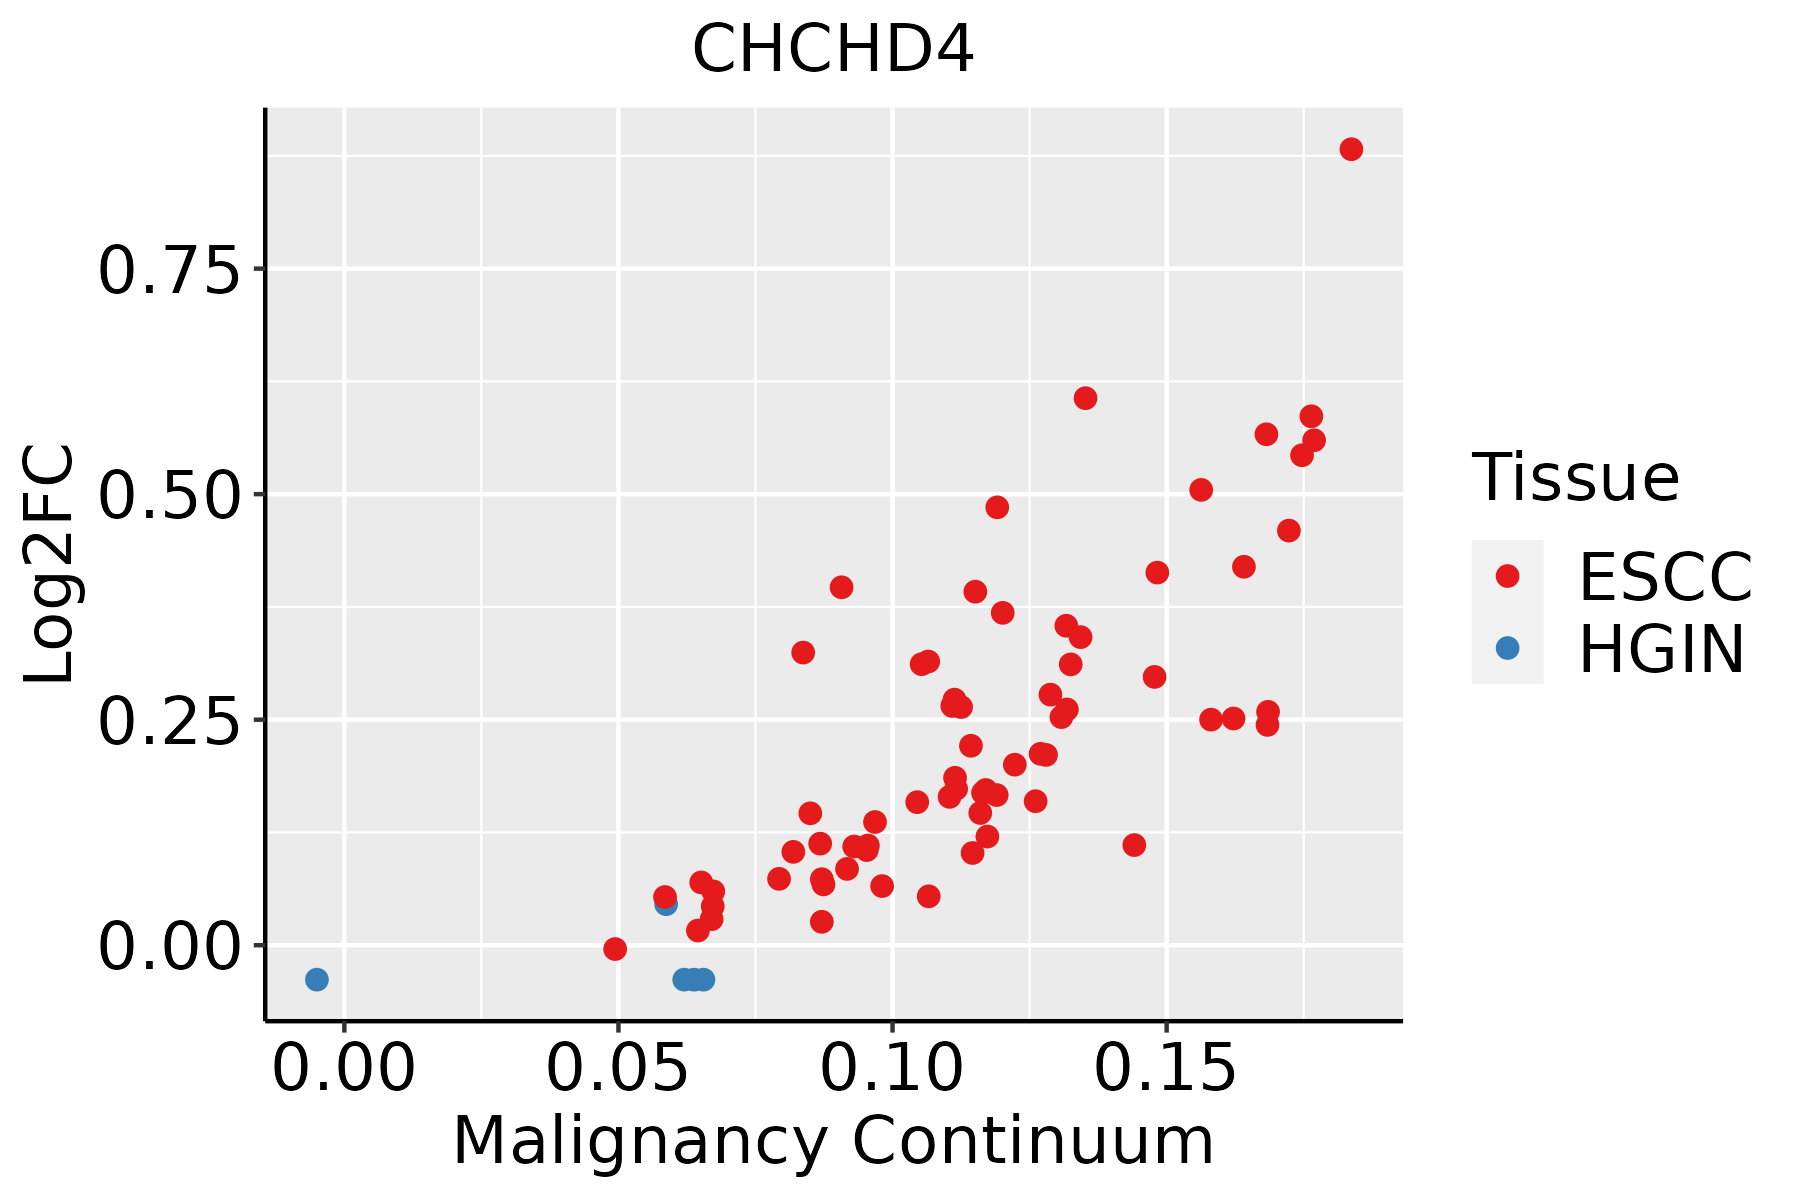
ESCC: Esophageal squamous cell carcinoma
HGIN: High-grade intraepithelial neoplasias
LGIN: Low-grade intraepithelial neoplasias
LiverThe image shows the transcriptomic changes along malignancy continuum.log2FC in expression of this searched gene in stem-like cells from each diseased tissue sample relative to stem-like cells in normal samples in each tissue plotted against the malignancy continuum. Samples are colored based on if they are from different disease stage.
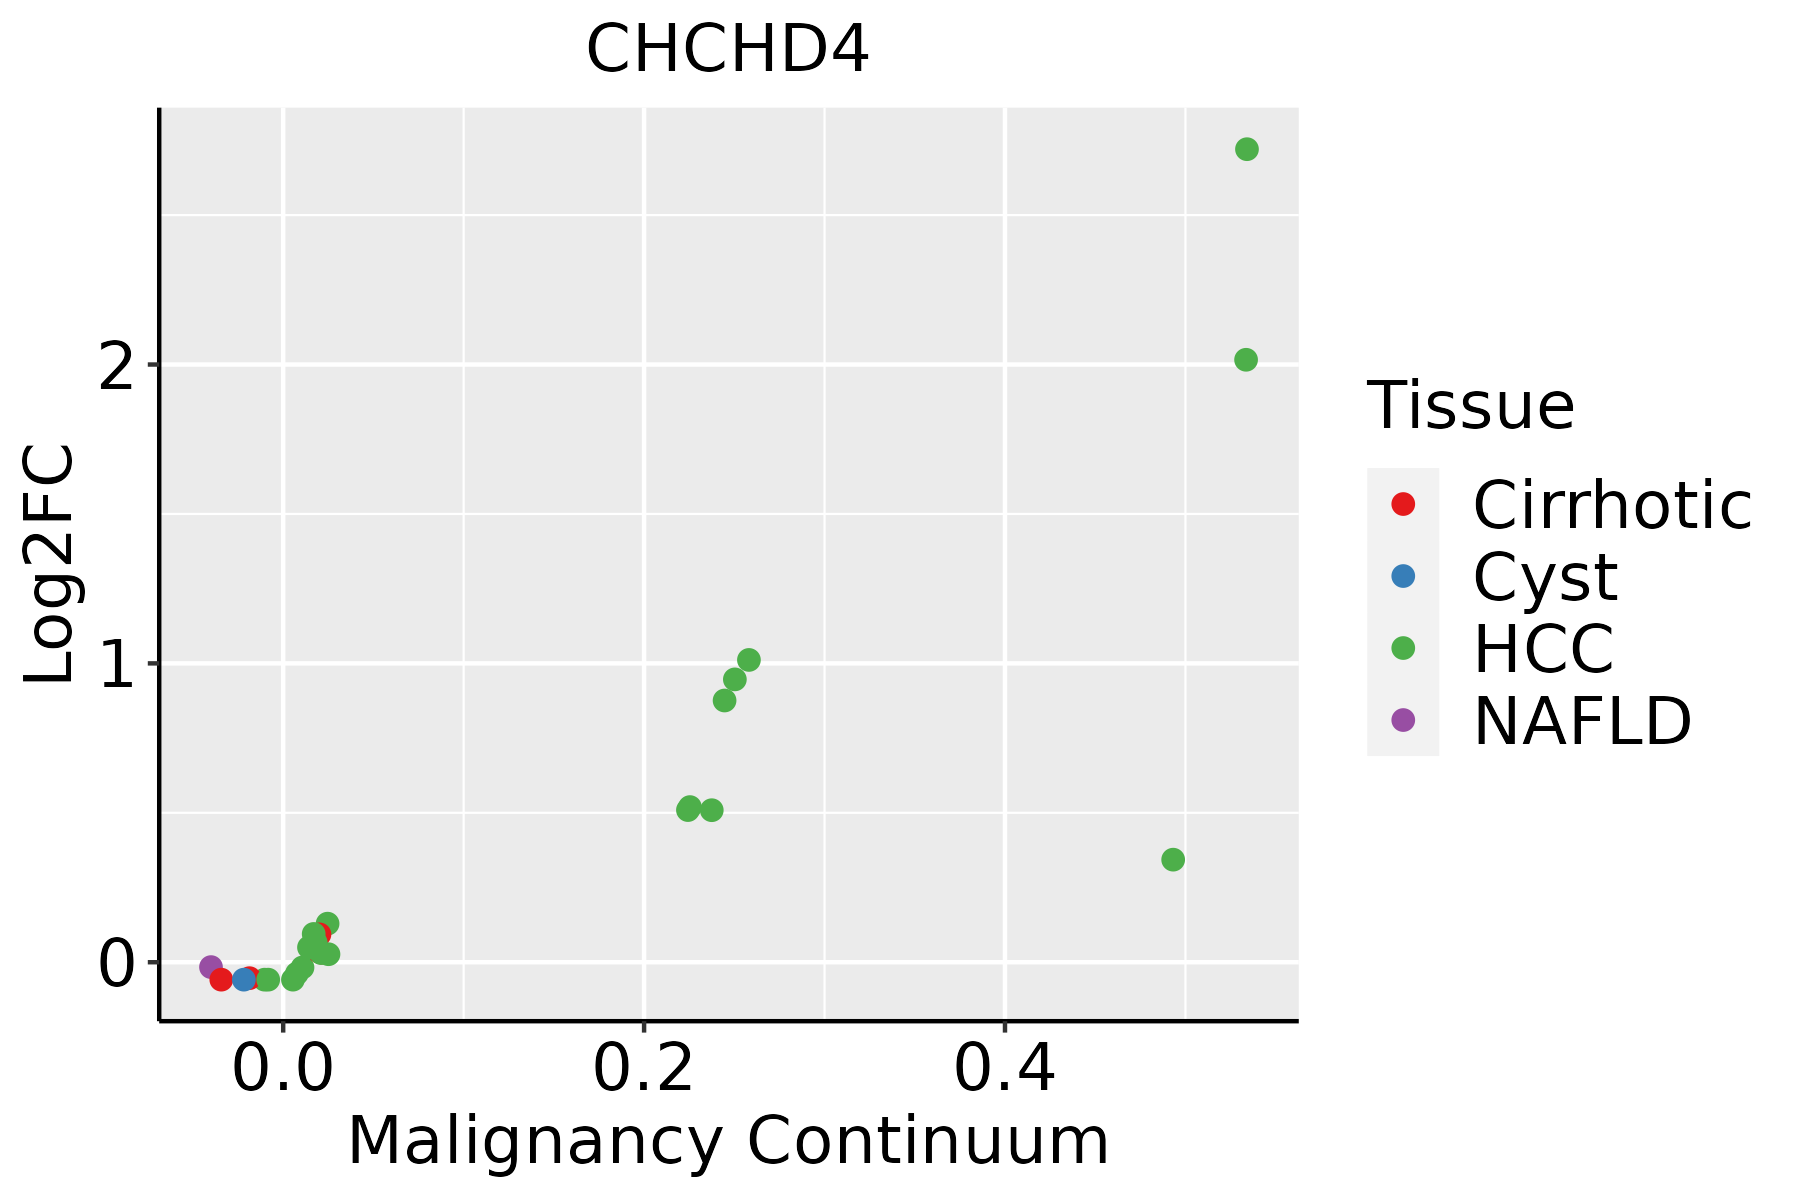
HCC: Hepatocellular carcinoma
NAFLD: Non-alcoholic fatty liver disease
Oral CavityThe image shows the transcriptomic changes along malignancy continuum.log2FC in expression of this searched gene in stem-like cells from each diseased tissue sample relative to stem-like cells in normal samples in each tissue plotted against the malignancy continuum. Samples are colored based on if they are from different disease stage.
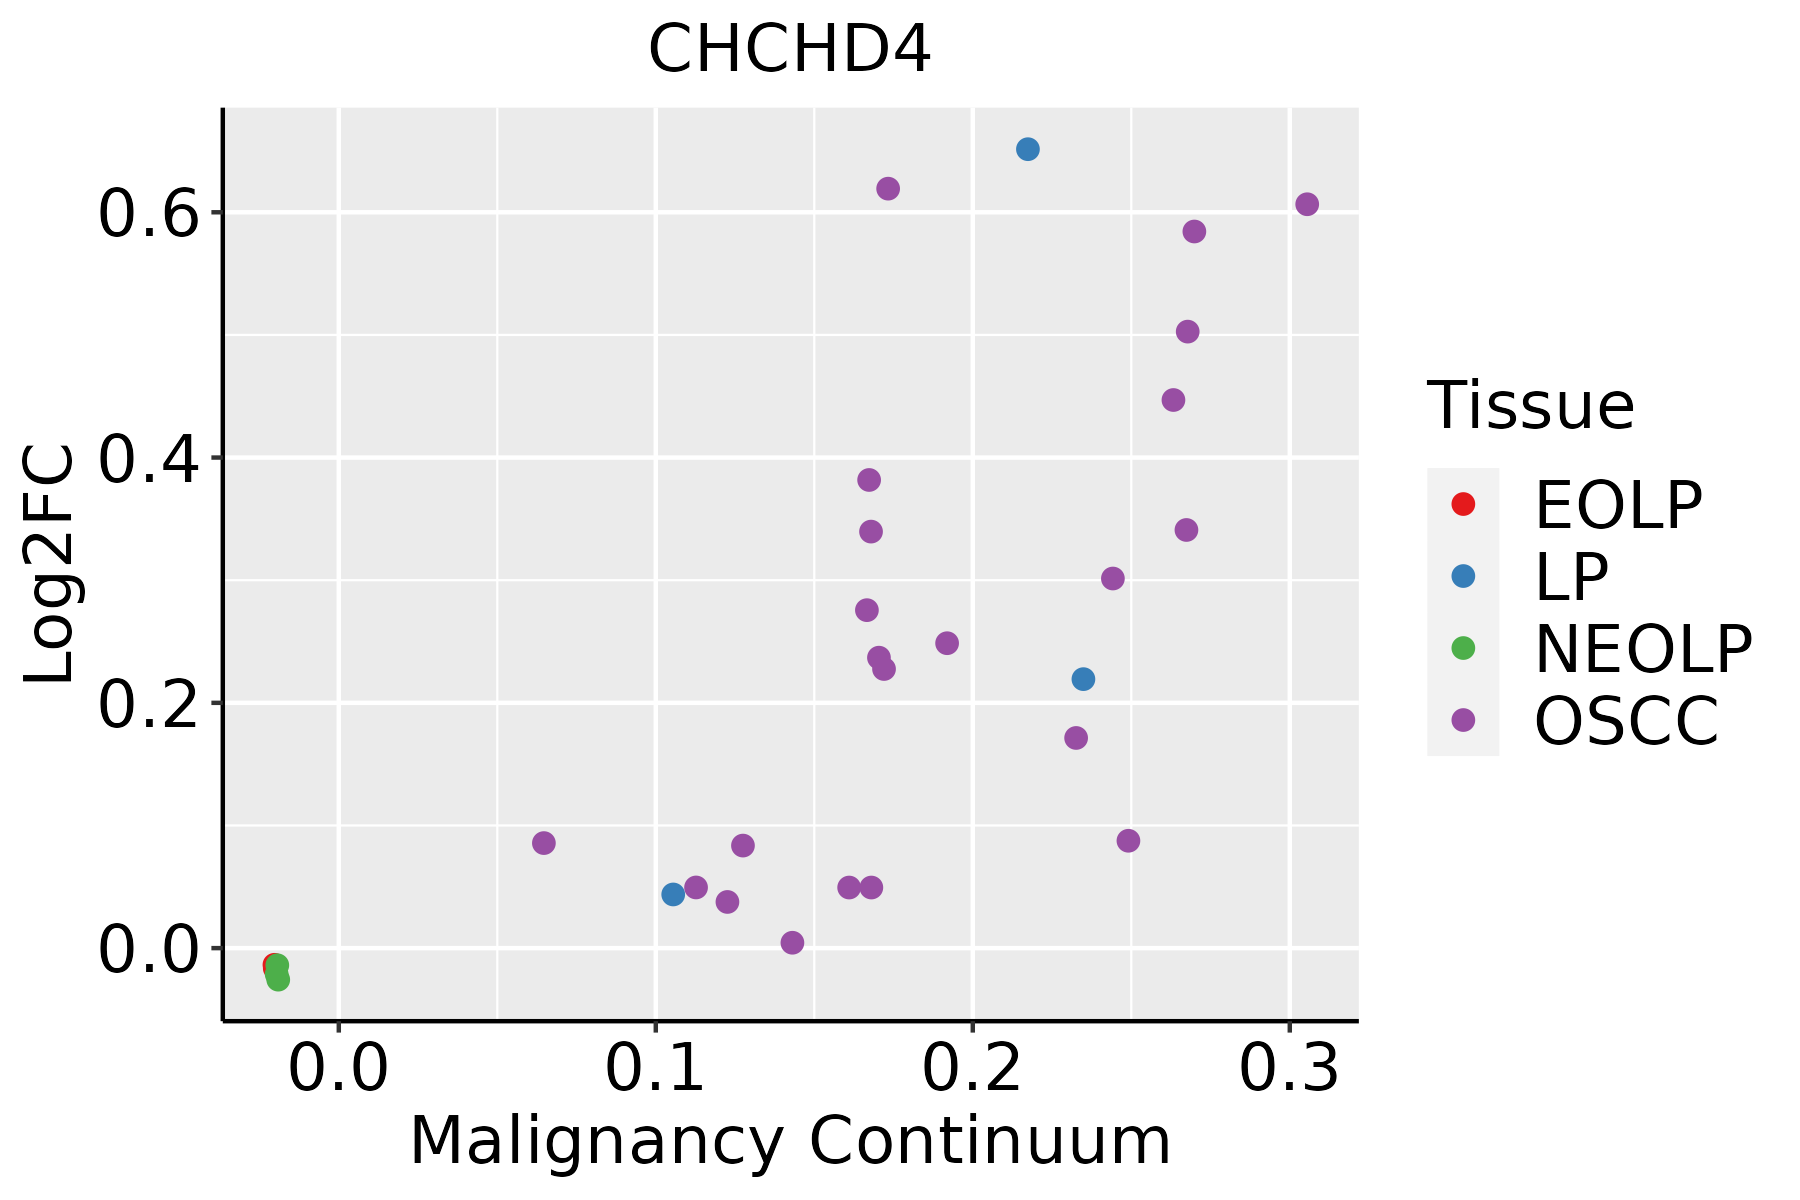
EOLP: Erosive Oral lichen planus
LP: leukoplakia
NEOLP: Non-erosive oral lichen planus
OSCC: Oral squamous cell carcinoma
SkinThe image shows the transcriptomic changes along malignancy continuum.log2FC in expression of this searched gene in stem-like cells from each diseased tissue sample relative to stem-like cells in normal samples in each tissue plotted against the malignancy continuum. Samples are colored based on if they are from different disease stage.AK: Actinic keratosis
cSCC: Cutaneous squamous cell carcinoma
SCCIS:squamous cell carcinoma in situ
∗log2FC in expression of this searched gene in stem-like cells from each diseased tissue sample relative to stem-like cells in normal samples in each tissue plotted against the malignancy continuum. Samples are colored based on if they are from different disease stage.

Top

Malignant transformation related pathway analysis

check buttonFind out the enriched GO biological processes and KEGG pathways involved in transition from healthy to precancer to cancer
check button Figure of enriched GO biological processes.
TissueDisease StageEnriched GO biological Processes
ColorectumADGO analysis - Figure of enriched GO biological processes: Top 15 enriched GO BP terms are showed in the bar plot of each disease state in each tissue. Each row represents a significant GO biological process which is colored according to the -log10(p.adjust).
ColorectumSERGO analysis - Figure of enriched GO biological processes: Top 15 enriched GO BP terms are showed in the bar plot of each disease state in each tissue. Each row represents a significant GO biological process which is colored according to the -log10(p.adjust).
ColorectumMSSGO analysis - Figure of enriched GO biological processes: Top 15 enriched GO BP terms are showed in the bar plot of each disease state in each tissue. Each row represents a significant GO biological process which is colored according to the -log10(p.adjust).
ColorectumMSI-HGO analysis - Figure of enriched GO biological processes: Top 15 enriched GO BP terms are showed in the bar plot of each disease state in each tissue. Each row represents a significant GO biological process which is colored according to the -log10(p.adjust).
ColorectumFAPGO analysis - Figure of enriched GO biological processes: Top 15 enriched GO BP terms are showed in the bar plot of each disease state in each tissue. Each row represents a significant GO biological process which is colored according to the -log10(p.adjust).
∗Top 15 enriched GO BP terms are showed in the bar plot of each disease state in each tissue. Each row represents a significant GO biological process which is colored according to the -log10(p.adjust).
Page: 1 2 3 4 5 6 7 8 9 

check button Enriched GO biological processes.
GO IDTissueDisease StageDescriptionGene RatioBg Ratiopvaluep.adjustCount
GO:0072594110EsophagusESCCestablishment of protein localization to organelle311/8552422/187233.02e-322.13e-29311
GO:0006605111EsophagusESCCprotein targeting229/8552314/187234.93e-231.01e-20229
GO:0006457110EsophagusESCCprotein folding163/8552212/187231.13e-201.74e-18163
GO:0006839110EsophagusESCCmitochondrial transport187/8552254/187238.35e-209.81e-18187
GO:0033108110EsophagusESCCmitochondrial respiratory chain complex assembly83/855293/187239.56e-191.05e-1683
GO:0072655110EsophagusESCCestablishment of protein localization to mitochondrion97/8552120/187232.17e-151.33e-1397
GO:0070585110EsophagusESCCprotein localization to mitochondrion100/8552125/187232.96e-151.77e-13100
GO:001703818EsophagusESCCprotein import149/8552206/187235.90e-153.31e-13149
GO:0006626110EsophagusESCCprotein targeting to mitochondrion81/8552100/187233.60e-131.67e-1181
GO:005160418EsophagusESCCprotein maturation189/8552294/187237.64e-112.39e-09189
GO:00718069EsophagusESCCprotein transmembrane transport47/855259/187239.02e-081.51e-0647
GO:0006458110EsophagusESCC'de novo' protein folding36/855243/187232.90e-074.20e-0636
GO:1990542110EsophagusESCCmitochondrial transmembrane transport72/8552102/187232.94e-074.23e-0672
GO:00650026EsophagusESCCintracellular protein transmembrane transport40/855251/187231.76e-062.08e-0540
GO:0051084110EsophagusESCC'de novo' posttranslational protein folding32/855239/187233.27e-063.65e-0532
GO:00447433EsophagusESCCprotein transmembrane import into intracellular organelle29/855236/187231.91e-051.67e-0429
GO:007259422LiverHCCestablishment of protein localization to organelle299/7958422/187231.06e-326.10e-30299
GO:000660512LiverHCCprotein targeting219/7958314/187237.74e-231.49e-20219
GO:000645712LiverHCCprotein folding160/7958212/187231.07e-221.88e-20160
GO:000683912LiverHCCmitochondrial transport184/7958254/187232.30e-223.83e-20184
Page: 1 2 3 4 

check button Enriched KEGG pathways.
Pathway IDTissueDisease StageDescriptionGene RatioBg Ratiopvaluep.adjustqvalueCount
Page: 1 

Top

Cell-cell communication analysis

check buttonIdentification of potential cell-cell interactions between two cell types and their ligand-receptor pairs for different disease states
LigandReceptorLRpairPathwayTissueDisease Stage
Page: 1 

Top

Single-cell gene regulatory network inference analysis

check buttonFind out the significant the regulons (TFs) and the target genes of each regulon across cell types for different disease states
TFCell TypeTissueDisease StageTarget GeneRSSRegulon Activity
∗The dot plots of a searched regulon are shown for all cell subpopulations in each disease state of each tissue based on the regulon specific score inferred using pySCENIC and by calculating the average expression.
Page: 1 

Top

Somatic mutation of malignant transformation related genes

check buttonAnnotation of somatic variants for genes involved in malignant transformation
Hugo SymbolVariant ClassVariant ClassificationdbSNP RSHGVScHGVSpHGVSp ShortSWISSPROTBIOTYPESIFTPolyPhenTumor Sample BarcodeTissueHistologySexAgeStageTherapy TypesDrugsOutcome
CHCHD4SNVMissense_Mutationrs773338809c.313N>Tp.Arg105Trpp.R105WQ8N4Q1protein_codingtolerated(0.16)benign(0.013)TCGA-A6-2686-01Colorectumcolon adenocarcinomaFemale>=65I/IIUnknownUnknownSD
CHCHD4SNVMissense_Mutationc.11N>Tp.Ser4Leup.S4LQ8N4Q1protein_codingtolerated_low_confidence(0.09)benign(0)TCGA-AA-3864-01Colorectumcolon adenocarcinomaMale>=65I/IIUnknownUnknownSD
CHCHD4SNVMissense_Mutationnovelc.257N>Tp.Ser86Phep.S86FQ8N4Q1protein_codingdeleterious(0.04)probably_damaging(0.999)TCGA-AJ-A2QO-01Endometriumuterine corpus endometrioid carcinomaFemale>=65I/IIUnknownUnknownSD
CHCHD4SNVMissense_Mutationnovelc.166N>Cp.Ile56Leup.I56LQ8N4Q1protein_codingtolerated(0.06)benign(0.367)TCGA-AX-A1CE-01Endometriumuterine corpus endometrioid carcinomaFemale<65I/IIUnspecificPaclitaxelSD
CHCHD4SNVMissense_Mutationrs755009391c.71N>Ap.Arg24Glnp.R24QQ8N4Q1protein_codingtolerated(0.29)benign(0.024)TCGA-B5-A3FA-01Endometriumuterine corpus endometrioid carcinomaFemale>=65I/IIUnknownUnknownSD
CHCHD4SNVMissense_Mutationnovelc.327A>Cp.Glu109Aspp.E109DQ8N4Q1protein_codingtolerated(0.17)possibly_damaging(0.716)TCGA-B5-A3FC-01Endometriumuterine corpus endometrioid carcinomaFemale<65I/IIUnknownUnknownSD
CHCHD4SNVMissense_Mutationrs755009391c.71N>Ap.Arg24Glnp.R24QQ8N4Q1protein_codingtolerated(0.29)benign(0.024)TCGA-BS-A0UV-01Endometriumuterine corpus endometrioid carcinomaFemale<65III/IVUnknownUnknownSD
CHCHD4SNVMissense_Mutationrs755009391c.71N>Ap.Arg24Glnp.R24QQ8N4Q1protein_codingtolerated(0.29)benign(0.024)TCGA-DF-A2KU-01Endometriumuterine corpus endometrioid carcinomaFemaleUnknownI/IIUnknownUnknownSD
CHCHD4SNVMissense_Mutationrs755009391c.71N>Ap.Arg24Glnp.R24QQ8N4Q1protein_codingtolerated(0.29)benign(0.024)TCGA-DF-A2KV-01Endometriumuterine corpus endometrioid carcinomaFemale<65I/IIUnknownUnknownSD
CHCHD4SNVMissense_Mutationrs750347112c.82G>Ap.Val28Ilep.V28IQ8N4Q1protein_codingtolerated(0.07)benign(0.107)TCGA-EO-A3KX-01Endometriumuterine corpus endometrioid carcinomaFemale>=65I/IIUnknownUnknownSD
Page: 1 2 

Top

Related drugs of malignant transformation related genes

check buttonIdentification of chemicals and drugs interact with genes involved in malignant transfromation
(DGIdb 4.0)
Entrez IDSymbolCategoryInteraction TypesDrug Claim NameDrug NamePMIDs
Page: 1