| Tissue | Expression Dynamics | Abbreviation |
| Cervix | 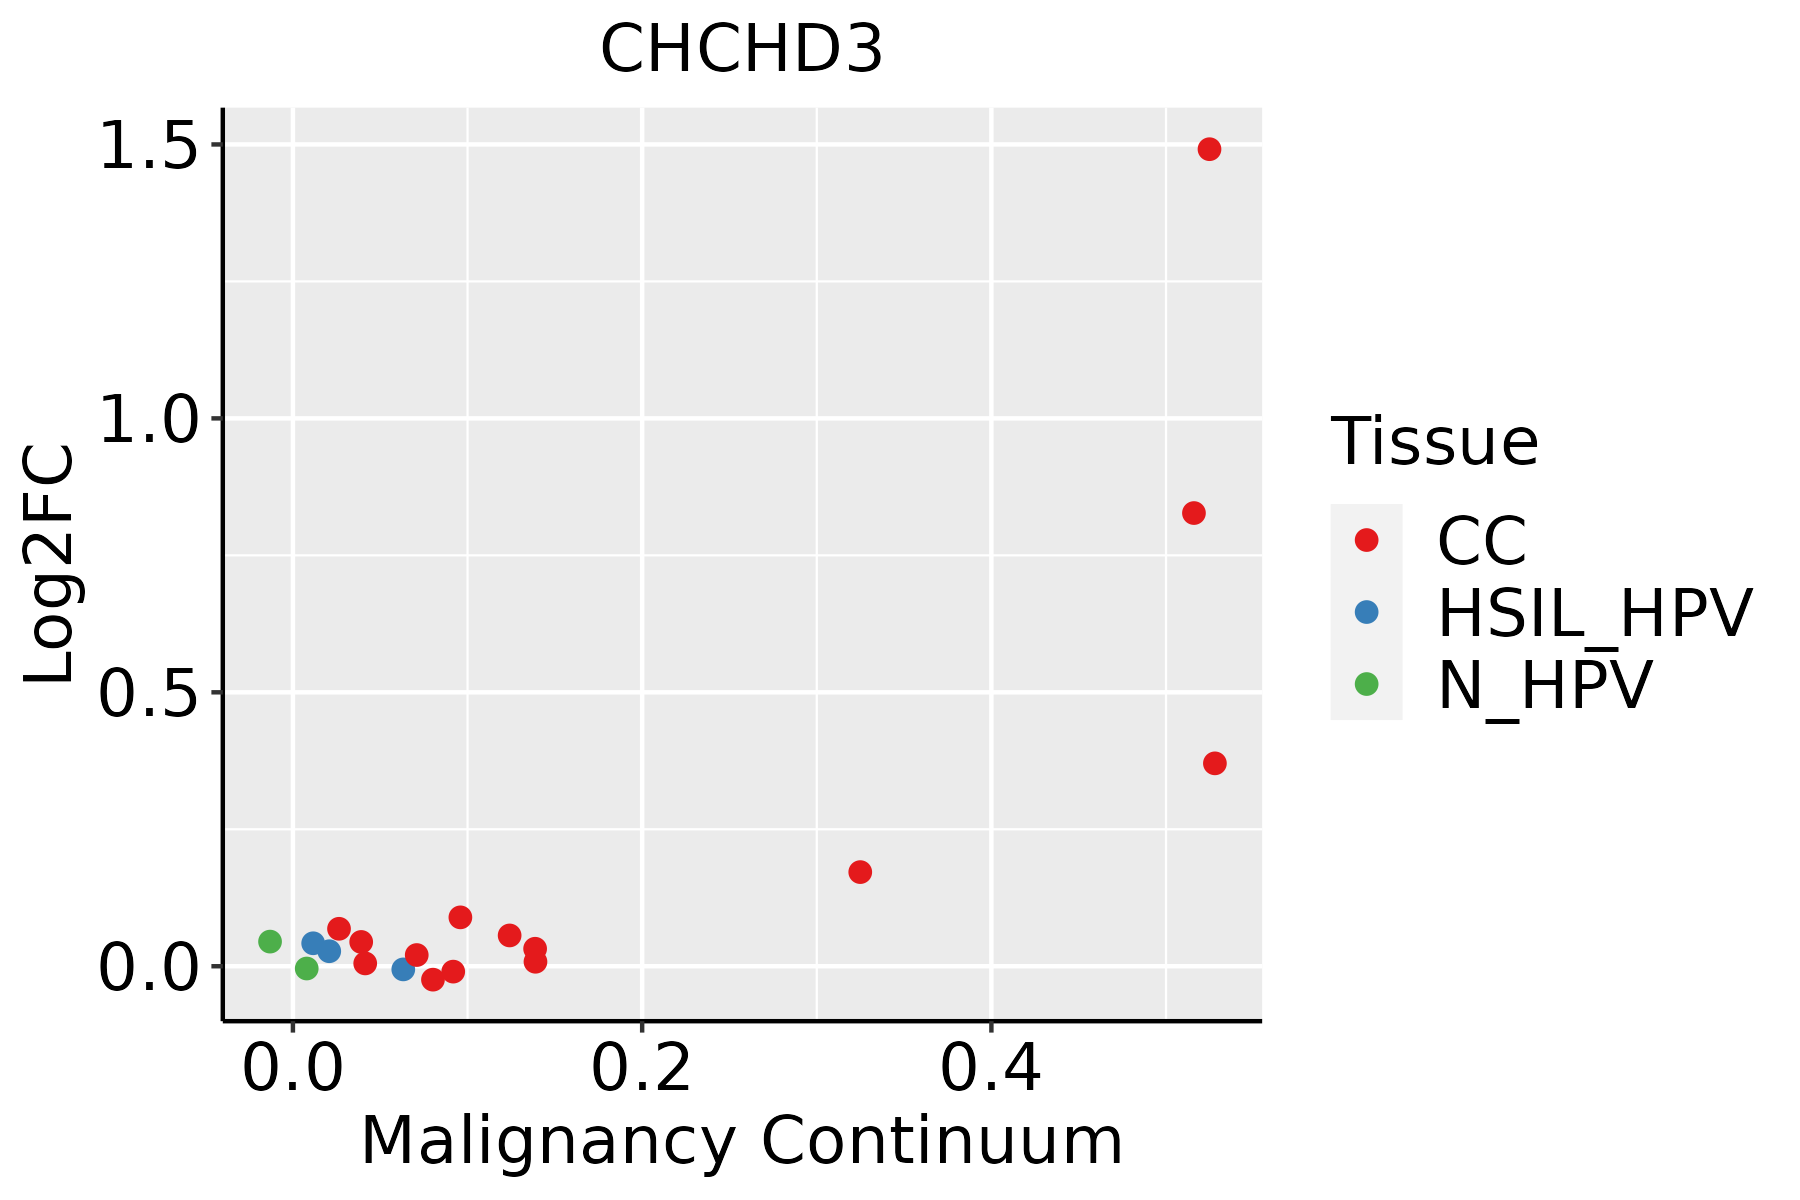 | CC: Cervix cancer |
| HSIL_HPV: HPV-infected high-grade squamous intraepithelial lesions |
| N_HPV: HPV-infected normal cervix |
| Colorectum (GSE201348) |  | FAP: Familial adenomatous polyposis |
| CRC: Colorectal cancer |
| Colorectum (HTA11) |  | AD: Adenomas |
| SER: Sessile serrated lesions |
| MSI-H: Microsatellite-high colorectal cancer |
| MSS: Microsatellite stable colorectal cancer |
| Esophagus | 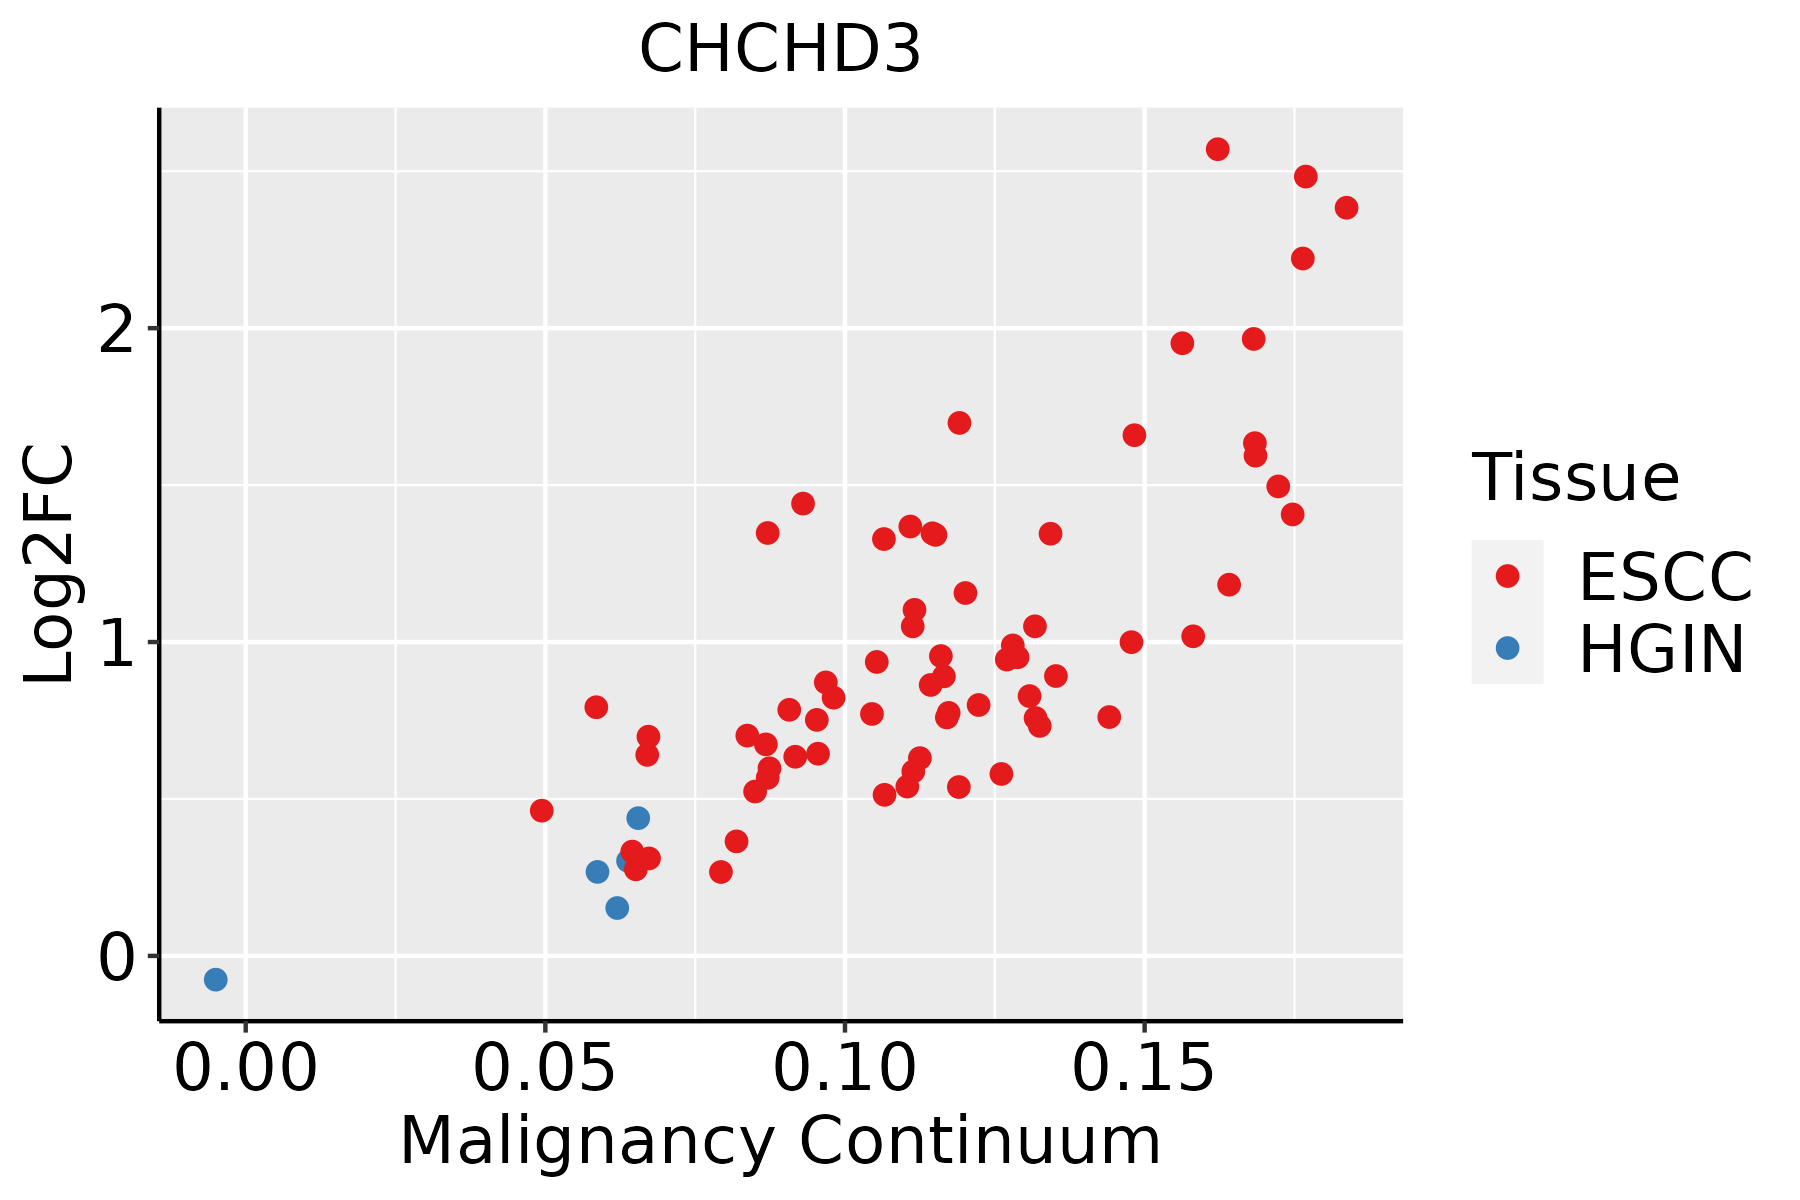 | ESCC: Esophageal squamous cell carcinoma |
| HGIN: High-grade intraepithelial neoplasias |
| LGIN: Low-grade intraepithelial neoplasias |
| Liver | 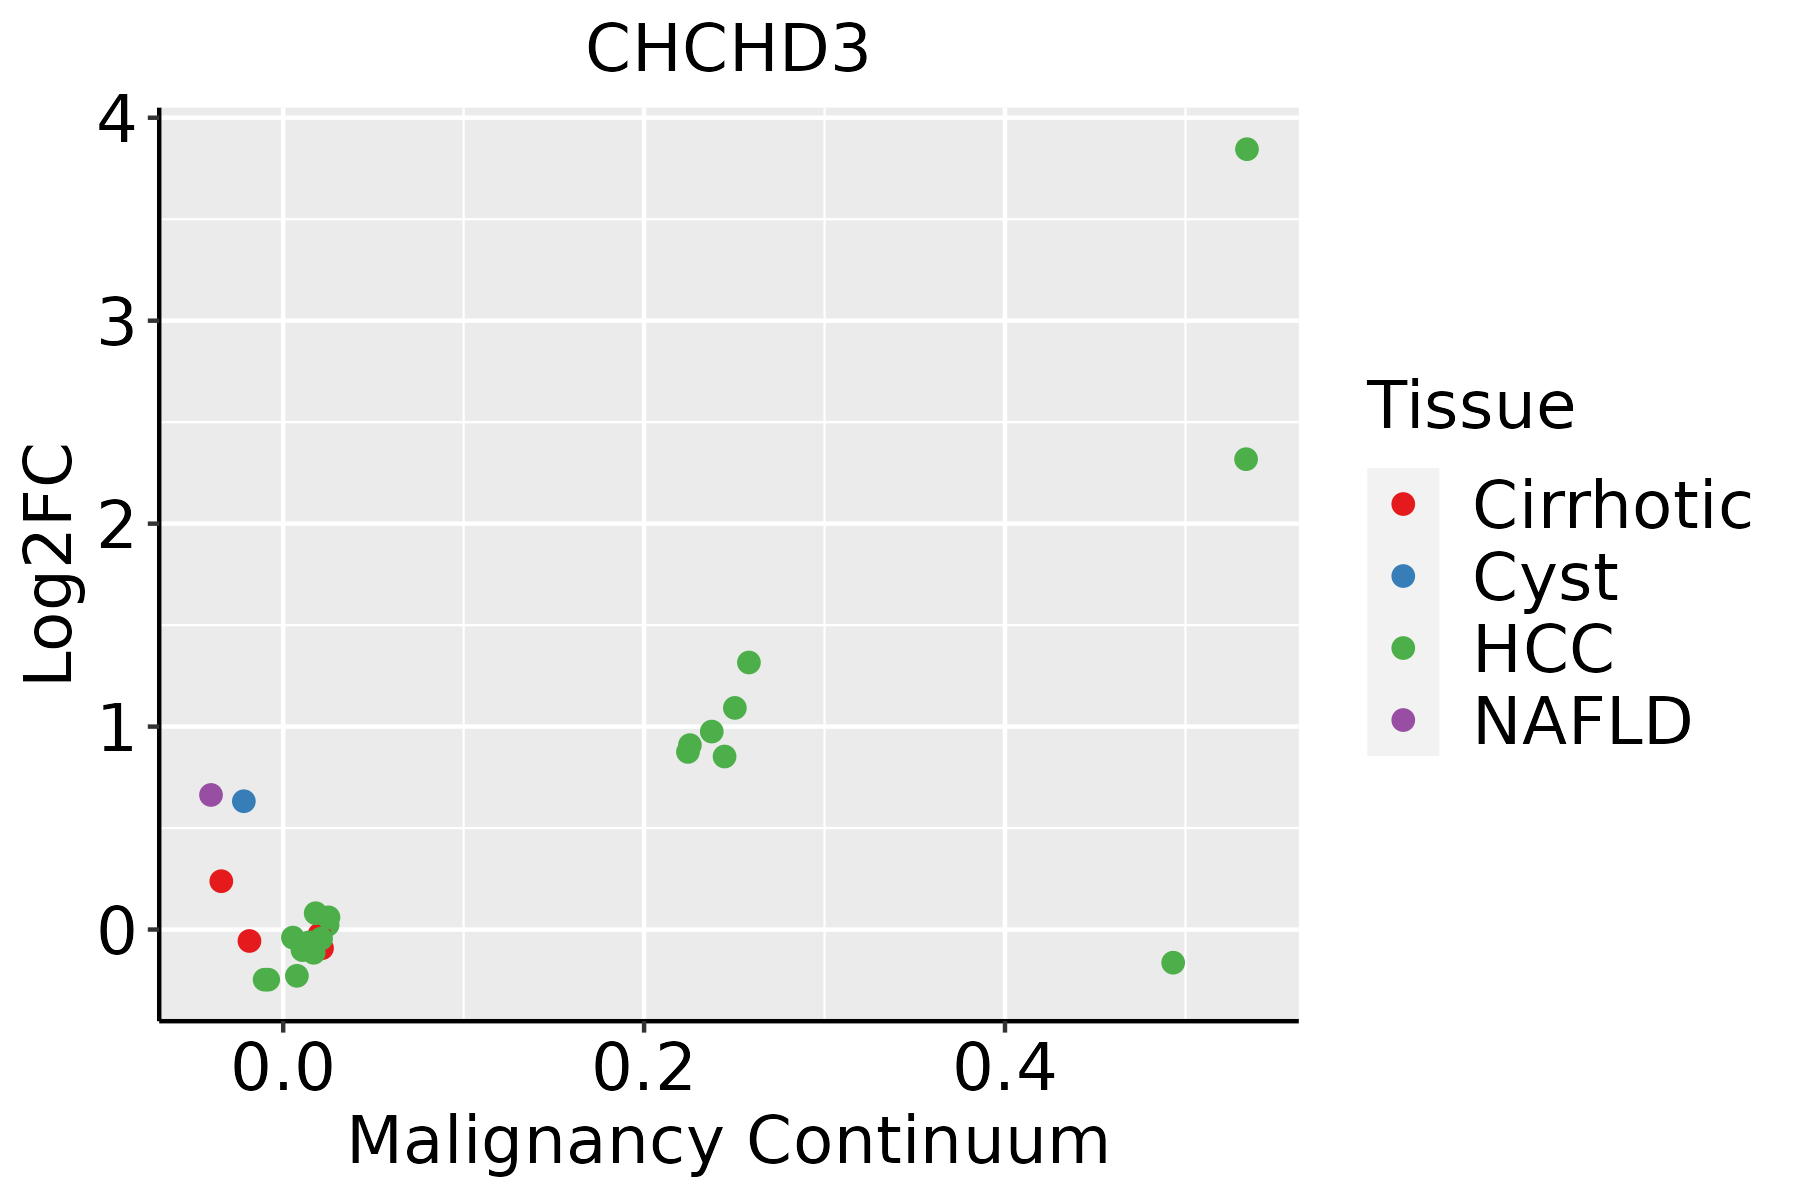 | HCC: Hepatocellular carcinoma |
| NAFLD: Non-alcoholic fatty liver disease |
| Lung | 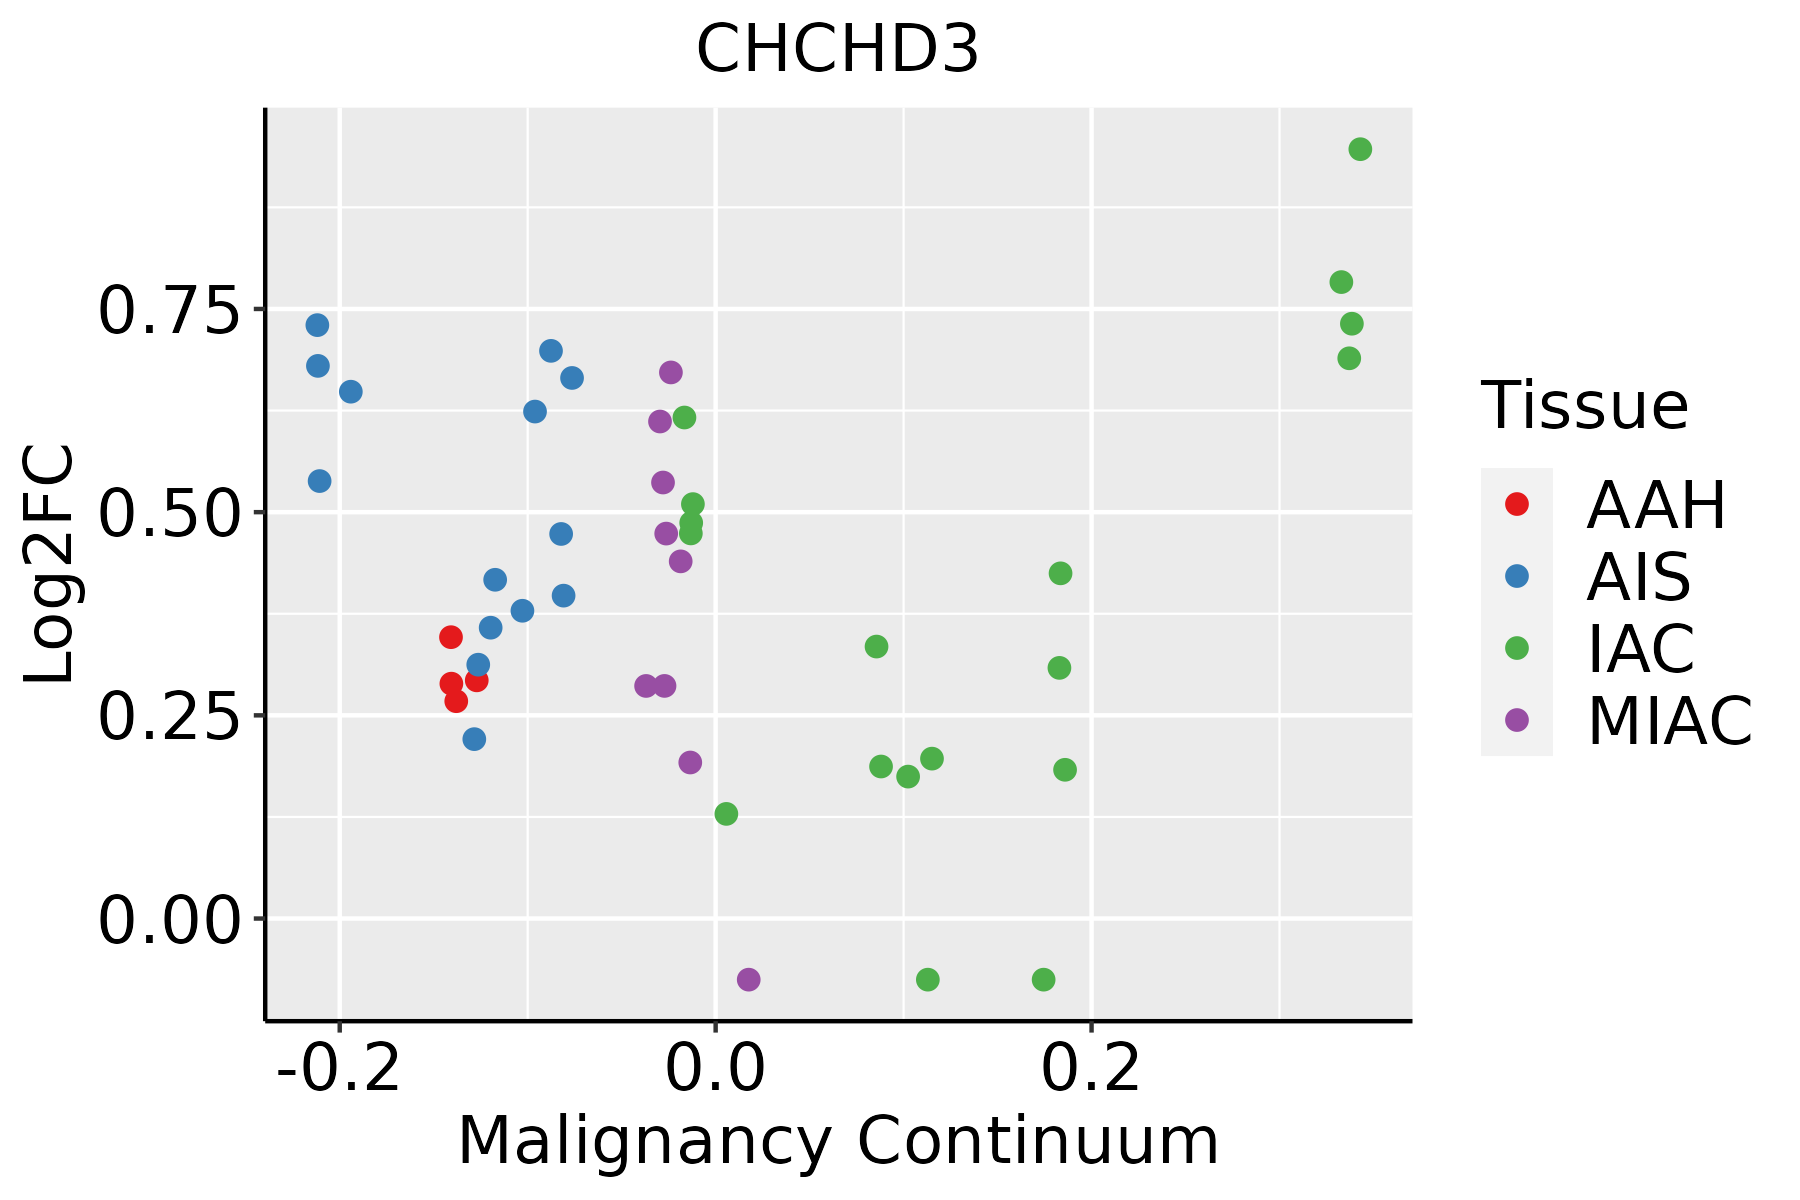 | AAH: Atypical adenomatous hyperplasia |
| AIS: Adenocarcinoma in situ |
| IAC: Invasive lung adenocarcinoma |
| MIA: Minimally invasive adenocarcinoma |
| Oral Cavity | 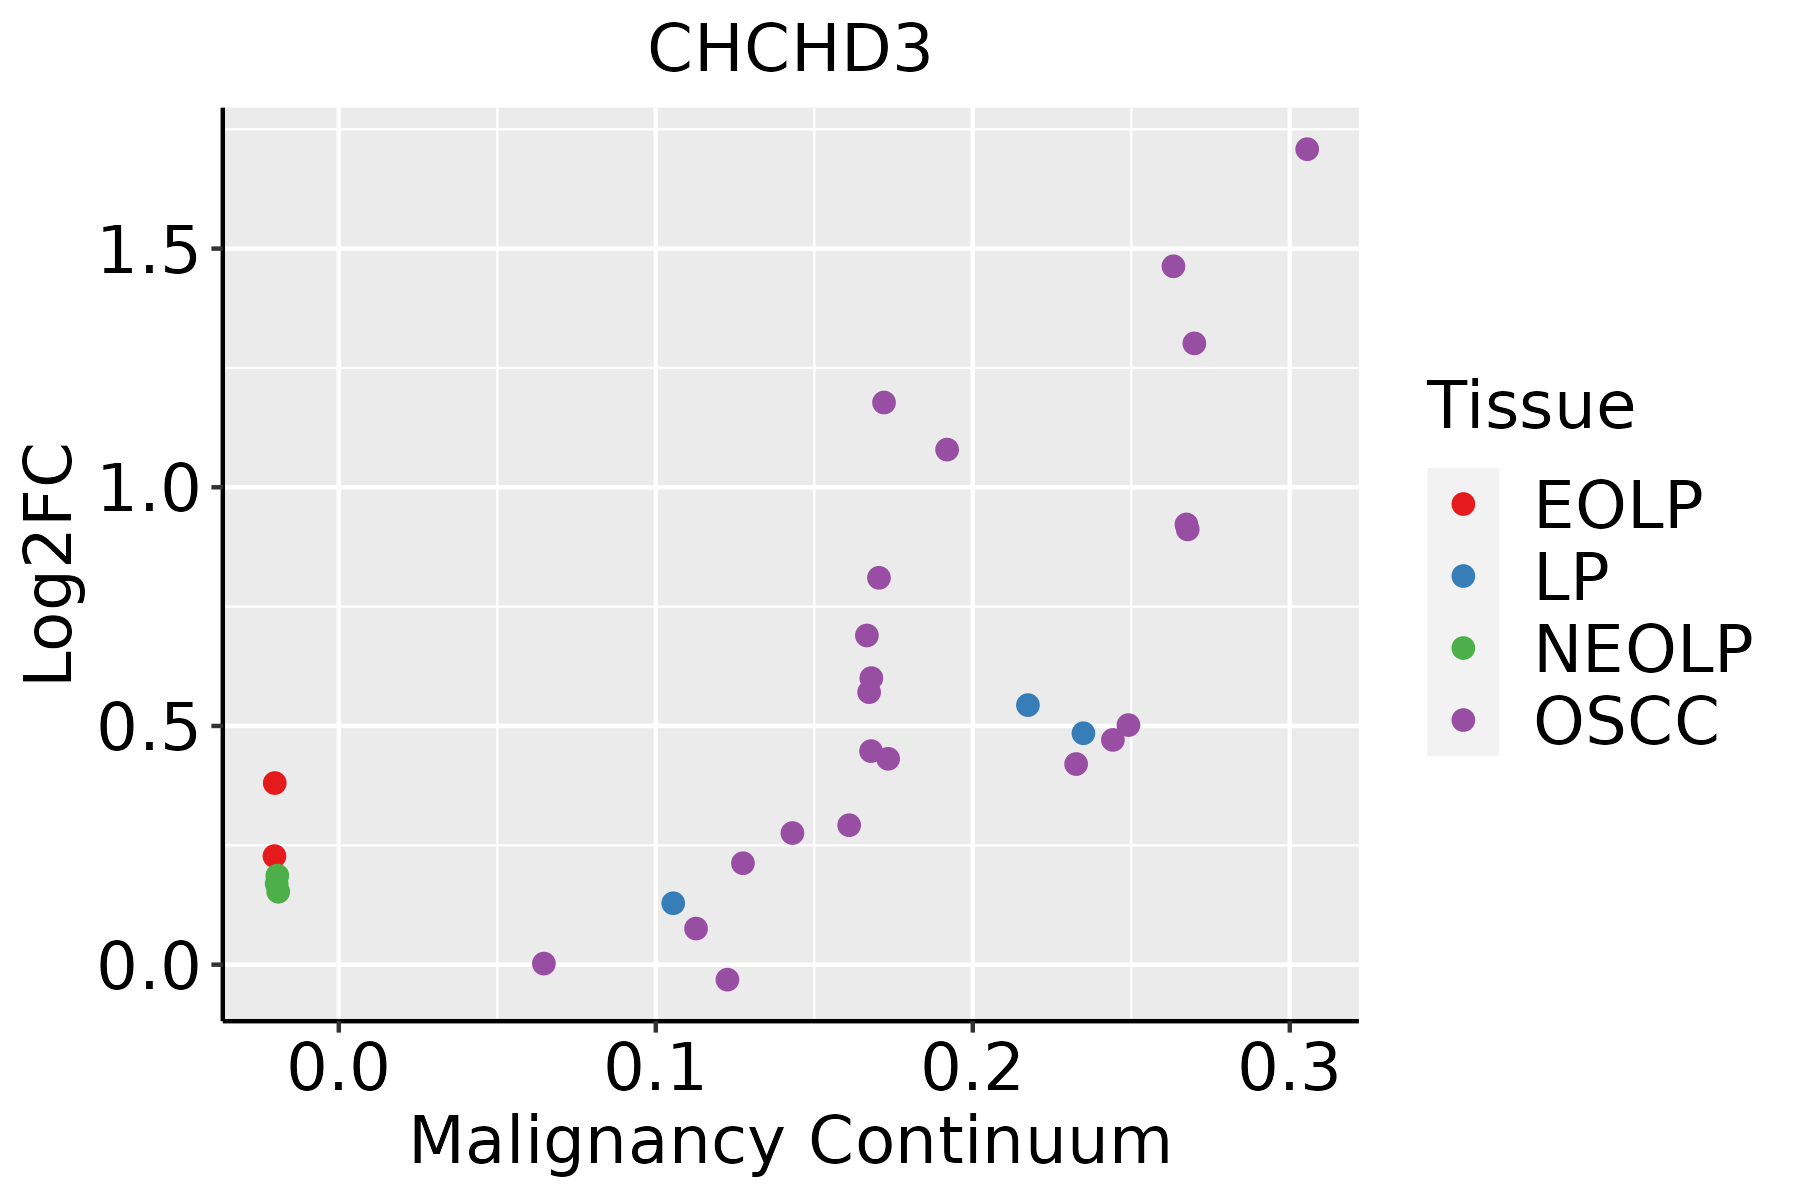 | EOLP: Erosive Oral lichen planus |
| LP: leukoplakia |
| NEOLP: Non-erosive oral lichen planus |
| OSCC: Oral squamous cell carcinoma |
| Skin | 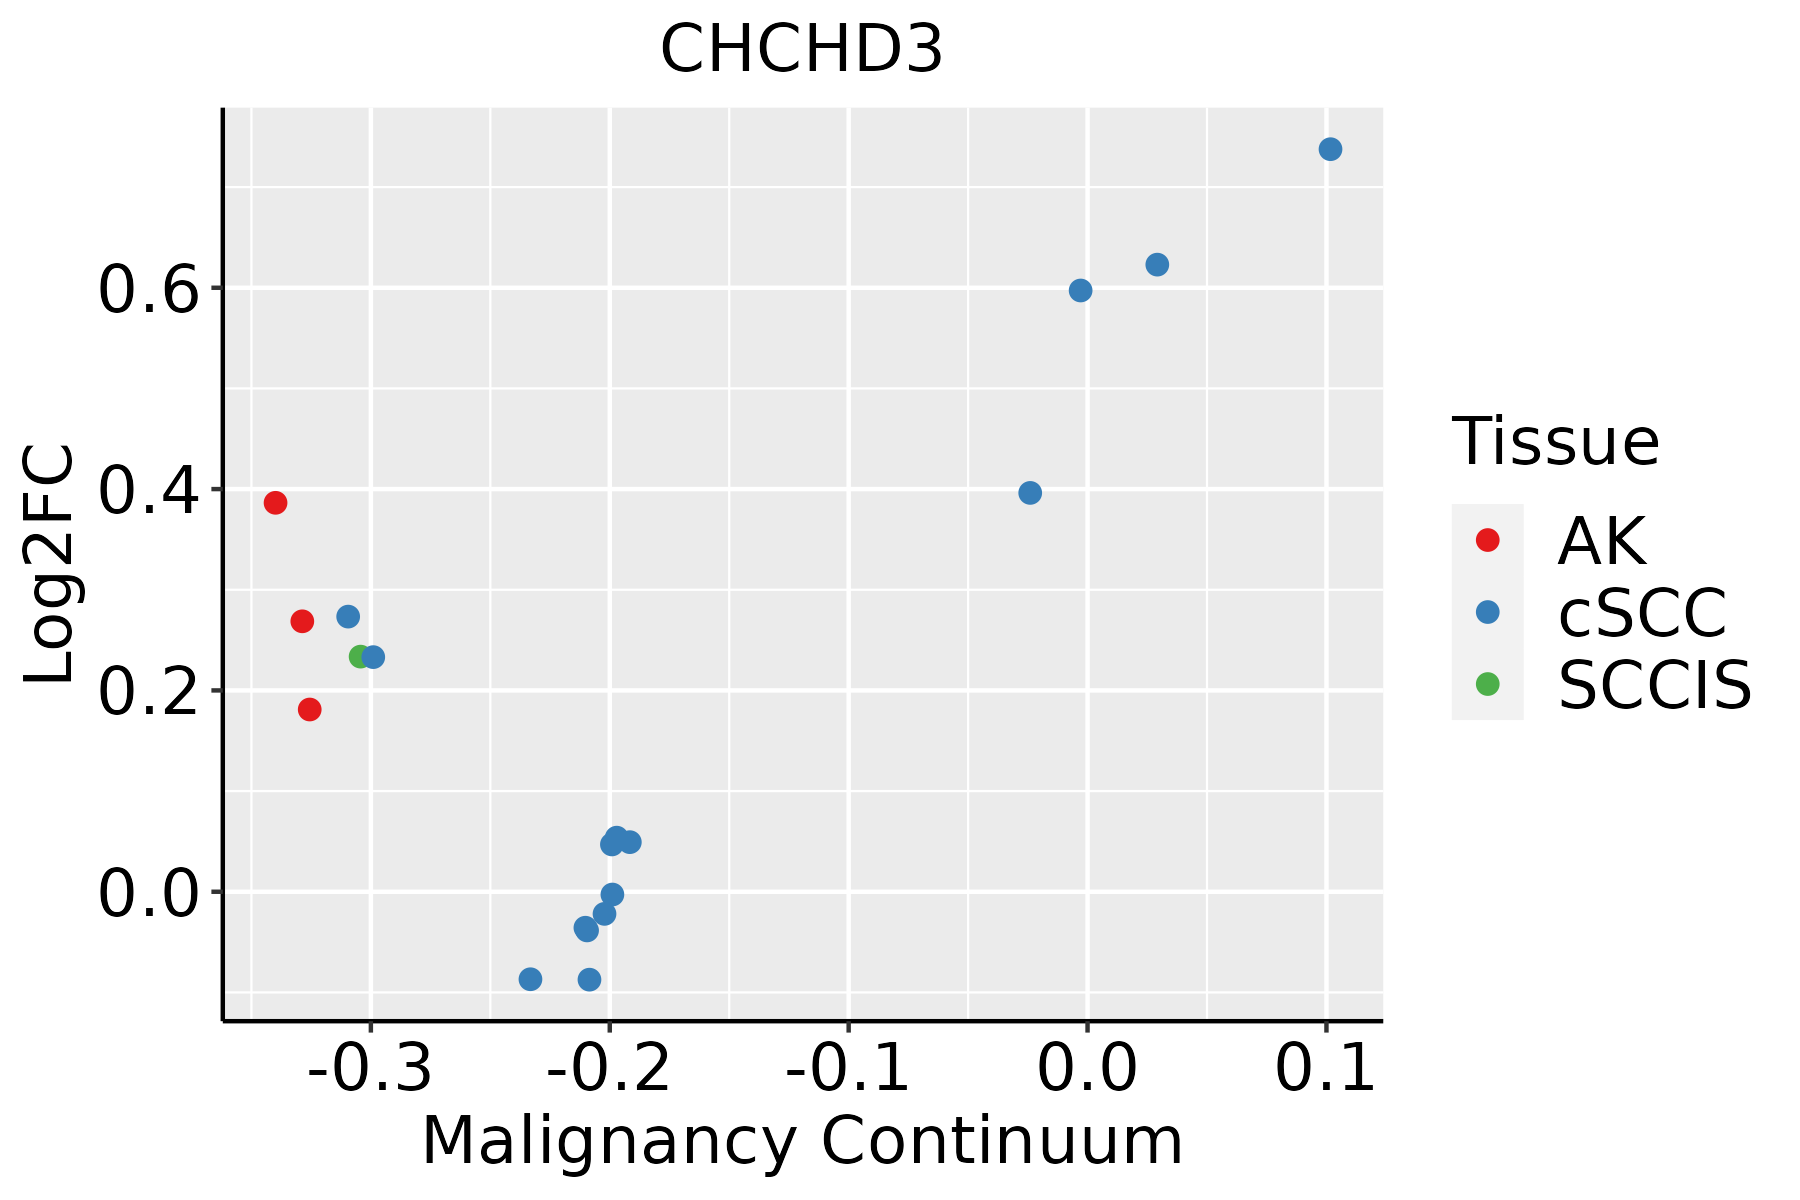 | AK: Actinic keratosis |
| cSCC: Cutaneous squamous cell carcinoma |
| SCCIS:squamous cell carcinoma in situ |
| Thyroid | 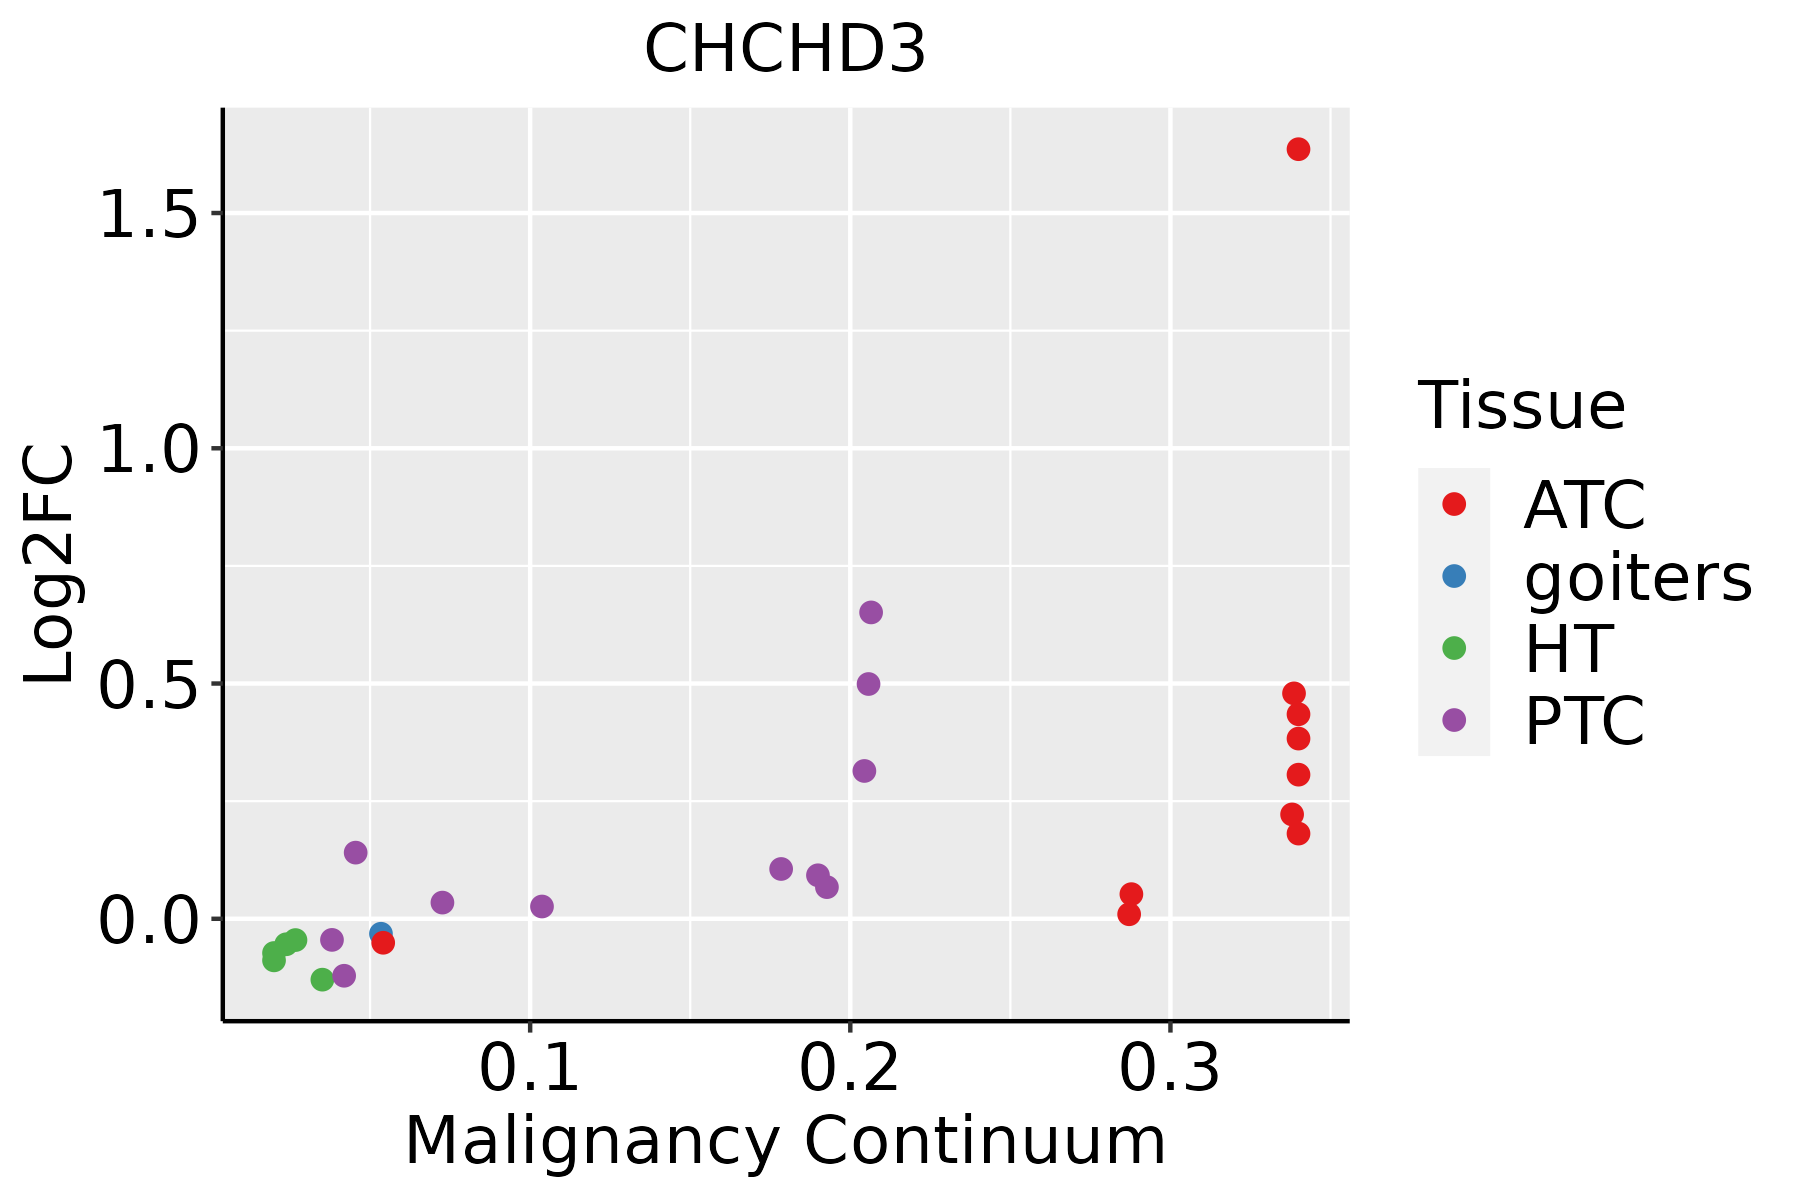 | ATC: Anaplastic thyroid cancer |
| HT: Hashimoto's thyroiditis |
| PTC: Papillary thyroid cancer |
| GO ID | Tissue | Disease Stage | Description | Gene Ratio | Bg Ratio | pvalue | p.adjust | Count |
| GO:00070067 | Cervix | CC | mitochondrial membrane organization | 28/2311 | 116/18723 | 3.28e-04 | 3.47e-03 | 28 |
| GO:00070074 | Cervix | CC | inner mitochondrial membrane organization | 11/2311 | 38/18723 | 4.94e-03 | 2.95e-02 | 11 |
| GO:0007006 | Colorectum | AD | mitochondrial membrane organization | 48/3918 | 116/18723 | 4.53e-07 | 1.72e-05 | 48 |
| GO:0007007 | Colorectum | AD | inner mitochondrial membrane organization | 18/3918 | 38/18723 | 2.45e-04 | 3.09e-03 | 18 |
| GO:0048284 | Colorectum | AD | organelle fusion | 42/3918 | 141/18723 | 8.04e-03 | 4.73e-02 | 42 |
| GO:00070061 | Colorectum | SER | mitochondrial membrane organization | 38/2897 | 116/18723 | 2.66e-06 | 1.10e-04 | 38 |
| GO:00070071 | Colorectum | SER | inner mitochondrial membrane organization | 14/2897 | 38/18723 | 1.06e-03 | 1.23e-02 | 14 |
| GO:00070062 | Colorectum | MSS | mitochondrial membrane organization | 42/3467 | 116/18723 | 4.99e-06 | 1.38e-04 | 42 |
| GO:00482841 | Colorectum | MSS | organelle fusion | 39/3467 | 141/18723 | 4.91e-03 | 3.42e-02 | 39 |
| GO:00070072 | Colorectum | MSS | inner mitochondrial membrane organization | 14/3467 | 38/18723 | 6.00e-03 | 4.03e-02 | 14 |
| GO:00070063 | Colorectum | MSI-H | mitochondrial membrane organization | 18/1319 | 116/18723 | 1.24e-03 | 2.00e-02 | 18 |
| GO:000700618 | Esophagus | HGIN | mitochondrial membrane organization | 37/2587 | 116/18723 | 4.61e-07 | 2.07e-05 | 37 |
| GO:00070076 | Esophagus | HGIN | inner mitochondrial membrane organization | 16/2587 | 38/18723 | 1.82e-05 | 4.93e-04 | 16 |
| GO:000700619 | Esophagus | ESCC | mitochondrial membrane organization | 93/8552 | 116/18723 | 2.16e-14 | 1.11e-12 | 93 |
| GO:00482844 | Esophagus | ESCC | organelle fusion | 94/8552 | 141/18723 | 3.72e-07 | 5.16e-06 | 94 |
| GO:000700713 | Esophagus | ESCC | inner mitochondrial membrane organization | 31/8552 | 38/18723 | 5.93e-06 | 6.10e-05 | 31 |
| GO:00080532 | Esophagus | ESCC | mitochondrial fusion | 20/8552 | 27/18723 | 2.61e-03 | 1.11e-02 | 20 |
| GO:00424072 | Esophagus | ESCC | cristae formation | 13/8552 | 16/18723 | 4.05e-03 | 1.62e-02 | 13 |
| GO:00070065 | Liver | Cirrhotic | mitochondrial membrane organization | 57/4634 | 116/18723 | 1.13e-08 | 4.29e-07 | 57 |
| GO:00070073 | Liver | Cirrhotic | inner mitochondrial membrane organization | 19/4634 | 38/18723 | 6.75e-04 | 5.06e-03 | 19 |
| Hugo Symbol | Variant Class | Variant Classification | dbSNP RS | HGVSc | HGVSp | HGVSp Short | SWISSPROT | BIOTYPE | SIFT | PolyPhen | Tumor Sample Barcode | Tissue | Histology | Sex | Age | Stage | Therapy Types | Drugs | Outcome |
| CHCHD3 | SNV | Missense_Mutation | | c.586N>C | p.Glu196Gln | p.E196Q | Q9NX63 | protein_coding | tolerated(0.52) | benign(0.015) | TCGA-AC-A5XS-01 | Breast | breast invasive carcinoma | Female | >=65 | I/II | Hormone Therapy | femara | SD |
| CHCHD3 | SNV | Missense_Mutation | | c.670N>C | p.Glu224Gln | p.E224Q | Q9NX63 | protein_coding | tolerated(0.66) | benign(0) | TCGA-BH-A0B6-01 | Breast | breast invasive carcinoma | Female | <65 | I/II | Unknown | Unknown | SD |
| CHCHD3 | SNV | Missense_Mutation | | c.670N>C | p.Glu224Gln | p.E224Q | Q9NX63 | protein_coding | tolerated(0.66) | benign(0) | TCGA-C8-A1HM-01 | Breast | breast invasive carcinoma | Female | >=65 | I/II | Chemotherapy | doxorubicin | CR |
| CHCHD3 | SNV | Missense_Mutation | novel | c.211G>A | p.Ala71Thr | p.A71T | Q9NX63 | protein_coding | deleterious(0.05) | probably_damaging(0.984) | TCGA-F5-6814-01 | Colorectum | rectum adenocarcinoma | Male | <65 | I/II | Unknown | Unknown | SD |
| CHCHD3 | SNV | Missense_Mutation | rs747561997 | c.583N>T | p.Arg195Cys | p.R195C | Q9NX63 | protein_coding | deleterious(0.05) | benign(0.003) | TCGA-AP-A0LM-01 | Endometrium | uterine corpus endometrioid carcinoma | Female | <65 | III/IV | Chemotherapy | cisplatin | SD |
| CHCHD3 | SNV | Missense_Mutation | novel | c.128G>A | p.Gly43Asp | p.G43D | Q9NX63 | protein_coding | tolerated(0.16) | possibly_damaging(0.53) | TCGA-B5-A11E-01 | Endometrium | uterine corpus endometrioid carcinoma | Female | <65 | I/II | Unknown | Unknown | SD |
| CHCHD3 | SNV | Missense_Mutation | novel | c.453G>T | p.Arg151Ser | p.R151S | Q9NX63 | protein_coding | deleterious(0) | probably_damaging(0.99) | TCGA-B5-A5OC-01 | Endometrium | uterine corpus endometrioid carcinoma | Female | >=65 | III/IV | Chemotherapy | cisplatin | SD |
| CHCHD3 | SNV | Missense_Mutation | rs145165887 | c.584N>A | p.Arg195His | p.R195H | Q9NX63 | protein_coding | deleterious(0.02) | benign(0.323) | TCGA-D1-A103-01 | Endometrium | uterine corpus endometrioid carcinoma | Female | >=65 | I/II | Unknown | Unknown | SD |
| CHCHD3 | SNV | Missense_Mutation | novel | c.10N>G | p.Thr4Ala | p.T4A | Q9NX63 | protein_coding | tolerated(0.3) | benign(0) | TCGA-D1-A167-01 | Endometrium | uterine corpus endometrioid carcinoma | Female | >=65 | I/II | Unknown | Unknown | SD |
| CHCHD3 | SNV | Missense_Mutation | | c.653N>T | p.Ala218Val | p.A218V | Q9NX63 | protein_coding | deleterious(0) | probably_damaging(0.922) | TCGA-D1-A16X-01 | Endometrium | uterine corpus endometrioid carcinoma | Female | <65 | I/II | Unknown | Unknown | SD |


