
|
|||||
|
 | |
| |
| |
| |
| |
| |
|
Gene: CHAMP1 |
Gene summary for CHAMP1 |
| Gene information | Species | Human | Gene symbol | CHAMP1 | Gene ID | 283489 |
| Gene name | chromosome alignment maintaining phosphoprotein 1 | |
| Gene Alias | C13orf8 | |
| Cytomap | 13q34 | |
| Gene Type | protein-coding | GO ID | GO:0000070 | UniProtAcc | Q96JM3 |
Top |
Malignant transformation analysis |
| Identification of the aberrant gene expression in precancerous and cancerous lesions by comparing the gene expression of stem-like cells in diseased tissues with normal stem cells |
| Entrez ID | Symbol | Replicates | Species | Organ | Tissue | Adj P-value | Log2FC | Malignancy |
| 283489 | CHAMP1 | LZE24T | Human | Esophagus | ESCC | 3.48e-09 | 2.23e-01 | 0.0596 |
| 283489 | CHAMP1 | P2T-E | Human | Esophagus | ESCC | 6.68e-16 | 2.64e-01 | 0.1177 |
| 283489 | CHAMP1 | P4T-E | Human | Esophagus | ESCC | 1.61e-03 | 1.21e-01 | 0.1323 |
| 283489 | CHAMP1 | P5T-E | Human | Esophagus | ESCC | 4.74e-05 | 7.41e-02 | 0.1327 |
| 283489 | CHAMP1 | P8T-E | Human | Esophagus | ESCC | 1.37e-12 | 1.65e-01 | 0.0889 |
| 283489 | CHAMP1 | P10T-E | Human | Esophagus | ESCC | 7.89e-06 | 1.27e-01 | 0.116 |
| 283489 | CHAMP1 | P11T-E | Human | Esophagus | ESCC | 5.79e-10 | 4.28e-01 | 0.1426 |
| 283489 | CHAMP1 | P12T-E | Human | Esophagus | ESCC | 1.88e-14 | 2.07e-01 | 0.1122 |
| 283489 | CHAMP1 | P15T-E | Human | Esophagus | ESCC | 2.16e-06 | 1.29e-01 | 0.1149 |
| 283489 | CHAMP1 | P16T-E | Human | Esophagus | ESCC | 1.78e-17 | 3.69e-01 | 0.1153 |
| 283489 | CHAMP1 | P17T-E | Human | Esophagus | ESCC | 2.64e-02 | 1.91e-01 | 0.1278 |
| 283489 | CHAMP1 | P20T-E | Human | Esophagus | ESCC | 1.96e-02 | 7.12e-02 | 0.1124 |
| 283489 | CHAMP1 | P21T-E | Human | Esophagus | ESCC | 6.53e-16 | 1.49e-01 | 0.1617 |
| 283489 | CHAMP1 | P22T-E | Human | Esophagus | ESCC | 3.87e-12 | 8.63e-02 | 0.1236 |
| 283489 | CHAMP1 | P23T-E | Human | Esophagus | ESCC | 7.80e-14 | 1.52e-01 | 0.108 |
| 283489 | CHAMP1 | P24T-E | Human | Esophagus | ESCC | 8.30e-07 | 1.00e-01 | 0.1287 |
| 283489 | CHAMP1 | P26T-E | Human | Esophagus | ESCC | 1.71e-10 | 2.09e-01 | 0.1276 |
| 283489 | CHAMP1 | P27T-E | Human | Esophagus | ESCC | 1.49e-08 | 7.69e-02 | 0.1055 |
| 283489 | CHAMP1 | P28T-E | Human | Esophagus | ESCC | 1.08e-11 | 2.37e-01 | 0.1149 |
| 283489 | CHAMP1 | P30T-E | Human | Esophagus | ESCC | 4.22e-08 | 2.69e-01 | 0.137 |
| Page: 1 2 3 4 |
| Tissue | Expression Dynamics | Abbreviation |
| Esophagus |  | ESCC: Esophageal squamous cell carcinoma |
| HGIN: High-grade intraepithelial neoplasias | ||
| LGIN: Low-grade intraepithelial neoplasias | ||
| Liver | 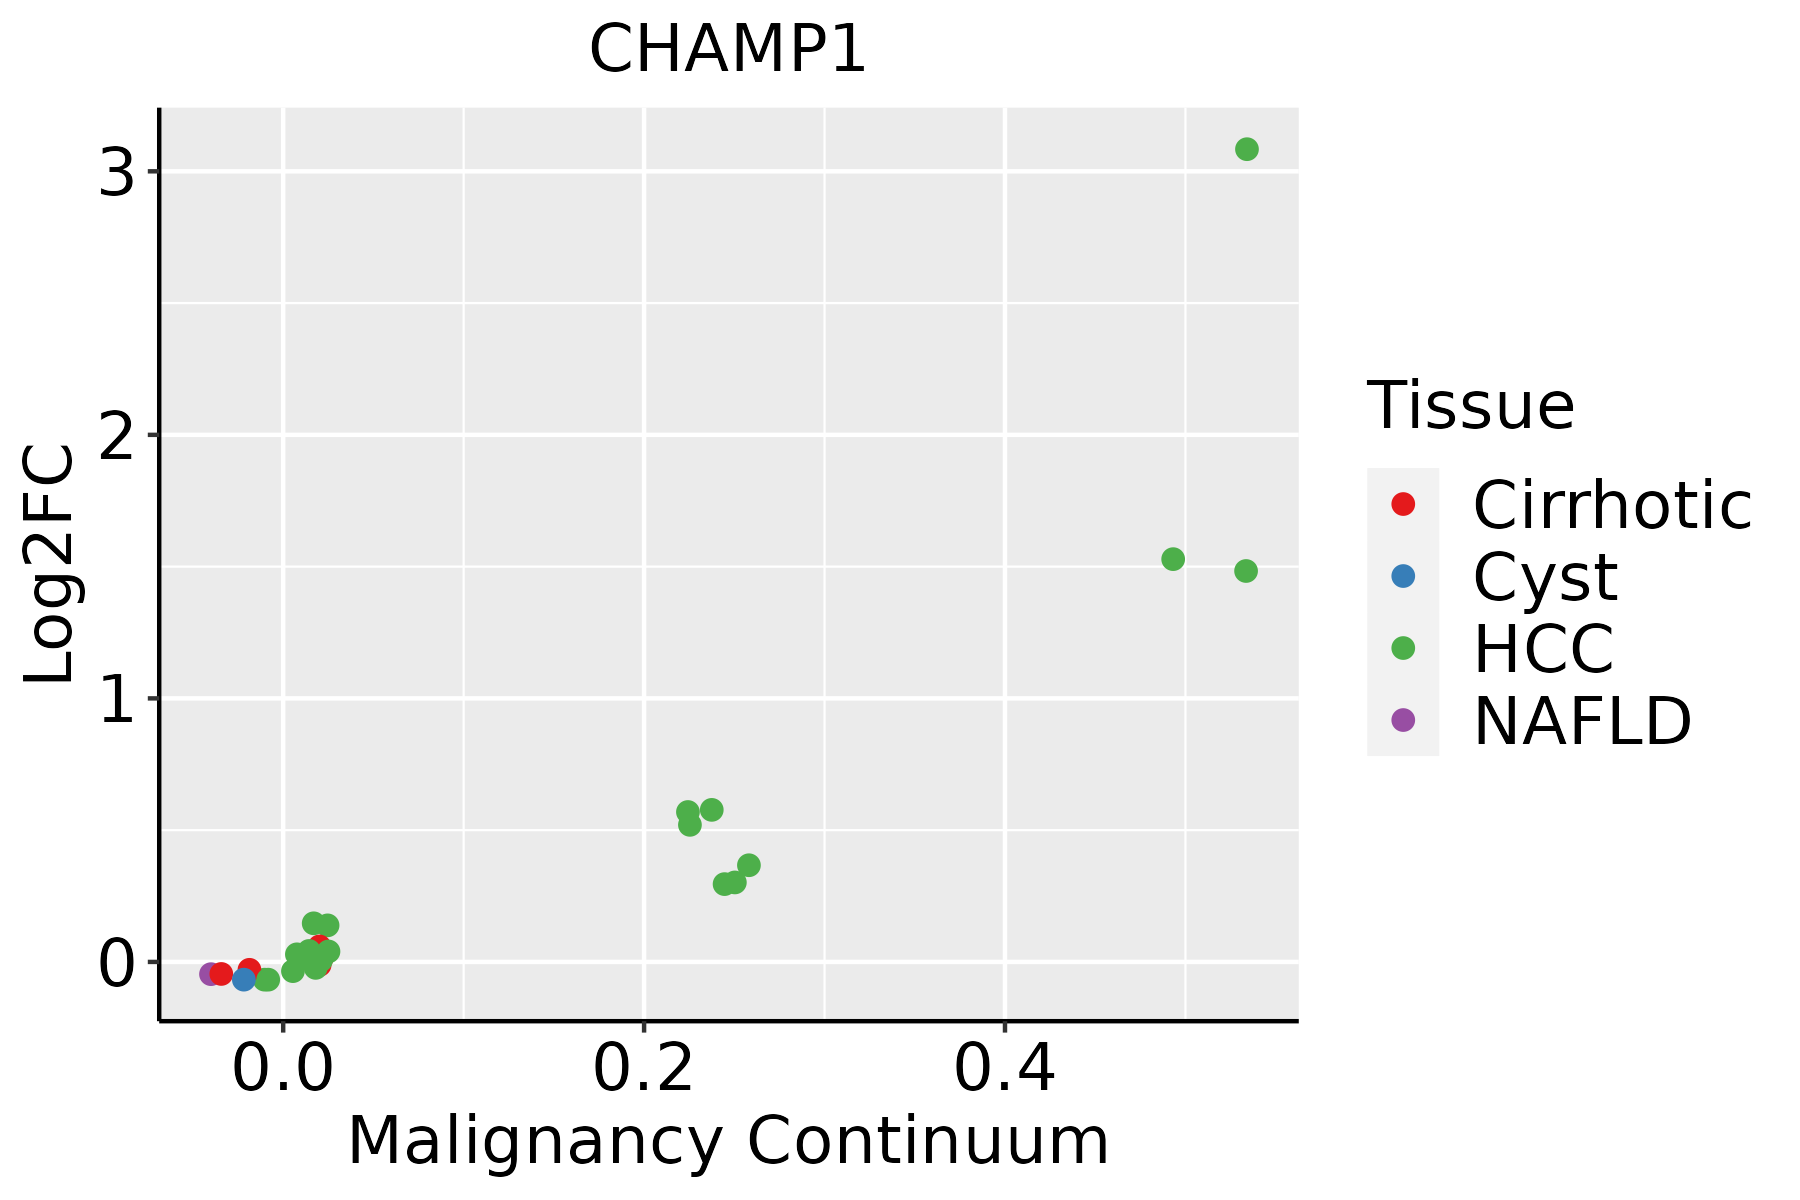 | HCC: Hepatocellular carcinoma |
| NAFLD: Non-alcoholic fatty liver disease | ||
| Oral Cavity |  | EOLP: Erosive Oral lichen planus |
| LP: leukoplakia | ||
| NEOLP: Non-erosive oral lichen planus | ||
| OSCC: Oral squamous cell carcinoma |
| ∗log2FC in expression of this searched gene in stem-like cells from each diseased tissue sample relative to stem-like cells in normal samples in each tissue plotted against the malignancy continuum. Samples are colored based on if they are from different disease stage. |
Top |
Malignant transformation related pathway analysis |
| Find out the enriched GO biological processes and KEGG pathways involved in transition from healthy to precancer to cancer |
| Tissue | Disease Stage | Enriched GO biological Processes |
| Colorectum | AD |  |
| Colorectum | SER |  |
| Colorectum | MSS |  |
| Colorectum | MSI-H |  |
| Colorectum | FAP |  |
| ∗Top 15 enriched GO BP terms are showed in the bar plot of each disease state in each tissue. Each row represents a significant GO biological process which is colored according to the -log10(p.adjust). |
| Page: 1 2 3 4 5 6 7 8 9 |
| GO ID | Tissue | Disease Stage | Description | Gene Ratio | Bg Ratio | pvalue | p.adjust | Count |
| GO:014001414 | Esophagus | ESCC | mitotic nuclear division | 218/8552 | 287/18723 | 6.17e-26 | 1.78e-23 | 218 |
| GO:005165617 | Esophagus | ESCC | establishment of organelle localization | 273/8552 | 390/18723 | 9.13e-23 | 1.81e-20 | 273 |
| GO:000007011 | Esophagus | ESCC | mitotic sister chromatid segregation | 138/8552 | 168/18723 | 1.37e-22 | 2.63e-20 | 138 |
| GO:00008194 | Esophagus | ESCC | sister chromatid segregation | 157/8552 | 202/18723 | 8.41e-21 | 1.33e-18 | 157 |
| GO:000705911 | Esophagus | ESCC | chromosome segregation | 238/8552 | 346/18723 | 1.72e-18 | 1.82e-16 | 238 |
| GO:005131011 | Esophagus | ESCC | metaphase plate congression | 58/8552 | 65/18723 | 1.81e-13 | 8.63e-12 | 58 |
| GO:000708011 | Esophagus | ESCC | mitotic metaphase plate congression | 47/8552 | 50/18723 | 3.15e-13 | 1.47e-11 | 47 |
| GO:00482853 | Esophagus | ESCC | organelle fission | 301/8552 | 488/18723 | 4.64e-13 | 2.12e-11 | 301 |
| GO:00988133 | Esophagus | ESCC | nuclear chromosome segregation | 187/8552 | 281/18723 | 1.00e-12 | 4.36e-11 | 187 |
| GO:005130311 | Esophagus | ESCC | establishment of chromosome localization | 67/8552 | 80/18723 | 1.92e-12 | 8.09e-11 | 67 |
| GO:005000011 | Esophagus | ESCC | chromosome localization | 68/8552 | 82/18723 | 3.37e-12 | 1.32e-10 | 68 |
| GO:00002802 | Esophagus | ESCC | nuclear division | 270/8552 | 439/18723 | 1.17e-11 | 4.24e-10 | 270 |
| GO:003450211 | Esophagus | ESCC | protein localization to chromosome | 70/8552 | 92/18723 | 2.54e-09 | 5.64e-08 | 70 |
| GO:00726985 | Esophagus | ESCC | protein localization to microtubule cytoskeleton | 43/8552 | 54/18723 | 3.28e-07 | 4.61e-06 | 43 |
| GO:00443804 | Esophagus | ESCC | protein localization to cytoskeleton | 45/8552 | 58/18723 | 6.89e-07 | 8.99e-06 | 45 |
| GO:00086081 | Esophagus | ESCC | attachment of spindle microtubules to kinetochore | 29/8552 | 35/18723 | 6.61e-06 | 6.75e-05 | 29 |
| GO:00513151 | Esophagus | ESCC | attachment of mitotic spindle microtubules to kinetochore | 15/8552 | 15/18723 | 7.81e-06 | 7.69e-05 | 15 |
| GO:0035372 | Esophagus | ESCC | protein localization to microtubule | 15/8552 | 18/18723 | 1.20e-03 | 5.88e-03 | 15 |
| GO:00714591 | Esophagus | ESCC | protein localization to chromosome, centromeric region | 18/8552 | 25/18723 | 7.04e-03 | 2.56e-02 | 18 |
| GO:014001411 | Liver | HCC | mitotic nuclear division | 174/7958 | 287/18723 | 3.74e-10 | 1.23e-08 | 174 |
| Page: 1 2 3 |
| Pathway ID | Tissue | Disease Stage | Description | Gene Ratio | Bg Ratio | pvalue | p.adjust | qvalue | Count |
| Page: 1 |
Top |
Cell-cell communication analysis |
| Identification of potential cell-cell interactions between two cell types and their ligand-receptor pairs for different disease states |
| Ligand | Receptor | LRpair | Pathway | Tissue | Disease Stage |
| Page: 1 |
Top |
Single-cell gene regulatory network inference analysis |
| Find out the significant the regulons (TFs) and the target genes of each regulon across cell types for different disease states |
| TF | Cell Type | Tissue | Disease Stage | Target Gene | RSS | Regulon Activity |
| ∗The dot plots of a searched regulon are shown for all cell subpopulations in each disease state of each tissue based on the regulon specific score inferred using pySCENIC and by calculating the average expression. |
| Page: 1 |
Top |
Somatic mutation of malignant transformation related genes |
| Annotation of somatic variants for genes involved in malignant transformation |
| Hugo Symbol | Variant Class | Variant Classification | dbSNP RS | HGVSc | HGVSp | HGVSp Short | SWISSPROT | BIOTYPE | SIFT | PolyPhen | Tumor Sample Barcode | Tissue | Histology | Sex | Age | Stage | Therapy Types | Drugs | Outcome |
| CHAMP1 | SNV | Missense_Mutation | novel | c.2352A>C | p.Leu784Phe | p.L784F | Q96JM3 | protein_coding | deleterious(0) | probably_damaging(0.996) | TCGA-A2-A4S3-01 | Breast | breast invasive carcinoma | Female | <65 | I/II | Unknown | Unknown | SD |
| CHAMP1 | SNV | Missense_Mutation | c.1010N>T | p.Ala337Val | p.A337V | Q96JM3 | protein_coding | tolerated(0.22) | benign(0.079) | TCGA-AC-A23H-01 | Breast | breast invasive carcinoma | Female | >=65 | I/II | Unknown | Unknown | PD | |
| CHAMP1 | SNV | Missense_Mutation | c.1729G>C | p.Glu577Gln | p.E577Q | Q96JM3 | protein_coding | tolerated(0.07) | benign(0.315) | TCGA-AO-A12D-01 | Breast | breast invasive carcinoma | Female | <65 | I/II | Chemotherapy | cyclophosphamide | SD | |
| CHAMP1 | SNV | Missense_Mutation | rs782768495 | c.1636N>T | p.Arg546Cys | p.R546C | Q96JM3 | protein_coding | deleterious(0.01) | possibly_damaging(0.83) | TCGA-B6-A1KF-01 | Breast | breast invasive carcinoma | Female | >=65 | I/II | Unknown | Unknown | SD |
| CHAMP1 | SNV | Missense_Mutation | novel | c.49N>C | p.Asp17His | p.D17H | Q96JM3 | protein_coding | deleterious(0) | probably_damaging(0.943) | TCGA-BH-A2L8-01 | Breast | breast invasive carcinoma | Female | <65 | I/II | Chemotherapy | cytoxan | CR |
| CHAMP1 | SNV | Missense_Mutation | novel | c.1025N>G | p.Ser342Cys | p.S342C | Q96JM3 | protein_coding | deleterious(0.02) | possibly_damaging(0.518) | TCGA-C5-A1BF-01 | Cervix | cervical & endocervical cancer | Female | <65 | I/II | Chemotherapy | cisplatin | PD |
| CHAMP1 | SNV | Missense_Mutation | novel | c.2356N>T | p.His786Tyr | p.H786Y | Q96JM3 | protein_coding | deleterious(0) | possibly_damaging(0.892) | TCGA-ZJ-AAXI-01 | Cervix | cervical & endocervical cancer | Female | >=65 | I/II | Unknown | Unknown | SD |
| CHAMP1 | insertion | In_Frame_Ins | novel | c.1944_1945insATG | p.Gly648_Gln649insMet | p.G648_Q649insM | Q96JM3 | protein_coding | TCGA-DS-A1OC-01 | Cervix | cervical & endocervical cancer | Female | <65 | I/II | Chemotherapy | gemcitabine | SD | ||
| CHAMP1 | deletion | Frame_Shift_Del | novel | c.2139_2158delNNNNNNNNNNNNNNNNNNNN | p.Cys714LysfsTer10 | p.C714Kfs*10 | Q96JM3 | protein_coding | TCGA-RA-A741-01 | Cervix | cervical & endocervical cancer | Female | <65 | I/II | Chemotherapy | cisplatin | SD | ||
| CHAMP1 | SNV | Missense_Mutation | c.2096N>T | p.Ala699Val | p.A699V | Q96JM3 | protein_coding | deleterious(0) | probably_damaging(0.96) | TCGA-AY-6197-01 | Colorectum | colon adenocarcinoma | Male | <65 | I/II | Unknown | Unknown | SD |
| Page: 1 2 3 4 5 6 7 8 |
Top |
Related drugs of malignant transformation related genes |
| Identification of chemicals and drugs interact with genes involved in malignant transfromation |
| (DGIdb 4.0) |
| Entrez ID | Symbol | Category | Interaction Types | Drug Claim Name | Drug Name | PMIDs |
| Page: 1 |

Copyright 2023-Present -The University of Texas Health Science Center at Houston |