
|
|||||
|
 | |
| |
| |
| |
| |
| |
|
Gene: CHAF1A |
Gene summary for CHAF1A |
| Gene information | Species | Human | Gene symbol | CHAF1A | Gene ID | 10036 |
| Gene name | chromatin assembly factor 1 subunit A | |
| Gene Alias | CAF-1 | |
| Cytomap | 19p13.3 | |
| Gene Type | protein-coding | GO ID | GO:0006139 | UniProtAcc | Q13111 |
Top |
Malignant transformation analysis |
| Identification of the aberrant gene expression in precancerous and cancerous lesions by comparing the gene expression of stem-like cells in diseased tissues with normal stem cells |
| Entrez ID | Symbol | Replicates | Species | Organ | Tissue | Adj P-value | Log2FC | Malignancy |
| 10036 | CHAF1A | LZE7T | Human | Esophagus | ESCC | 9.32e-08 | 3.53e-01 | 0.0667 |
| 10036 | CHAF1A | LZE24T | Human | Esophagus | ESCC | 7.65e-05 | 1.35e-01 | 0.0596 |
| 10036 | CHAF1A | LZE21T | Human | Esophagus | ESCC | 1.16e-05 | 2.85e-01 | 0.0655 |
| 10036 | CHAF1A | P1T-E | Human | Esophagus | ESCC | 1.98e-11 | 6.14e-01 | 0.0875 |
| 10036 | CHAF1A | P2T-E | Human | Esophagus | ESCC | 3.99e-22 | 4.38e-01 | 0.1177 |
| 10036 | CHAF1A | P4T-E | Human | Esophagus | ESCC | 3.52e-15 | 3.95e-01 | 0.1323 |
| 10036 | CHAF1A | P5T-E | Human | Esophagus | ESCC | 1.00e-14 | 2.77e-01 | 0.1327 |
| 10036 | CHAF1A | P8T-E | Human | Esophagus | ESCC | 2.78e-07 | 2.43e-01 | 0.0889 |
| 10036 | CHAF1A | P9T-E | Human | Esophagus | ESCC | 2.41e-06 | 2.13e-01 | 0.1131 |
| 10036 | CHAF1A | P10T-E | Human | Esophagus | ESCC | 7.30e-12 | 3.07e-01 | 0.116 |
| 10036 | CHAF1A | P15T-E | Human | Esophagus | ESCC | 2.11e-03 | 1.26e-01 | 0.1149 |
| 10036 | CHAF1A | P16T-E | Human | Esophagus | ESCC | 6.19e-03 | 1.29e-01 | 0.1153 |
| 10036 | CHAF1A | P17T-E | Human | Esophagus | ESCC | 8.50e-05 | 2.24e-01 | 0.1278 |
| 10036 | CHAF1A | P20T-E | Human | Esophagus | ESCC | 6.20e-06 | 1.51e-01 | 0.1124 |
| 10036 | CHAF1A | P21T-E | Human | Esophagus | ESCC | 2.73e-04 | 1.09e-01 | 0.1617 |
| 10036 | CHAF1A | P22T-E | Human | Esophagus | ESCC | 2.41e-03 | 1.34e-01 | 0.1236 |
| 10036 | CHAF1A | P23T-E | Human | Esophagus | ESCC | 5.52e-07 | 2.00e-01 | 0.108 |
| 10036 | CHAF1A | P24T-E | Human | Esophagus | ESCC | 2.61e-06 | 2.71e-01 | 0.1287 |
| 10036 | CHAF1A | P26T-E | Human | Esophagus | ESCC | 8.56e-05 | 1.89e-01 | 0.1276 |
| 10036 | CHAF1A | P27T-E | Human | Esophagus | ESCC | 7.19e-05 | 1.59e-01 | 0.1055 |
| Page: 1 2 3 4 |
| Tissue | Expression Dynamics | Abbreviation |
| Esophagus | 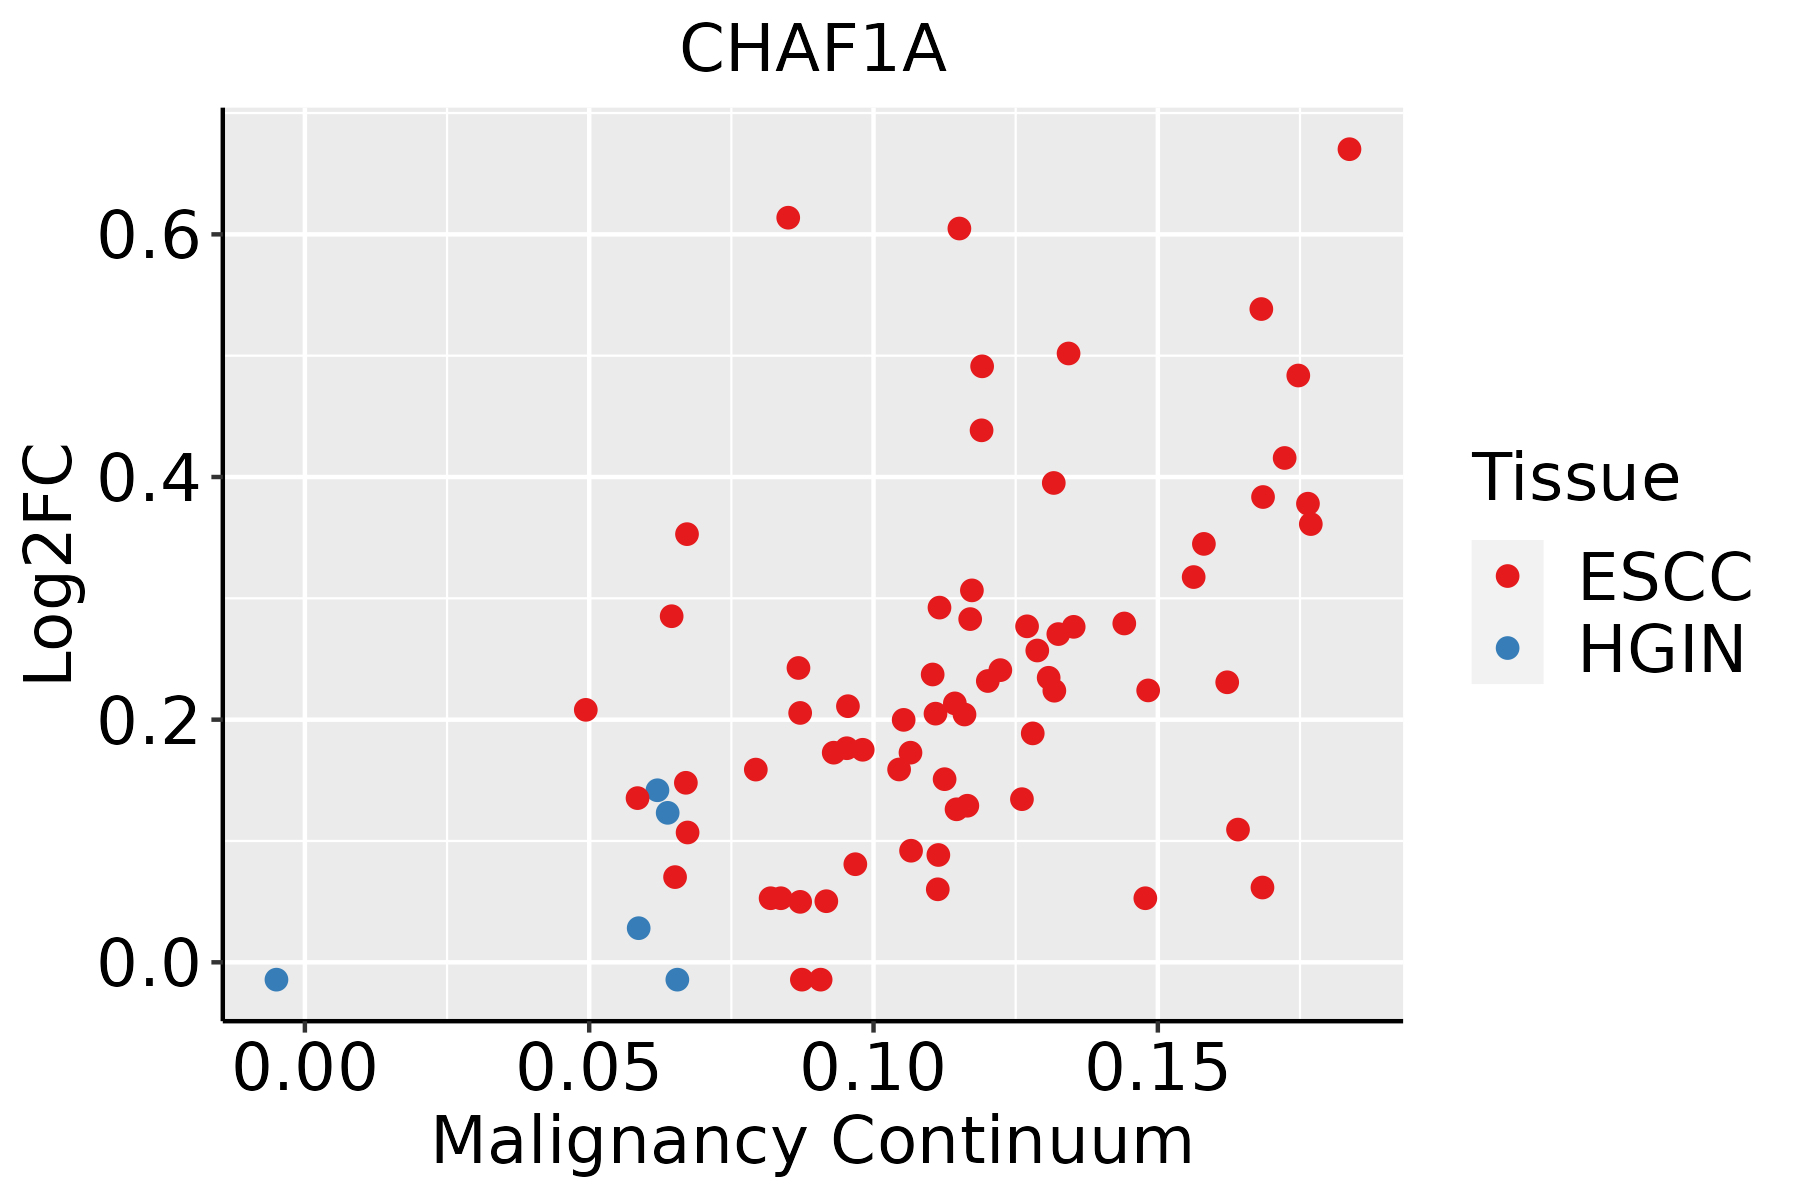 | ESCC: Esophageal squamous cell carcinoma |
| HGIN: High-grade intraepithelial neoplasias | ||
| LGIN: Low-grade intraepithelial neoplasias | ||
| Oral Cavity | 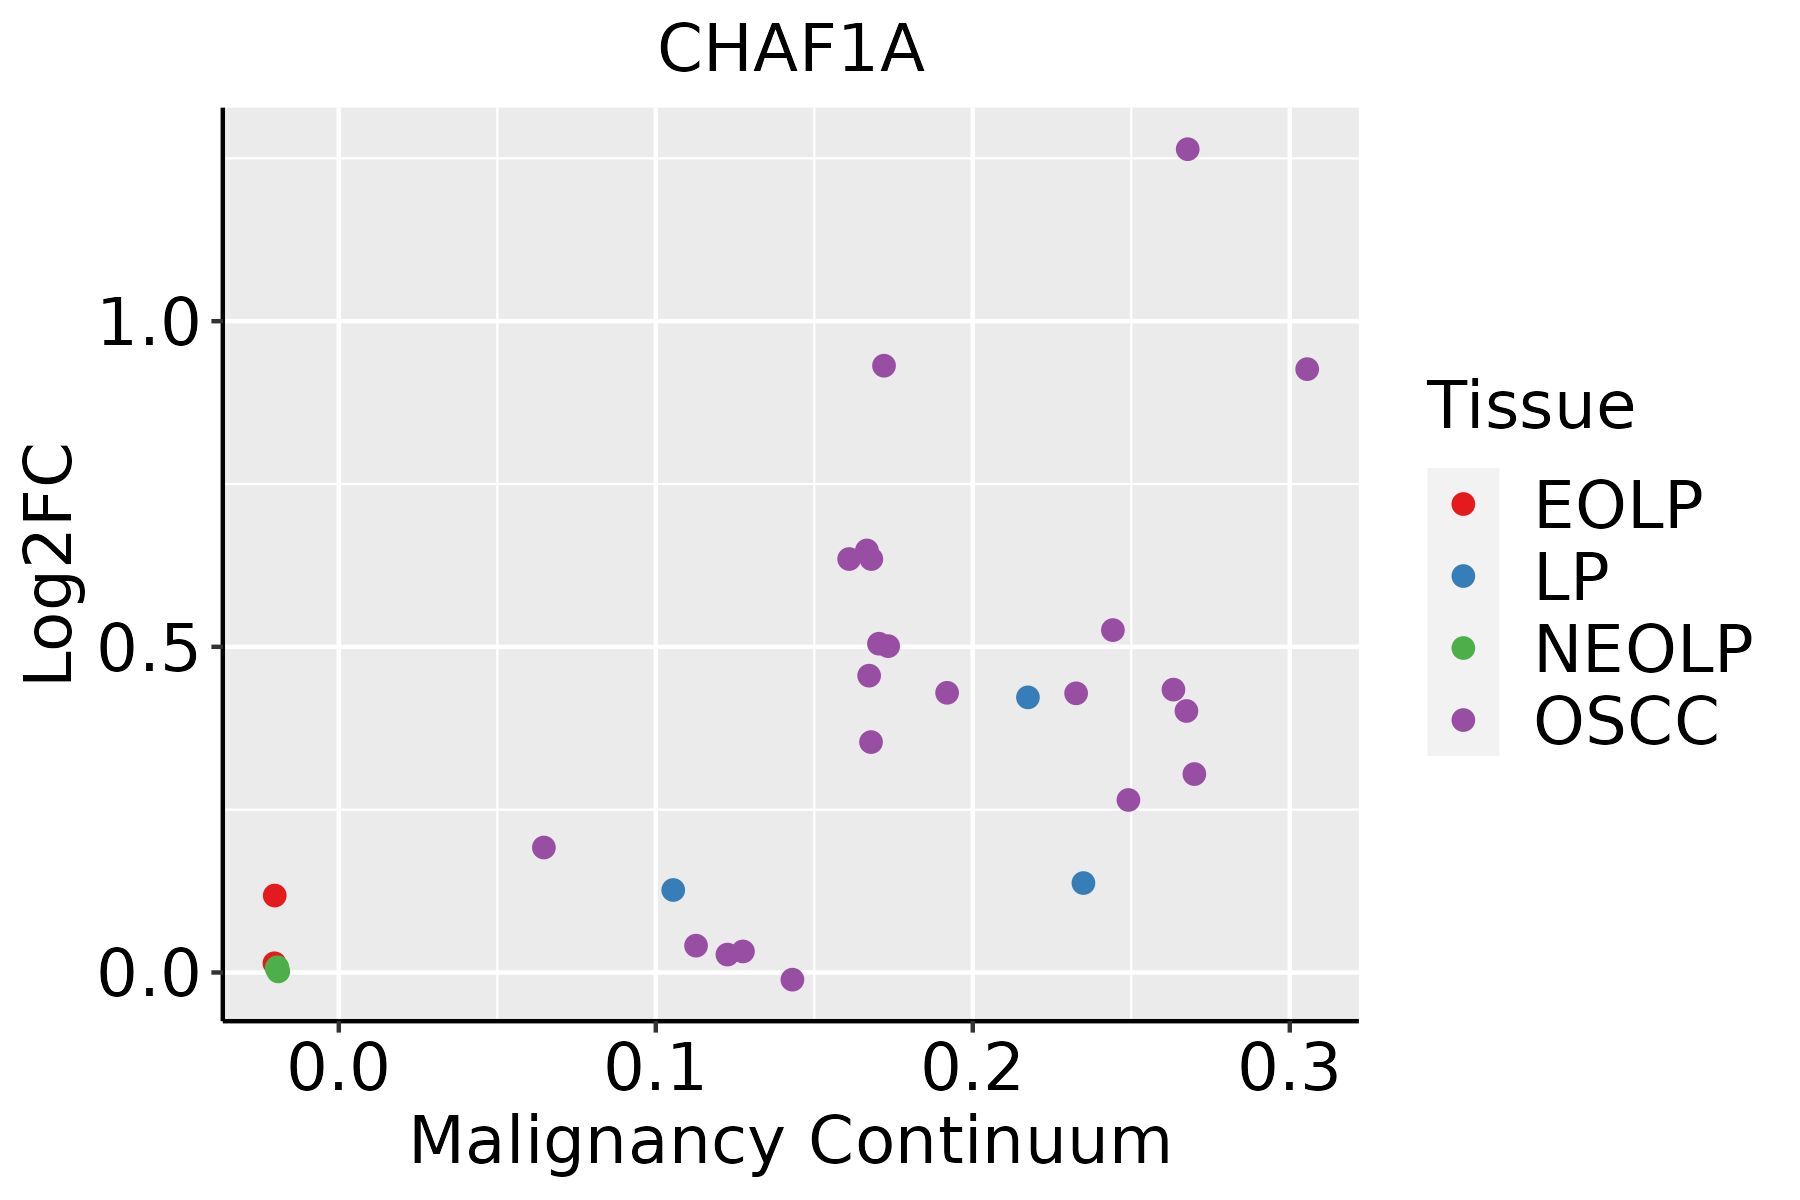 | EOLP: Erosive Oral lichen planus |
| LP: leukoplakia | ||
| NEOLP: Non-erosive oral lichen planus | ||
| OSCC: Oral squamous cell carcinoma | ||
| Thyroid | 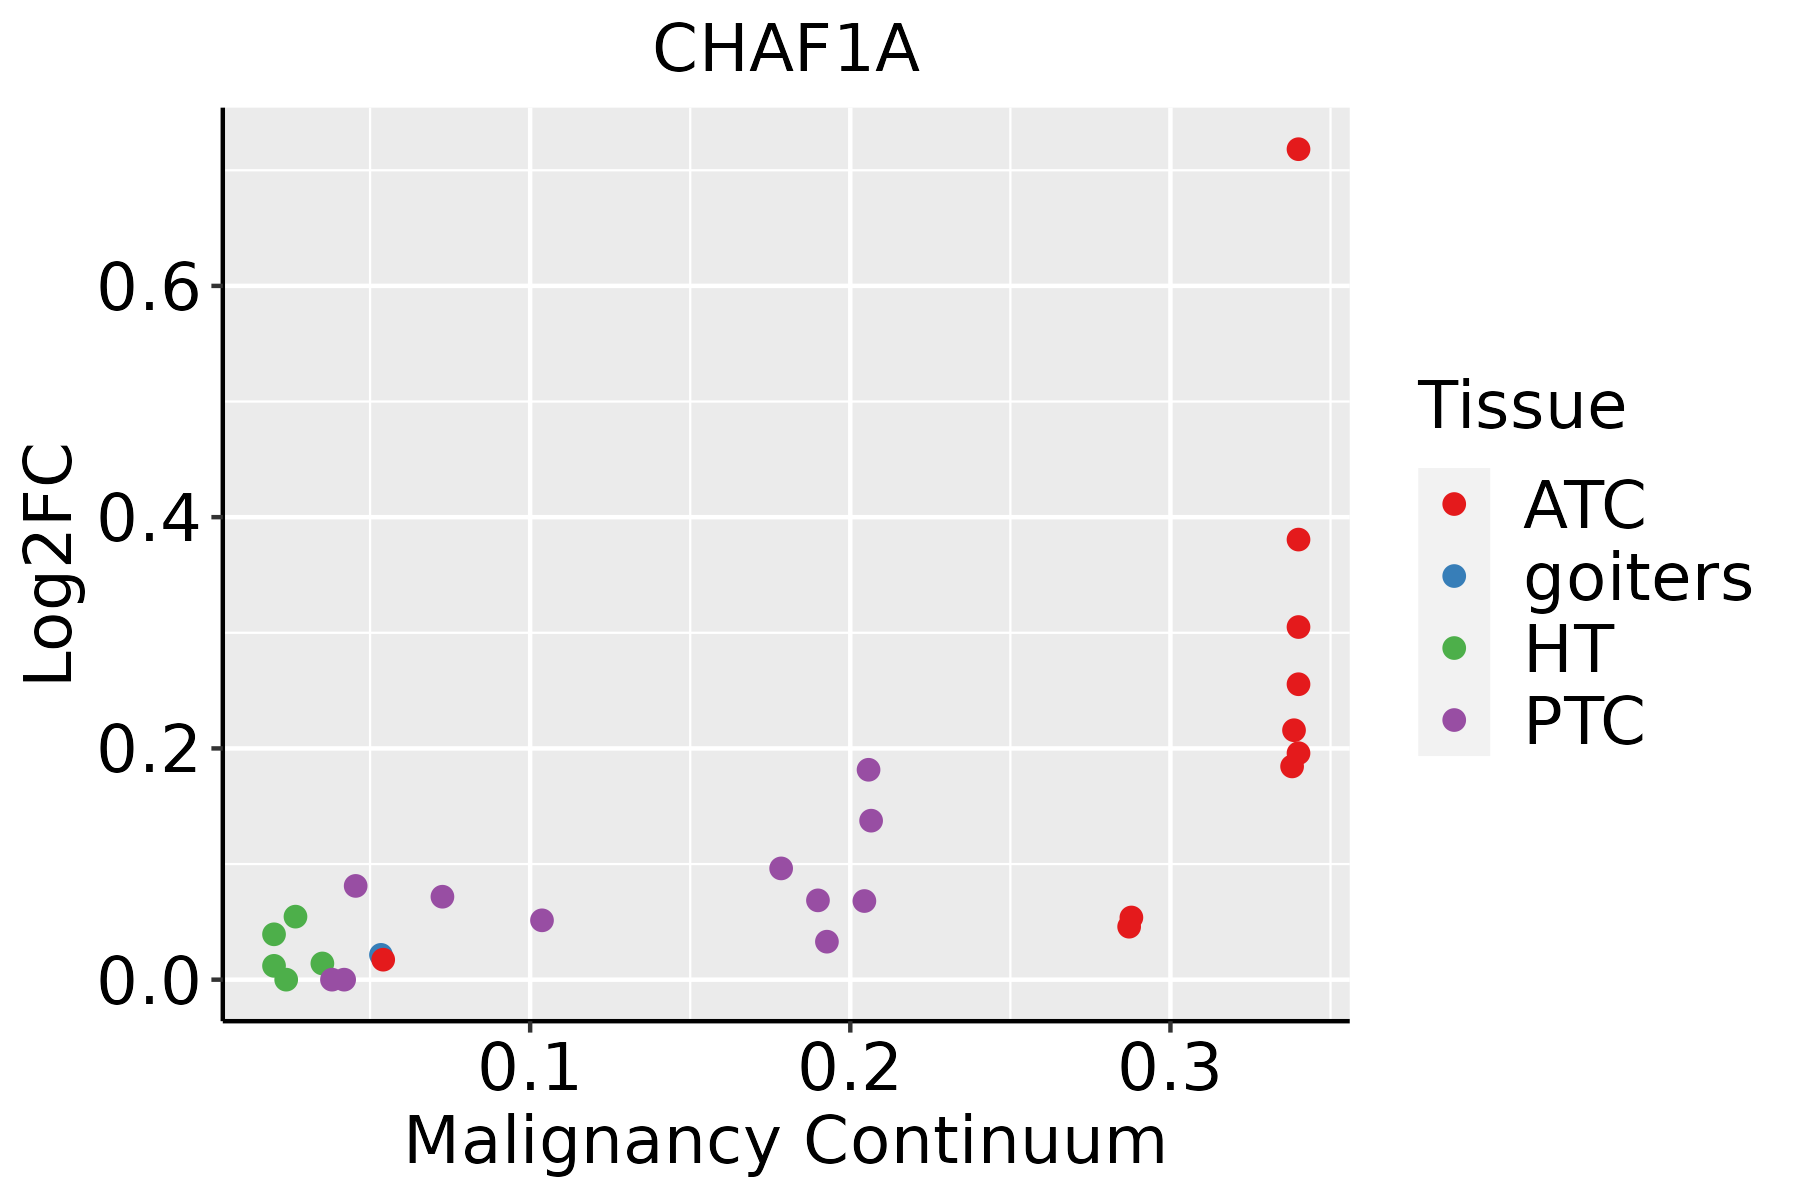 | ATC: Anaplastic thyroid cancer |
| HT: Hashimoto's thyroiditis | ||
| PTC: Papillary thyroid cancer |
| ∗log2FC in expression of this searched gene in stem-like cells from each diseased tissue sample relative to stem-like cells in normal samples in each tissue plotted against the malignancy continuum. Samples are colored based on if they are from different disease stage. |
Top |
Malignant transformation related pathway analysis |
| Find out the enriched GO biological processes and KEGG pathways involved in transition from healthy to precancer to cancer |
| Tissue | Disease Stage | Enriched GO biological Processes |
| Colorectum | AD |  |
| Colorectum | SER |  |
| Colorectum | MSS |  |
| Colorectum | MSI-H |  |
| Colorectum | FAP |  |
| ∗Top 15 enriched GO BP terms are showed in the bar plot of each disease state in each tissue. Each row represents a significant GO biological process which is colored according to the -log10(p.adjust). |
| Page: 1 2 3 4 5 6 7 8 9 |
| GO ID | Tissue | Disease Stage | Description | Gene Ratio | Bg Ratio | pvalue | p.adjust | Count |
| GO:00062604 | Esophagus | ESCC | DNA replication | 181/8552 | 260/18723 | 3.55e-15 | 2.05e-13 | 181 |
| GO:000632517 | Esophagus | ESCC | chromatin organization | 240/8552 | 409/18723 | 6.52e-08 | 1.14e-06 | 240 |
| GO:00062603 | Oral cavity | OSCC | DNA replication | 159/7305 | 260/18723 | 3.25e-13 | 1.59e-11 | 159 |
| GO:000632510 | Oral cavity | OSCC | chromatin organization | 190/7305 | 409/18723 | 1.17e-03 | 5.97e-03 | 190 |
| GO:000632520 | Thyroid | PTC | chromatin organization | 183/5968 | 409/18723 | 2.55e-08 | 5.70e-07 | 183 |
| GO:00062606 | Thyroid | PTC | DNA replication | 114/5968 | 260/18723 | 3.09e-05 | 2.95e-04 | 114 |
| GO:00063385 | Thyroid | PTC | chromatin remodeling | 106/5968 | 255/18723 | 6.56e-04 | 4.13e-03 | 106 |
| GO:0006325110 | Thyroid | ATC | chromatin organization | 189/6293 | 409/18723 | 6.40e-08 | 1.13e-06 | 189 |
| GO:000626013 | Thyroid | ATC | DNA replication | 124/6293 | 260/18723 | 1.58e-06 | 1.93e-05 | 124 |
| GO:000633813 | Thyroid | ATC | chromatin remodeling | 109/6293 | 255/18723 | 1.38e-03 | 7.15e-03 | 109 |
| GO:00718242 | Thyroid | ATC | protein-DNA complex subunit organization | 103/6293 | 241/18723 | 1.84e-03 | 9.03e-03 | 103 |
| Page: 1 |
| Pathway ID | Tissue | Disease Stage | Description | Gene Ratio | Bg Ratio | pvalue | p.adjust | qvalue | Count |
| Page: 1 |
Top |
Cell-cell communication analysis |
| Identification of potential cell-cell interactions between two cell types and their ligand-receptor pairs for different disease states |
| Ligand | Receptor | LRpair | Pathway | Tissue | Disease Stage |
| Page: 1 |
Top |
Single-cell gene regulatory network inference analysis |
| Find out the significant the regulons (TFs) and the target genes of each regulon across cell types for different disease states |
| TF | Cell Type | Tissue | Disease Stage | Target Gene | RSS | Regulon Activity |
| ∗The dot plots of a searched regulon are shown for all cell subpopulations in each disease state of each tissue based on the regulon specific score inferred using pySCENIC and by calculating the average expression. |
| Page: 1 |
Top |
Somatic mutation of malignant transformation related genes |
| Annotation of somatic variants for genes involved in malignant transformation |
| Hugo Symbol | Variant Class | Variant Classification | dbSNP RS | HGVSc | HGVSp | HGVSp Short | SWISSPROT | BIOTYPE | SIFT | PolyPhen | Tumor Sample Barcode | Tissue | Histology | Sex | Age | Stage | Therapy Types | Drugs | Outcome |
| CHAF1A | SNV | Missense_Mutation | c.1709N>G | p.Tyr570Cys | p.Y570C | Q13111 | protein_coding | deleterious(0) | probably_damaging(1) | TCGA-BH-A0W5-01 | Breast | breast invasive carcinoma | Female | >=65 | I/II | Hormone Therapy | arimidex | CR | |
| CHAF1A | SNV | Missense_Mutation | novel | c.2725N>A | p.Glu909Lys | p.E909K | Q13111 | protein_coding | deleterious(0.01) | probably_damaging(0.979) | TCGA-BH-A1F8-01 | Breast | breast invasive carcinoma | Female | >=65 | III/IV | Unknown | Unknown | PD |
| CHAF1A | SNV | Missense_Mutation | c.1182N>C | p.Glu394Asp | p.E394D | Q13111 | protein_coding | tolerated(0.13) | probably_damaging(0.994) | TCGA-D8-A27G-01 | Breast | breast invasive carcinoma | Female | >=65 | I/II | Unknown | Unknown | SD | |
| CHAF1A | SNV | Missense_Mutation | novel | c.1099N>A | p.Ala367Thr | p.A367T | Q13111 | protein_coding | deleterious(0) | probably_damaging(0.998) | TCGA-OL-A5D7-01 | Breast | breast invasive carcinoma | Female | >=65 | I/II | Chemotherapy | cytoxan | CR |
| CHAF1A | insertion | Frame_Shift_Ins | novel | c.524_525insA | p.Leu176ProfsTer52 | p.L176Pfs*52 | Q13111 | protein_coding | TCGA-A7-A0CE-01 | Breast | breast invasive carcinoma | Female | <65 | I/II | Chemotherapy | adriamycin | SD | ||
| CHAF1A | insertion | Nonsense_Mutation | novel | c.526_527insACACCCGGCCCAGATAGTCCCT | p.Leu176HisfsTer6 | p.L176Hfs*6 | Q13111 | protein_coding | TCGA-A7-A0CE-01 | Breast | breast invasive carcinoma | Female | <65 | I/II | Chemotherapy | adriamycin | SD | ||
| CHAF1A | deletion | Frame_Shift_Del | novel | c.1506delN | p.Ser503AlafsTer7 | p.S503Afs*7 | Q13111 | protein_coding | TCGA-D8-A27V-01 | Breast | breast invasive carcinoma | Female | <65 | I/II | Hormone Therapy | tamoxiphen | SD | ||
| CHAF1A | deletion | Frame_Shift_Del | novel | c.252delN | p.Asp84GlufsTer2 | p.D84Efs*2 | Q13111 | protein_coding | TCGA-EW-A2FV-01 | Breast | breast invasive carcinoma | Female | <65 | III/IV | Chemotherapy | docetaxel | SD | ||
| CHAF1A | SNV | Missense_Mutation | c.99N>G | p.Ile33Met | p.I33M | Q13111 | protein_coding | deleterious(0) | possibly_damaging(0.776) | TCGA-FU-A3HZ-01 | Cervix | cervical & endocervical cancer | Female | <65 | I/II | Chemotherapy | cisplatin | CR | |
| CHAF1A | SNV | Missense_Mutation | rs749929809 | c.2540N>T | p.Ser847Leu | p.S847L | Q13111 | protein_coding | deleterious(0.02) | probably_damaging(0.922) | TCGA-IR-A3LI-01 | Cervix | cervical & endocervical cancer | Female | <65 | I/II | Chemotherapy | cisplatin | CR |
| Page: 1 2 3 4 5 6 7 8 9 10 11 |
Top |
Related drugs of malignant transformation related genes |
| Identification of chemicals and drugs interact with genes involved in malignant transfromation |
| (DGIdb 4.0) |
| Entrez ID | Symbol | Category | Interaction Types | Drug Claim Name | Drug Name | PMIDs |
| Page: 1 |

Copyright 2023-Present -The University of Texas Health Science Center at Houston |