
|
|||||
|
 | |
| |
| |
| |
| |
| |
|
Gene: CHAC2 |
Gene summary for CHAC2 |
| Gene information | Species | Human | Gene symbol | CHAC2 | Gene ID | 494143 |
| Gene name | ChaC glutathione specific gamma-glutamylcyclotransferase 2 | |
| Gene Alias | GCG1 | |
| Cytomap | 2p16.2 | |
| Gene Type | protein-coding | GO ID | GO:0006518 | UniProtAcc | Q8WUX2 |
Top |
Malignant transformation analysis |
| Identification of the aberrant gene expression in precancerous and cancerous lesions by comparing the gene expression of stem-like cells in diseased tissues with normal stem cells |
| Entrez ID | Symbol | Replicates | Species | Organ | Tissue | Adj P-value | Log2FC | Malignancy |
| 494143 | CHAC2 | LZE22T | Human | Esophagus | ESCC | 1.57e-02 | 1.98e-01 | 0.068 |
| 494143 | CHAC2 | LZE24T | Human | Esophagus | ESCC | 1.48e-08 | 2.35e-01 | 0.0596 |
| 494143 | CHAC2 | LZE6T | Human | Esophagus | ESCC | 2.96e-03 | 1.31e-01 | 0.0845 |
| 494143 | CHAC2 | P2T-E | Human | Esophagus | ESCC | 6.69e-07 | 1.29e-01 | 0.1177 |
| 494143 | CHAC2 | P4T-E | Human | Esophagus | ESCC | 3.85e-16 | 3.96e-01 | 0.1323 |
| 494143 | CHAC2 | P5T-E | Human | Esophagus | ESCC | 2.55e-06 | 1.38e-01 | 0.1327 |
| 494143 | CHAC2 | P8T-E | Human | Esophagus | ESCC | 1.84e-02 | 4.02e-02 | 0.0889 |
| 494143 | CHAC2 | P12T-E | Human | Esophagus | ESCC | 2.54e-03 | 1.23e-01 | 0.1122 |
| 494143 | CHAC2 | P15T-E | Human | Esophagus | ESCC | 3.16e-13 | 2.96e-01 | 0.1149 |
| 494143 | CHAC2 | P21T-E | Human | Esophagus | ESCC | 4.12e-02 | 1.19e-01 | 0.1617 |
| 494143 | CHAC2 | P22T-E | Human | Esophagus | ESCC | 2.02e-02 | 8.65e-02 | 0.1236 |
| 494143 | CHAC2 | P23T-E | Human | Esophagus | ESCC | 5.52e-07 | 1.75e-01 | 0.108 |
| 494143 | CHAC2 | P26T-E | Human | Esophagus | ESCC | 1.94e-07 | 2.25e-01 | 0.1276 |
| 494143 | CHAC2 | P27T-E | Human | Esophagus | ESCC | 4.60e-09 | 2.59e-01 | 0.1055 |
| 494143 | CHAC2 | P28T-E | Human | Esophagus | ESCC | 1.69e-15 | 2.07e-01 | 0.1149 |
| 494143 | CHAC2 | P30T-E | Human | Esophagus | ESCC | 4.37e-20 | 5.76e-01 | 0.137 |
| 494143 | CHAC2 | P31T-E | Human | Esophagus | ESCC | 1.91e-05 | 1.32e-01 | 0.1251 |
| 494143 | CHAC2 | P32T-E | Human | Esophagus | ESCC | 4.47e-04 | 1.26e-01 | 0.1666 |
| 494143 | CHAC2 | P36T-E | Human | Esophagus | ESCC | 5.72e-04 | 1.24e-01 | 0.1187 |
| 494143 | CHAC2 | P37T-E | Human | Esophagus | ESCC | 5.94e-11 | 2.51e-01 | 0.1371 |
| Page: 1 2 3 |
| Tissue | Expression Dynamics | Abbreviation |
| Esophagus | 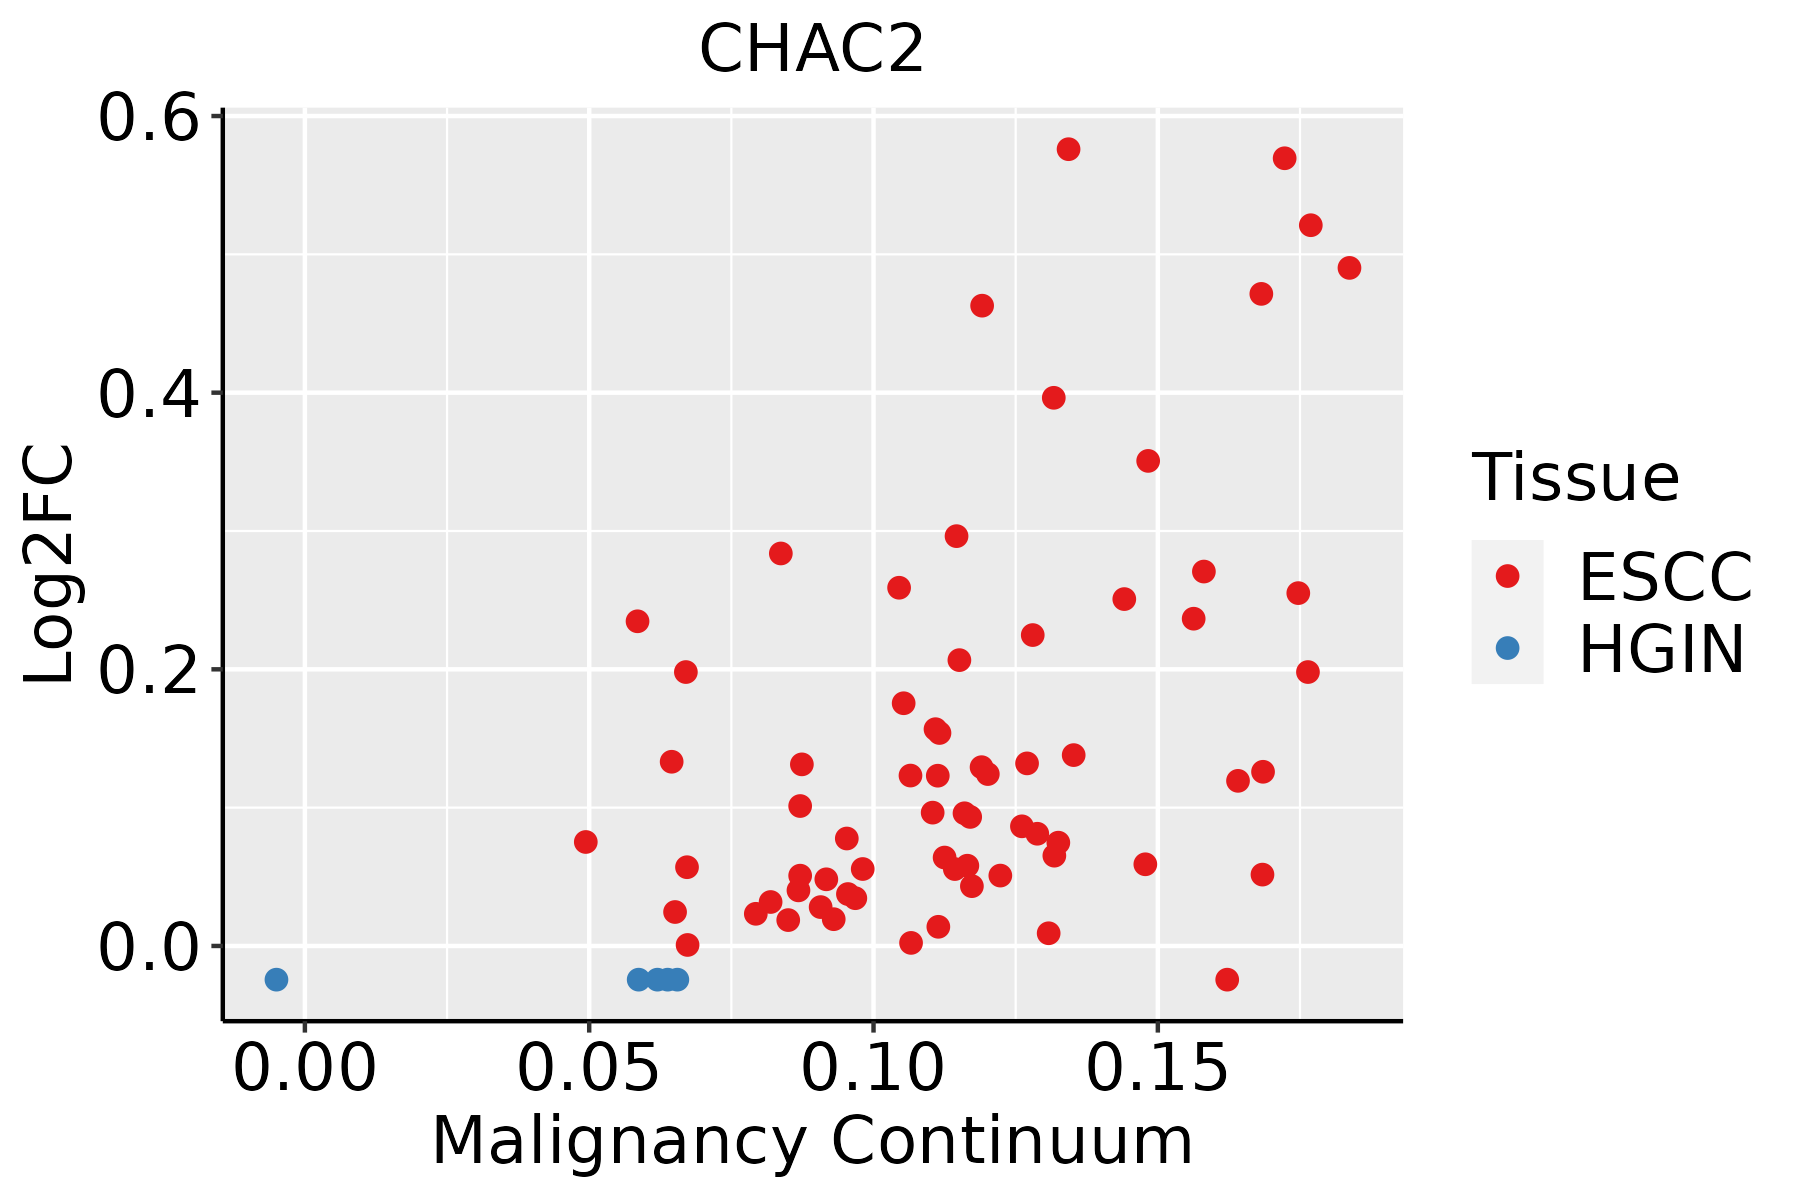 | ESCC: Esophageal squamous cell carcinoma |
| HGIN: High-grade intraepithelial neoplasias | ||
| LGIN: Low-grade intraepithelial neoplasias | ||
| Oral Cavity | 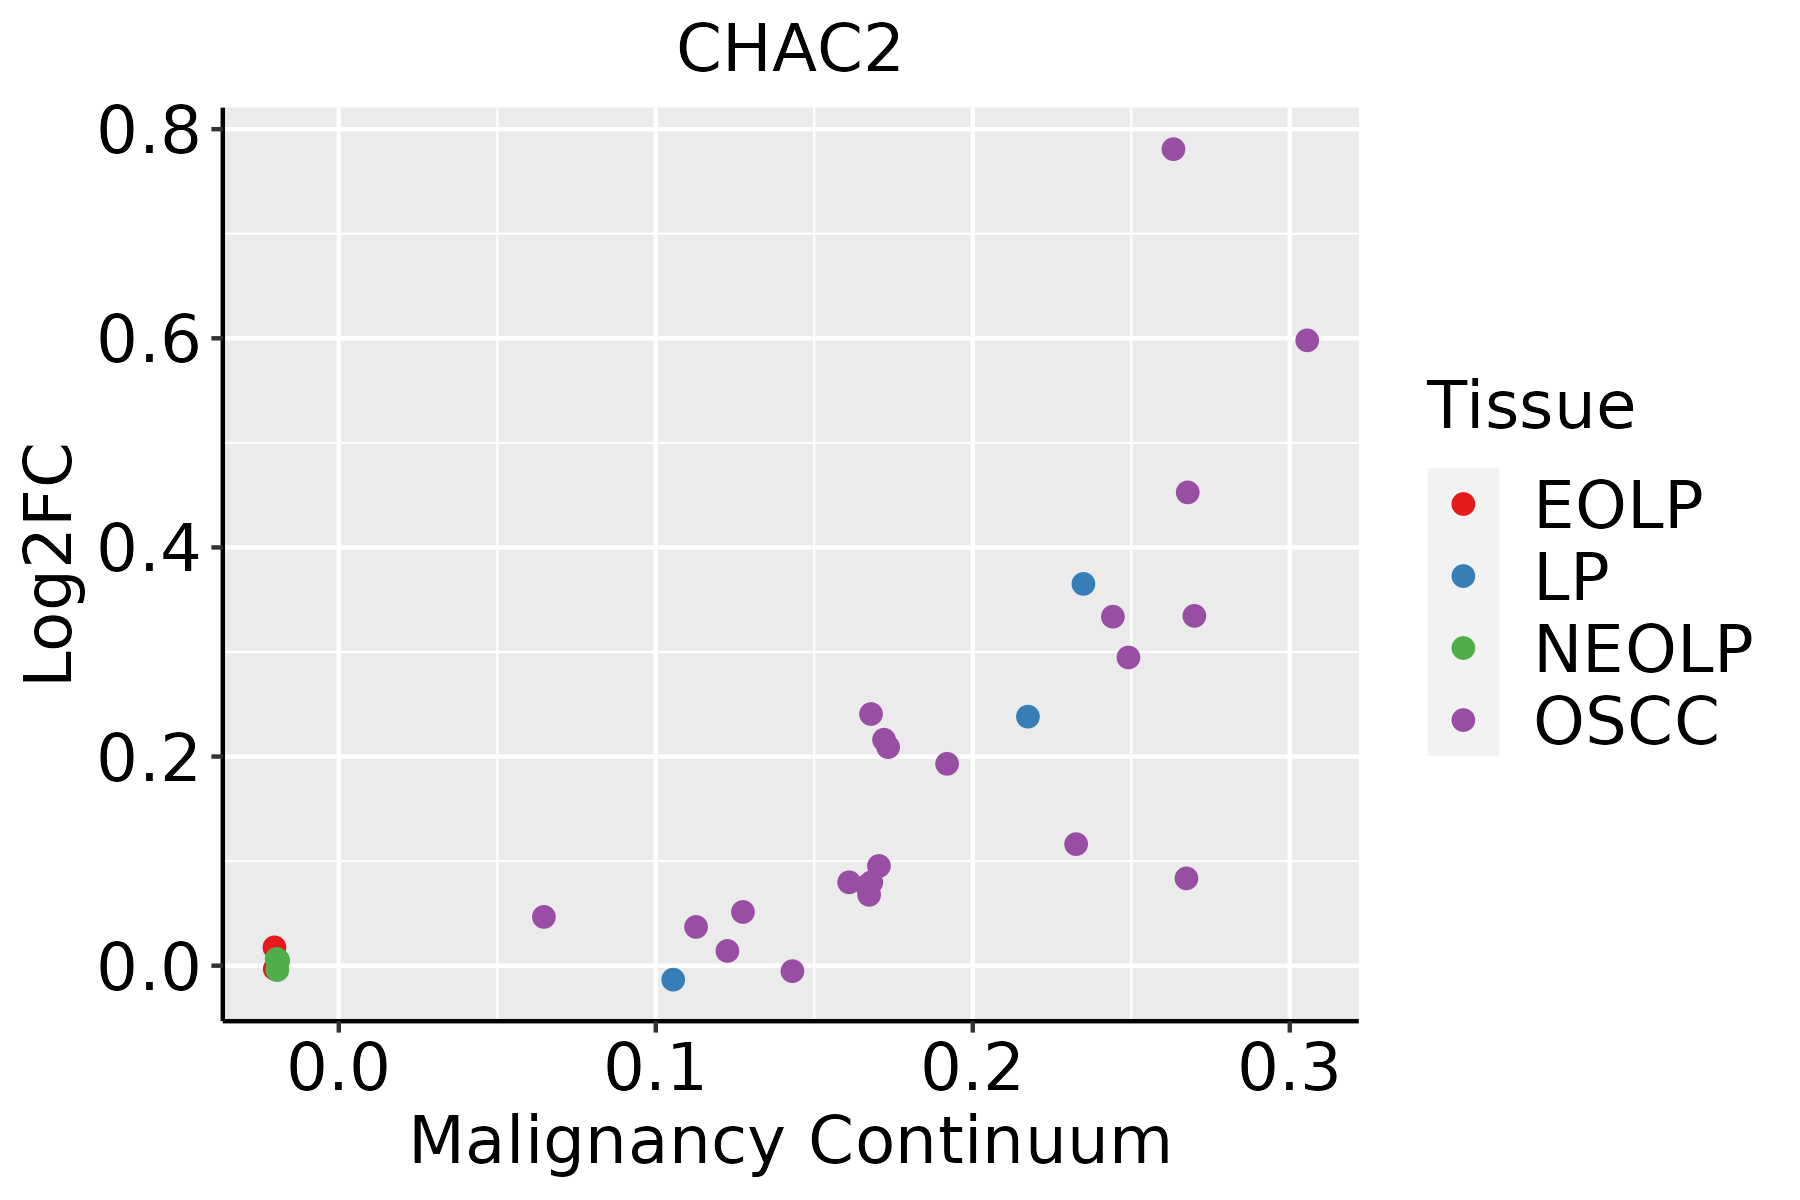 | EOLP: Erosive Oral lichen planus |
| LP: leukoplakia | ||
| NEOLP: Non-erosive oral lichen planus | ||
| OSCC: Oral squamous cell carcinoma |
| ∗log2FC in expression of this searched gene in stem-like cells from each diseased tissue sample relative to stem-like cells in normal samples in each tissue plotted against the malignancy continuum. Samples are colored based on if they are from different disease stage. |
Top |
Malignant transformation related pathway analysis |
| Find out the enriched GO biological processes and KEGG pathways involved in transition from healthy to precancer to cancer |
| Tissue | Disease Stage | Enriched GO biological Processes |
| Colorectum | AD |  |
| Colorectum | SER |  |
| Colorectum | MSS |  |
| Colorectum | MSI-H |  |
| Colorectum | FAP |  |
| ∗Top 15 enriched GO BP terms are showed in the bar plot of each disease state in each tissue. Each row represents a significant GO biological process which is colored according to the -log10(p.adjust). |
| Page: 1 2 3 4 5 6 7 8 9 |
| GO ID | Tissue | Disease Stage | Description | Gene Ratio | Bg Ratio | pvalue | p.adjust | Count |
| GO:00067906 | Esophagus | ESCC | sulfur compound metabolic process | 201/8552 | 339/18723 | 2.64e-07 | 3.94e-06 | 201 |
| GO:00442725 | Esophagus | ESCC | sulfur compound biosynthetic process | 96/8552 | 148/18723 | 1.86e-06 | 2.16e-05 | 96 |
| GO:00065757 | Esophagus | ESCC | cellular modified amino acid metabolic process | 112/8552 | 188/18723 | 8.31e-05 | 6.06e-04 | 112 |
| GO:00423986 | Esophagus | ESCC | cellular modified amino acid biosynthetic process | 34/8552 | 46/18723 | 9.39e-05 | 6.70e-04 | 34 |
| GO:000674912 | Esophagus | ESCC | glutathione metabolic process | 42/8552 | 64/18723 | 1.01e-03 | 5.12e-03 | 42 |
| GO:00442724 | Oral cavity | OSCC | sulfur compound biosynthetic process | 82/7305 | 148/18723 | 3.71e-05 | 3.31e-04 | 82 |
| GO:00067905 | Oral cavity | OSCC | sulfur compound metabolic process | 168/7305 | 339/18723 | 4.50e-05 | 3.84e-04 | 168 |
| GO:00423985 | Oral cavity | OSCC | cellular modified amino acid biosynthetic process | 31/7305 | 46/18723 | 9.03e-05 | 6.88e-04 | 31 |
| GO:00065756 | Oral cavity | OSCC | cellular modified amino acid metabolic process | 91/7305 | 188/18723 | 5.33e-03 | 2.07e-02 | 91 |
| Page: 1 |
| Pathway ID | Tissue | Disease Stage | Description | Gene Ratio | Bg Ratio | pvalue | p.adjust | qvalue | Count |
| hsa0048018 | Esophagus | ESCC | Glutathione metabolism | 44/4205 | 57/8465 | 1.81e-05 | 9.03e-05 | 4.63e-05 | 44 |
| hsa0048019 | Esophagus | ESCC | Glutathione metabolism | 44/4205 | 57/8465 | 1.81e-05 | 9.03e-05 | 4.63e-05 | 44 |
| Page: 1 |
Top |
Cell-cell communication analysis |
| Identification of potential cell-cell interactions between two cell types and their ligand-receptor pairs for different disease states |
| Ligand | Receptor | LRpair | Pathway | Tissue | Disease Stage |
| Page: 1 |
Top |
Single-cell gene regulatory network inference analysis |
| Find out the significant the regulons (TFs) and the target genes of each regulon across cell types for different disease states |
| TF | Cell Type | Tissue | Disease Stage | Target Gene | RSS | Regulon Activity |
| ∗The dot plots of a searched regulon are shown for all cell subpopulations in each disease state of each tissue based on the regulon specific score inferred using pySCENIC and by calculating the average expression. |
| Page: 1 |
Top |
Somatic mutation of malignant transformation related genes |
| Annotation of somatic variants for genes involved in malignant transformation |
| Hugo Symbol | Variant Class | Variant Classification | dbSNP RS | HGVSc | HGVSp | HGVSp Short | SWISSPROT | BIOTYPE | SIFT | PolyPhen | Tumor Sample Barcode | Tissue | Histology | Sex | Age | Stage | Therapy Types | Drugs | Outcome |
| CHAC2 | SNV | Missense_Mutation | rs772317458 | c.526G>A | p.Glu176Lys | p.E176K | Q8WUX2 | protein_coding | tolerated(0.28) | benign(0.003) | TCGA-LD-A74U-01 | Breast | breast invasive carcinoma | Female | >=65 | III/IV | Chemotherapy | taxotere | SD |
| CHAC2 | insertion | Nonsense_Mutation | novel | c.530_531insCTAATTAAAATAGGTGAA | p.Gly177_Lys178insTer | p.G177_K178ins* | Q8WUX2 | protein_coding | TCGA-AR-A0U0-01 | Breast | breast invasive carcinoma | Female | >=65 | I/II | Unknown | Unknown | SD | ||
| CHAC2 | SNV | Missense_Mutation | c.526G>C | p.Glu176Gln | p.E176Q | Q8WUX2 | protein_coding | tolerated(0.28) | benign(0.012) | TCGA-AG-A016-01 | Colorectum | rectum adenocarcinoma | Male | <65 | III/IV | Chemotherapy | 5-fluorouracil | SD | |
| CHAC2 | SNV | Missense_Mutation | c.464N>G | p.Leu155Arg | p.L155R | Q8WUX2 | protein_coding | deleterious(0) | probably_damaging(0.948) | TCGA-F5-6814-01 | Colorectum | rectum adenocarcinoma | Male | <65 | I/II | Unknown | Unknown | SD | |
| CHAC2 | SNV | Missense_Mutation | novel | c.91N>T | p.Arg31Cys | p.R31C | Q8WUX2 | protein_coding | deleterious(0.03) | probably_damaging(0.999) | TCGA-AP-A1DV-01 | Endometrium | uterine corpus endometrioid carcinoma | Female | <65 | I/II | Unknown | Unknown | SD |
| CHAC2 | SNV | Missense_Mutation | novel | c.322N>A | p.Leu108Ile | p.L108I | Q8WUX2 | protein_coding | tolerated(0.75) | benign(0.035) | TCGA-AX-A1CE-01 | Endometrium | uterine corpus endometrioid carcinoma | Female | <65 | I/II | Unspecific | Paclitaxel | SD |
| CHAC2 | SNV | Missense_Mutation | c.452N>A | p.Ser151Tyr | p.S151Y | Q8WUX2 | protein_coding | tolerated(0.06) | benign(0.081) | TCGA-B5-A0JY-01 | Endometrium | uterine corpus endometrioid carcinoma | Female | <65 | III/IV | Chemotherapy | doxorubicin | SD | |
| CHAC2 | SNV | Missense_Mutation | novel | c.304N>G | p.Lys102Glu | p.K102E | Q8WUX2 | protein_coding | tolerated(1) | benign(0) | TCGA-B5-A3FA-01 | Endometrium | uterine corpus endometrioid carcinoma | Female | >=65 | I/II | Unknown | Unknown | SD |
| CHAC2 | SNV | Missense_Mutation | c.229N>A | p.Ala77Thr | p.A77T | Q8WUX2 | protein_coding | tolerated(0.56) | benign(0.009) | TCGA-B5-A3FC-01 | Endometrium | uterine corpus endometrioid carcinoma | Female | <65 | I/II | Unknown | Unknown | SD | |
| CHAC2 | SNV | Missense_Mutation | c.452C>A | p.Ser151Tyr | p.S151Y | Q8WUX2 | protein_coding | tolerated(0.06) | benign(0.081) | TCGA-EO-A22R-01 | Endometrium | uterine corpus endometrioid carcinoma | Female | <65 | I/II | Unknown | Unknown | SD |
| Page: 1 2 |
Top |
Related drugs of malignant transformation related genes |
| Identification of chemicals and drugs interact with genes involved in malignant transfromation |
| (DGIdb 4.0) |
| Entrez ID | Symbol | Category | Interaction Types | Drug Claim Name | Drug Name | PMIDs |
| Page: 1 |

Copyright 2023-Present -The University of Texas Health Science Center at Houston |